
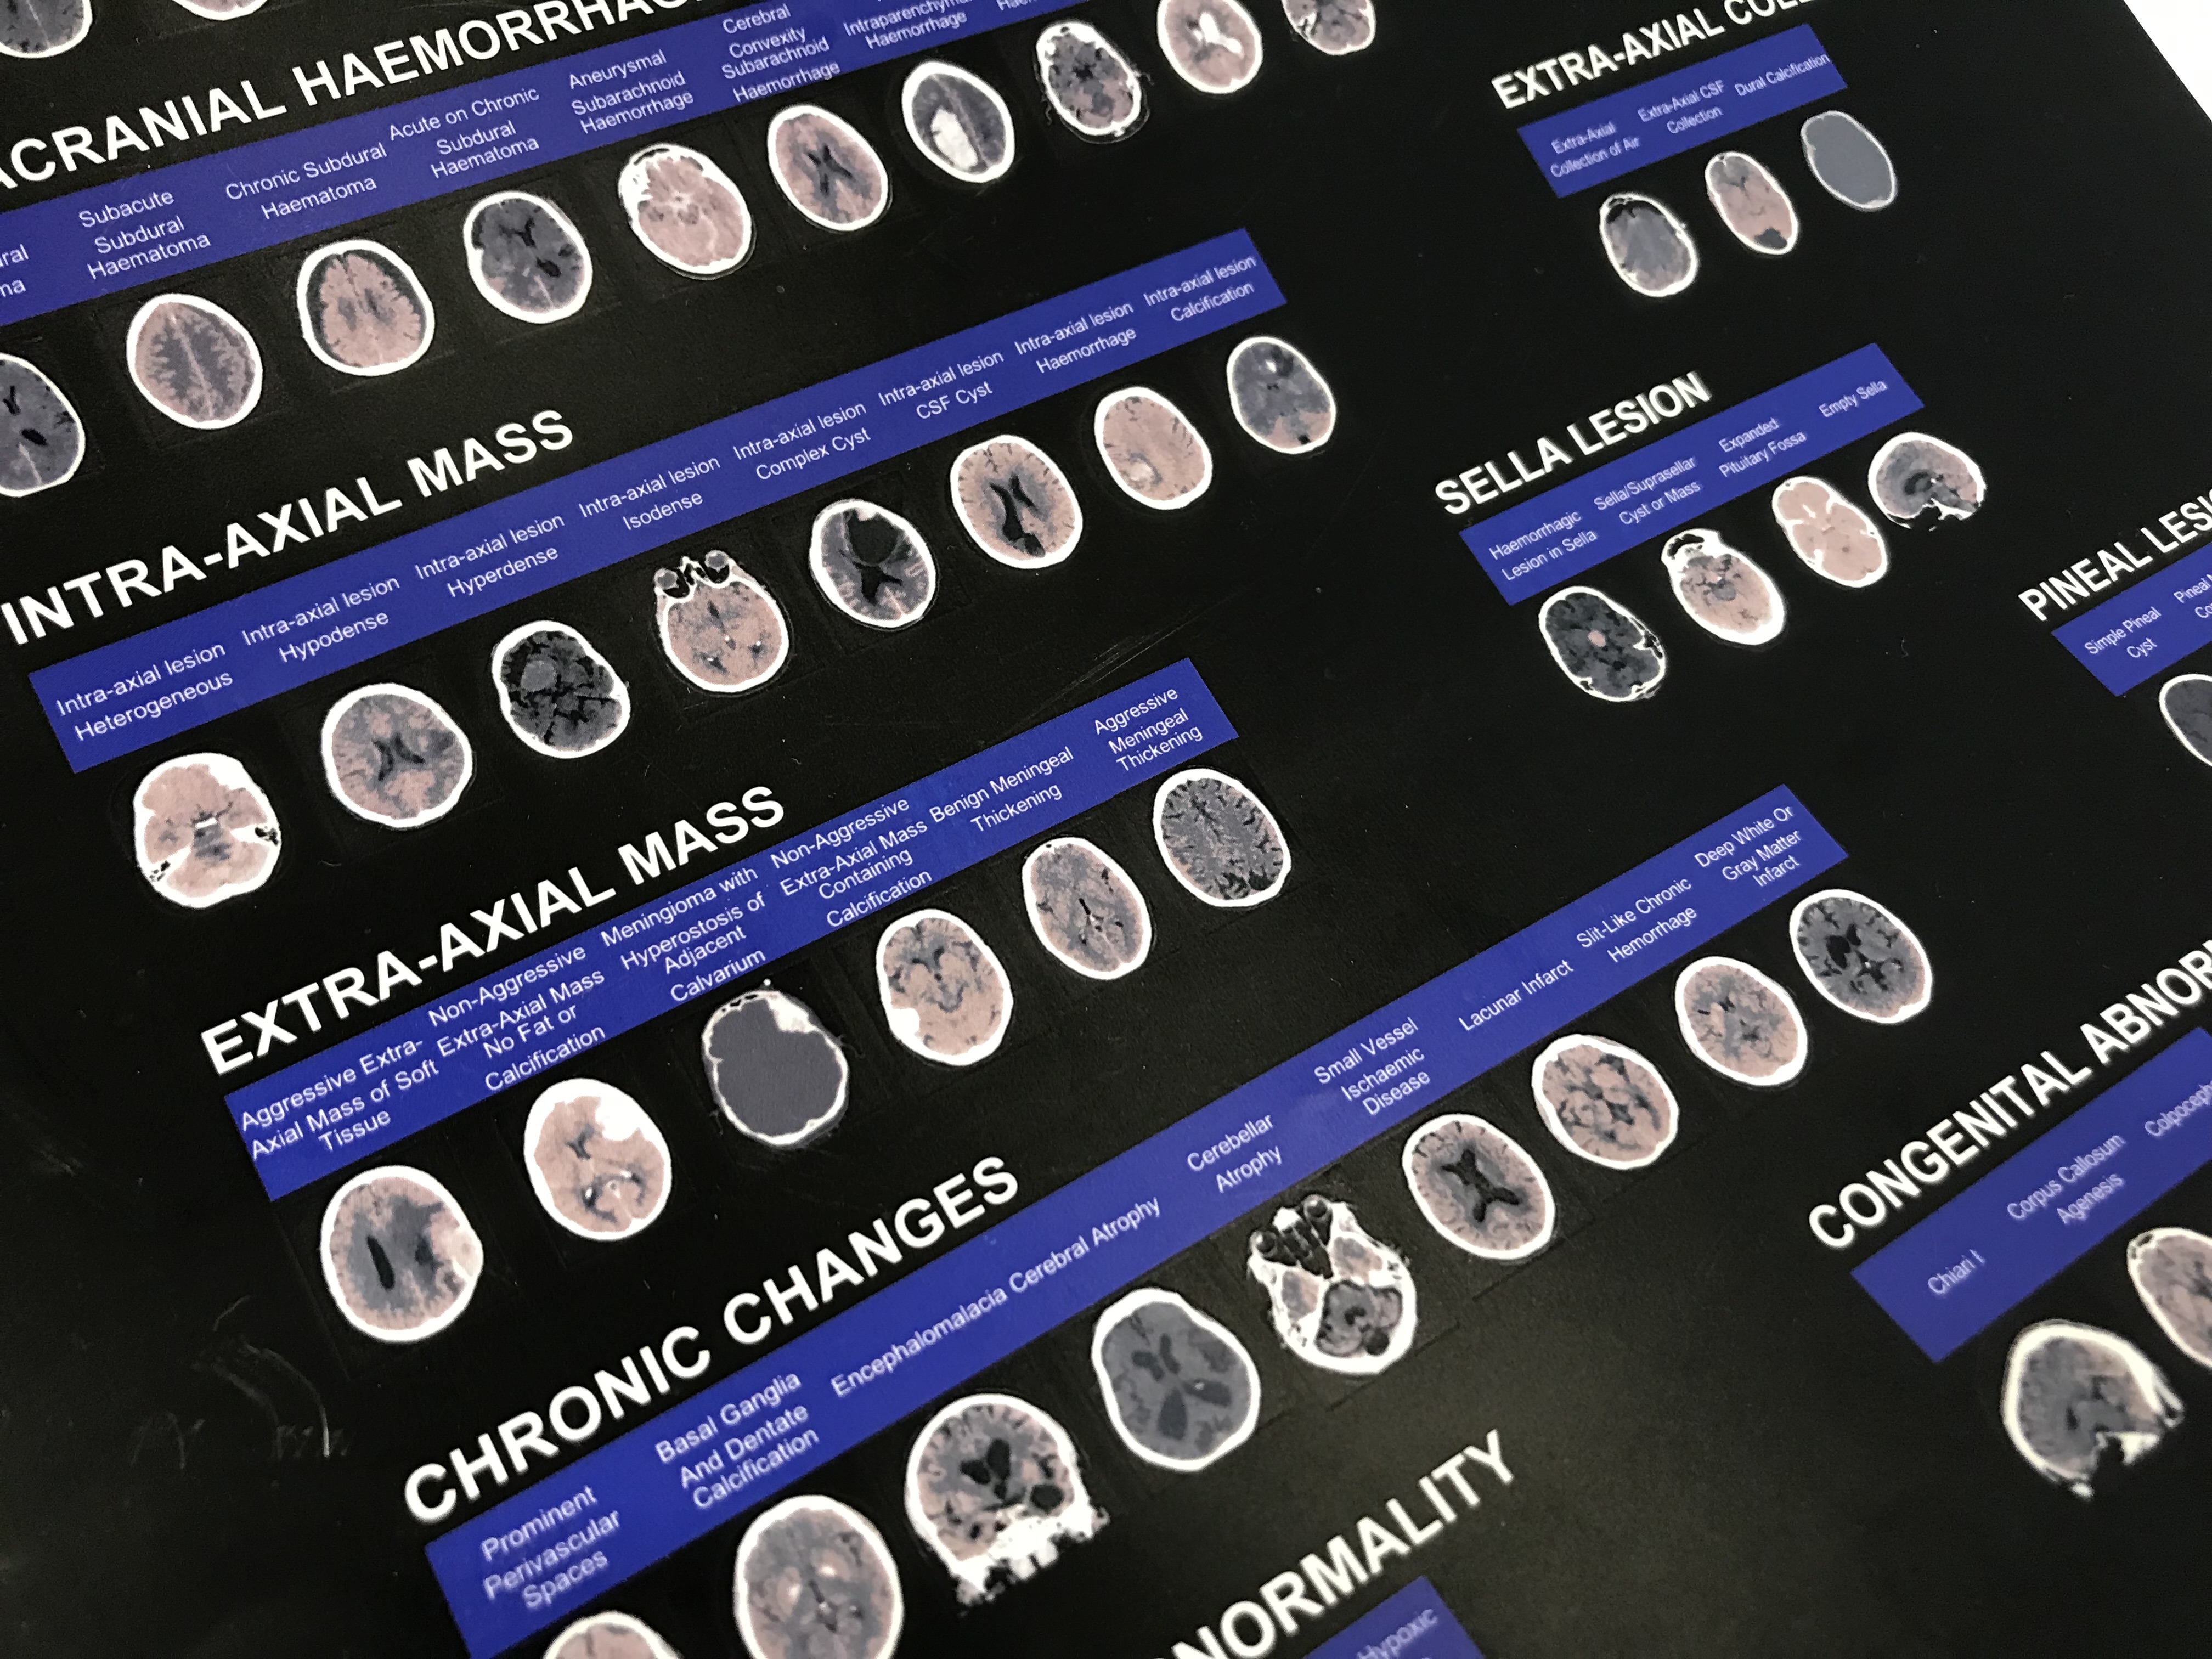
PHOTO GALLERY of brain imaging
This is a clinical photo gallery showcasing neuroimaging and its visualization through magnetic resonance imaging (MRI), computed tomography (CT), nuclear imaging, and ultrasound. Hover over the images to view captions, and click on them to enlarge.
MRI serves as the gold standard for neuroimaging due to its high soft tissue resolution and its capacity to depict physiology and trace neuronal pathways. CT is also widely utilized, particularly in emergency rooms for patients with acute conditions.
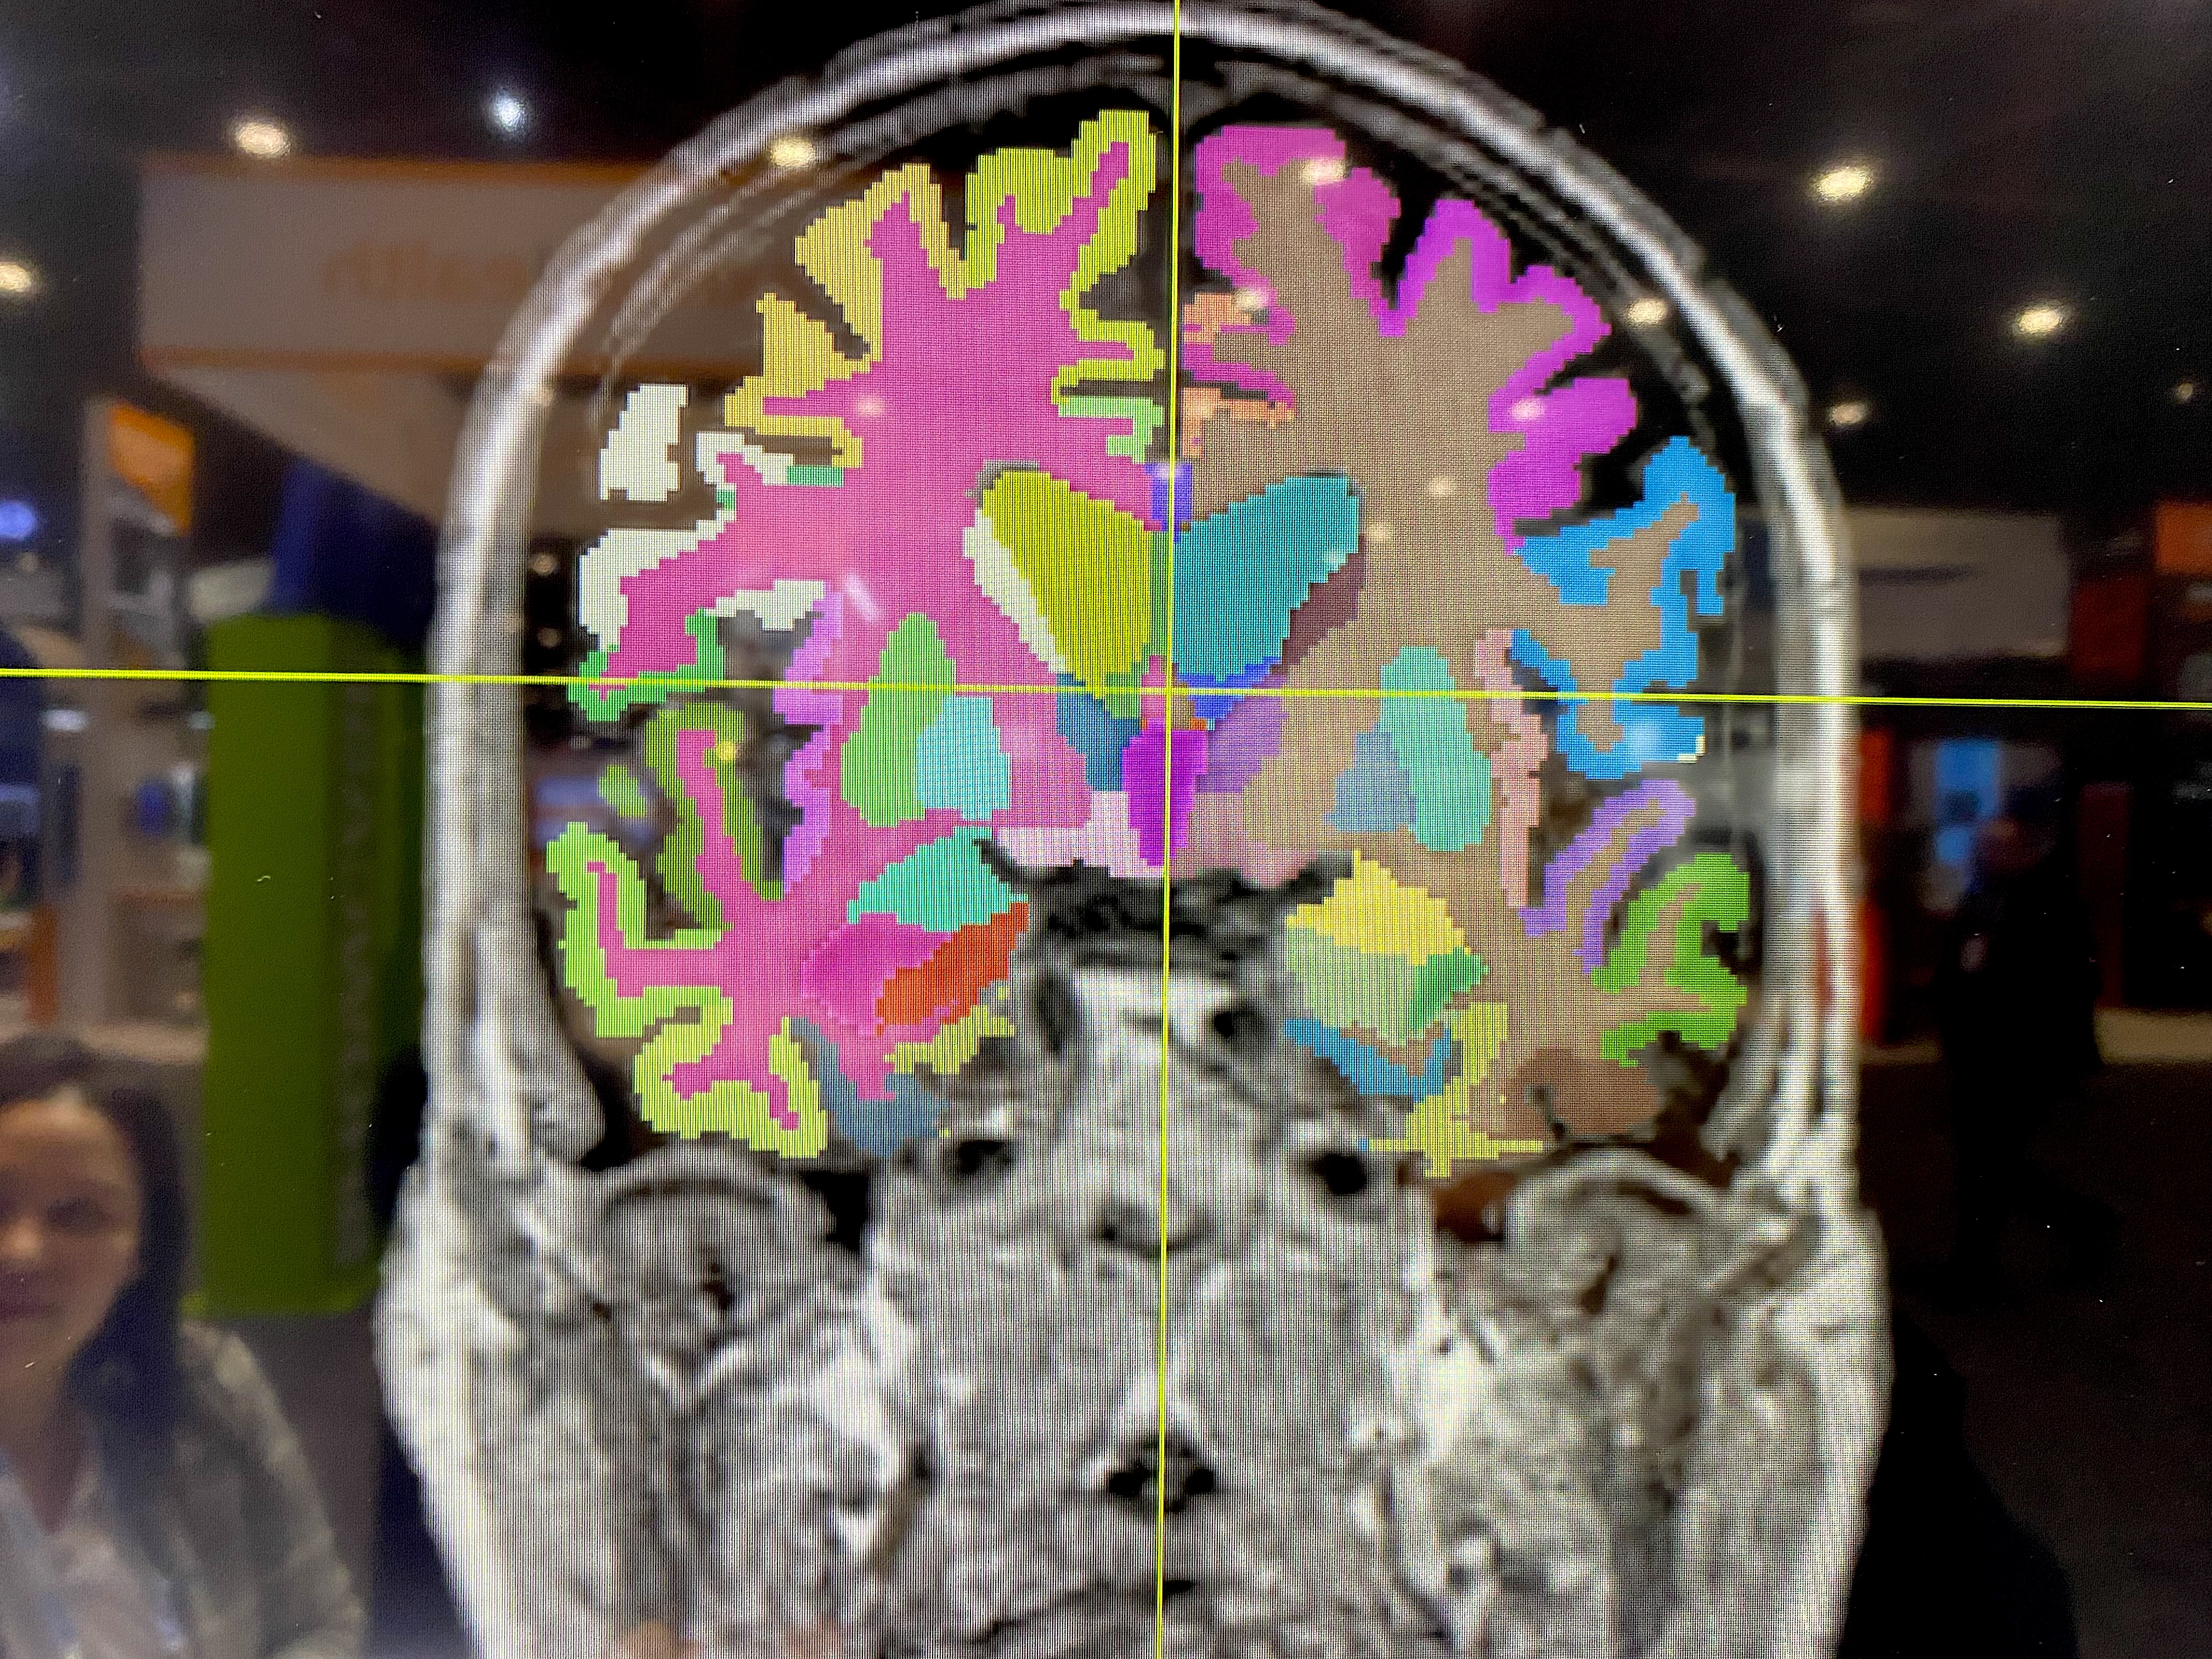
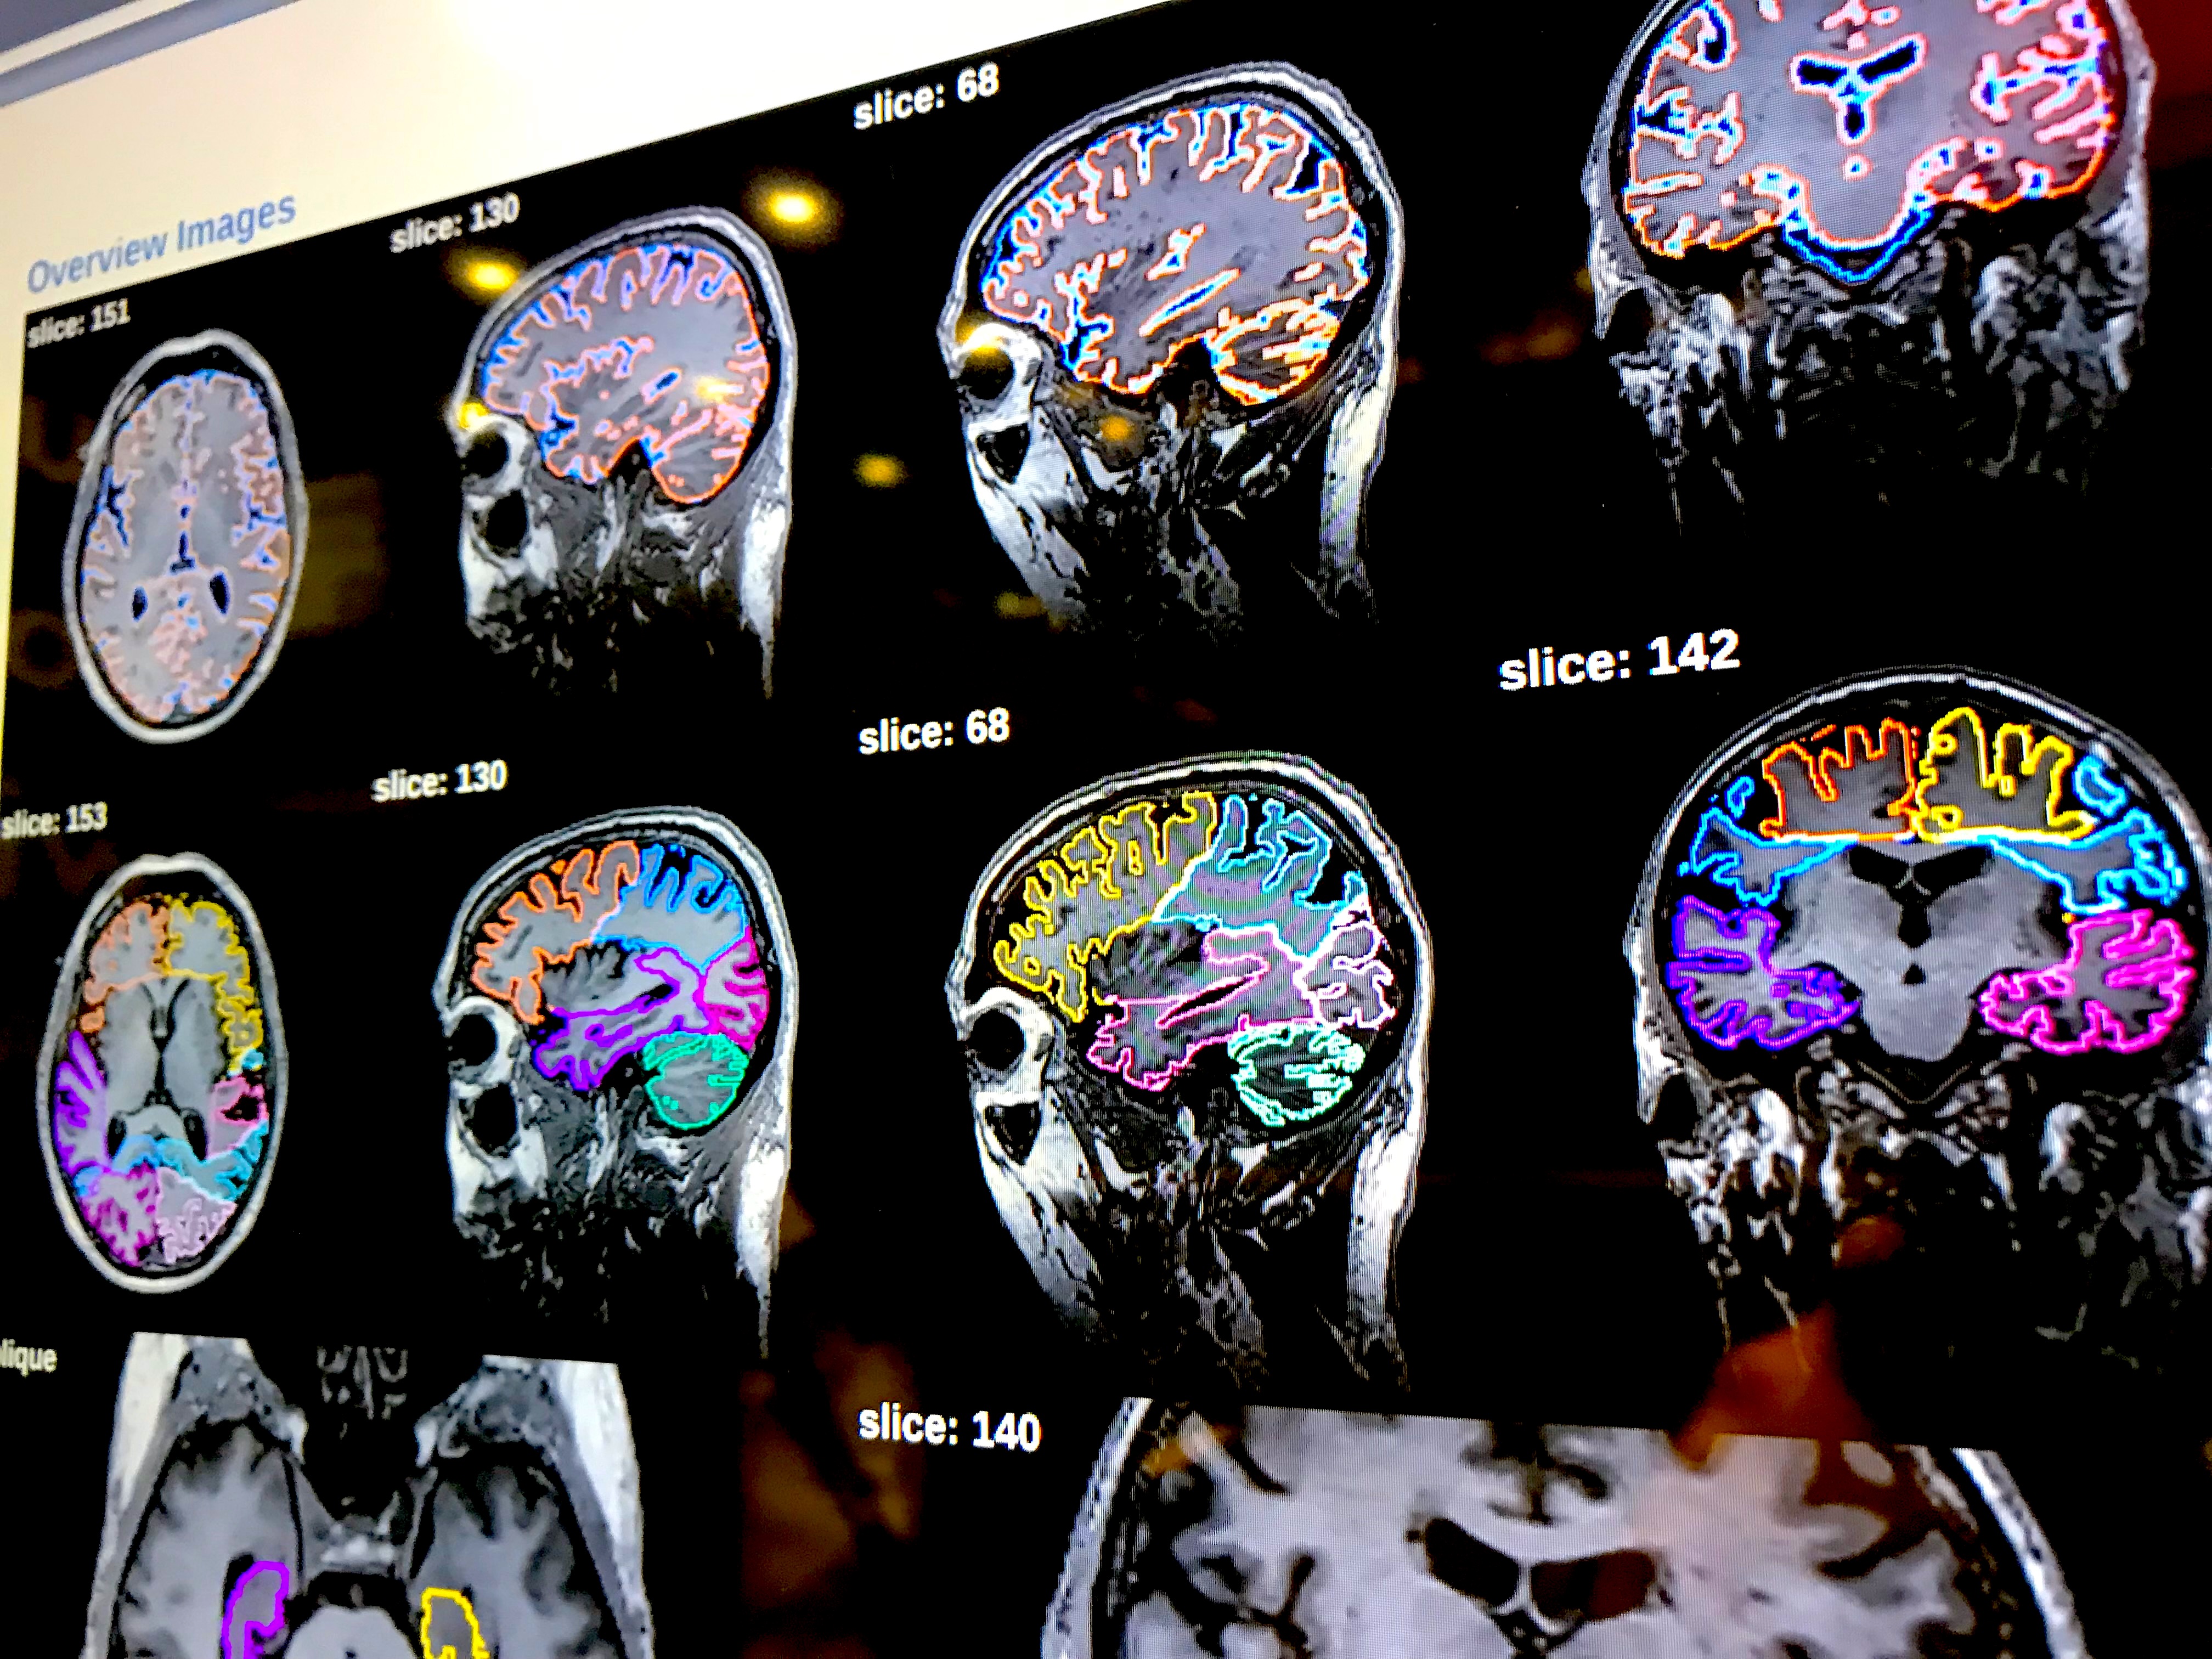
The utilization of artificial intelligence (AI) in radiology is on the rise, aiding in expediting tedious tasks like delineating different anatomical structures and conducting measurements. The image demonstrates automated AI segmentation and quantification through the Vuno Med Deep Brain algorithm, capable of generating over 100 volume measurements.
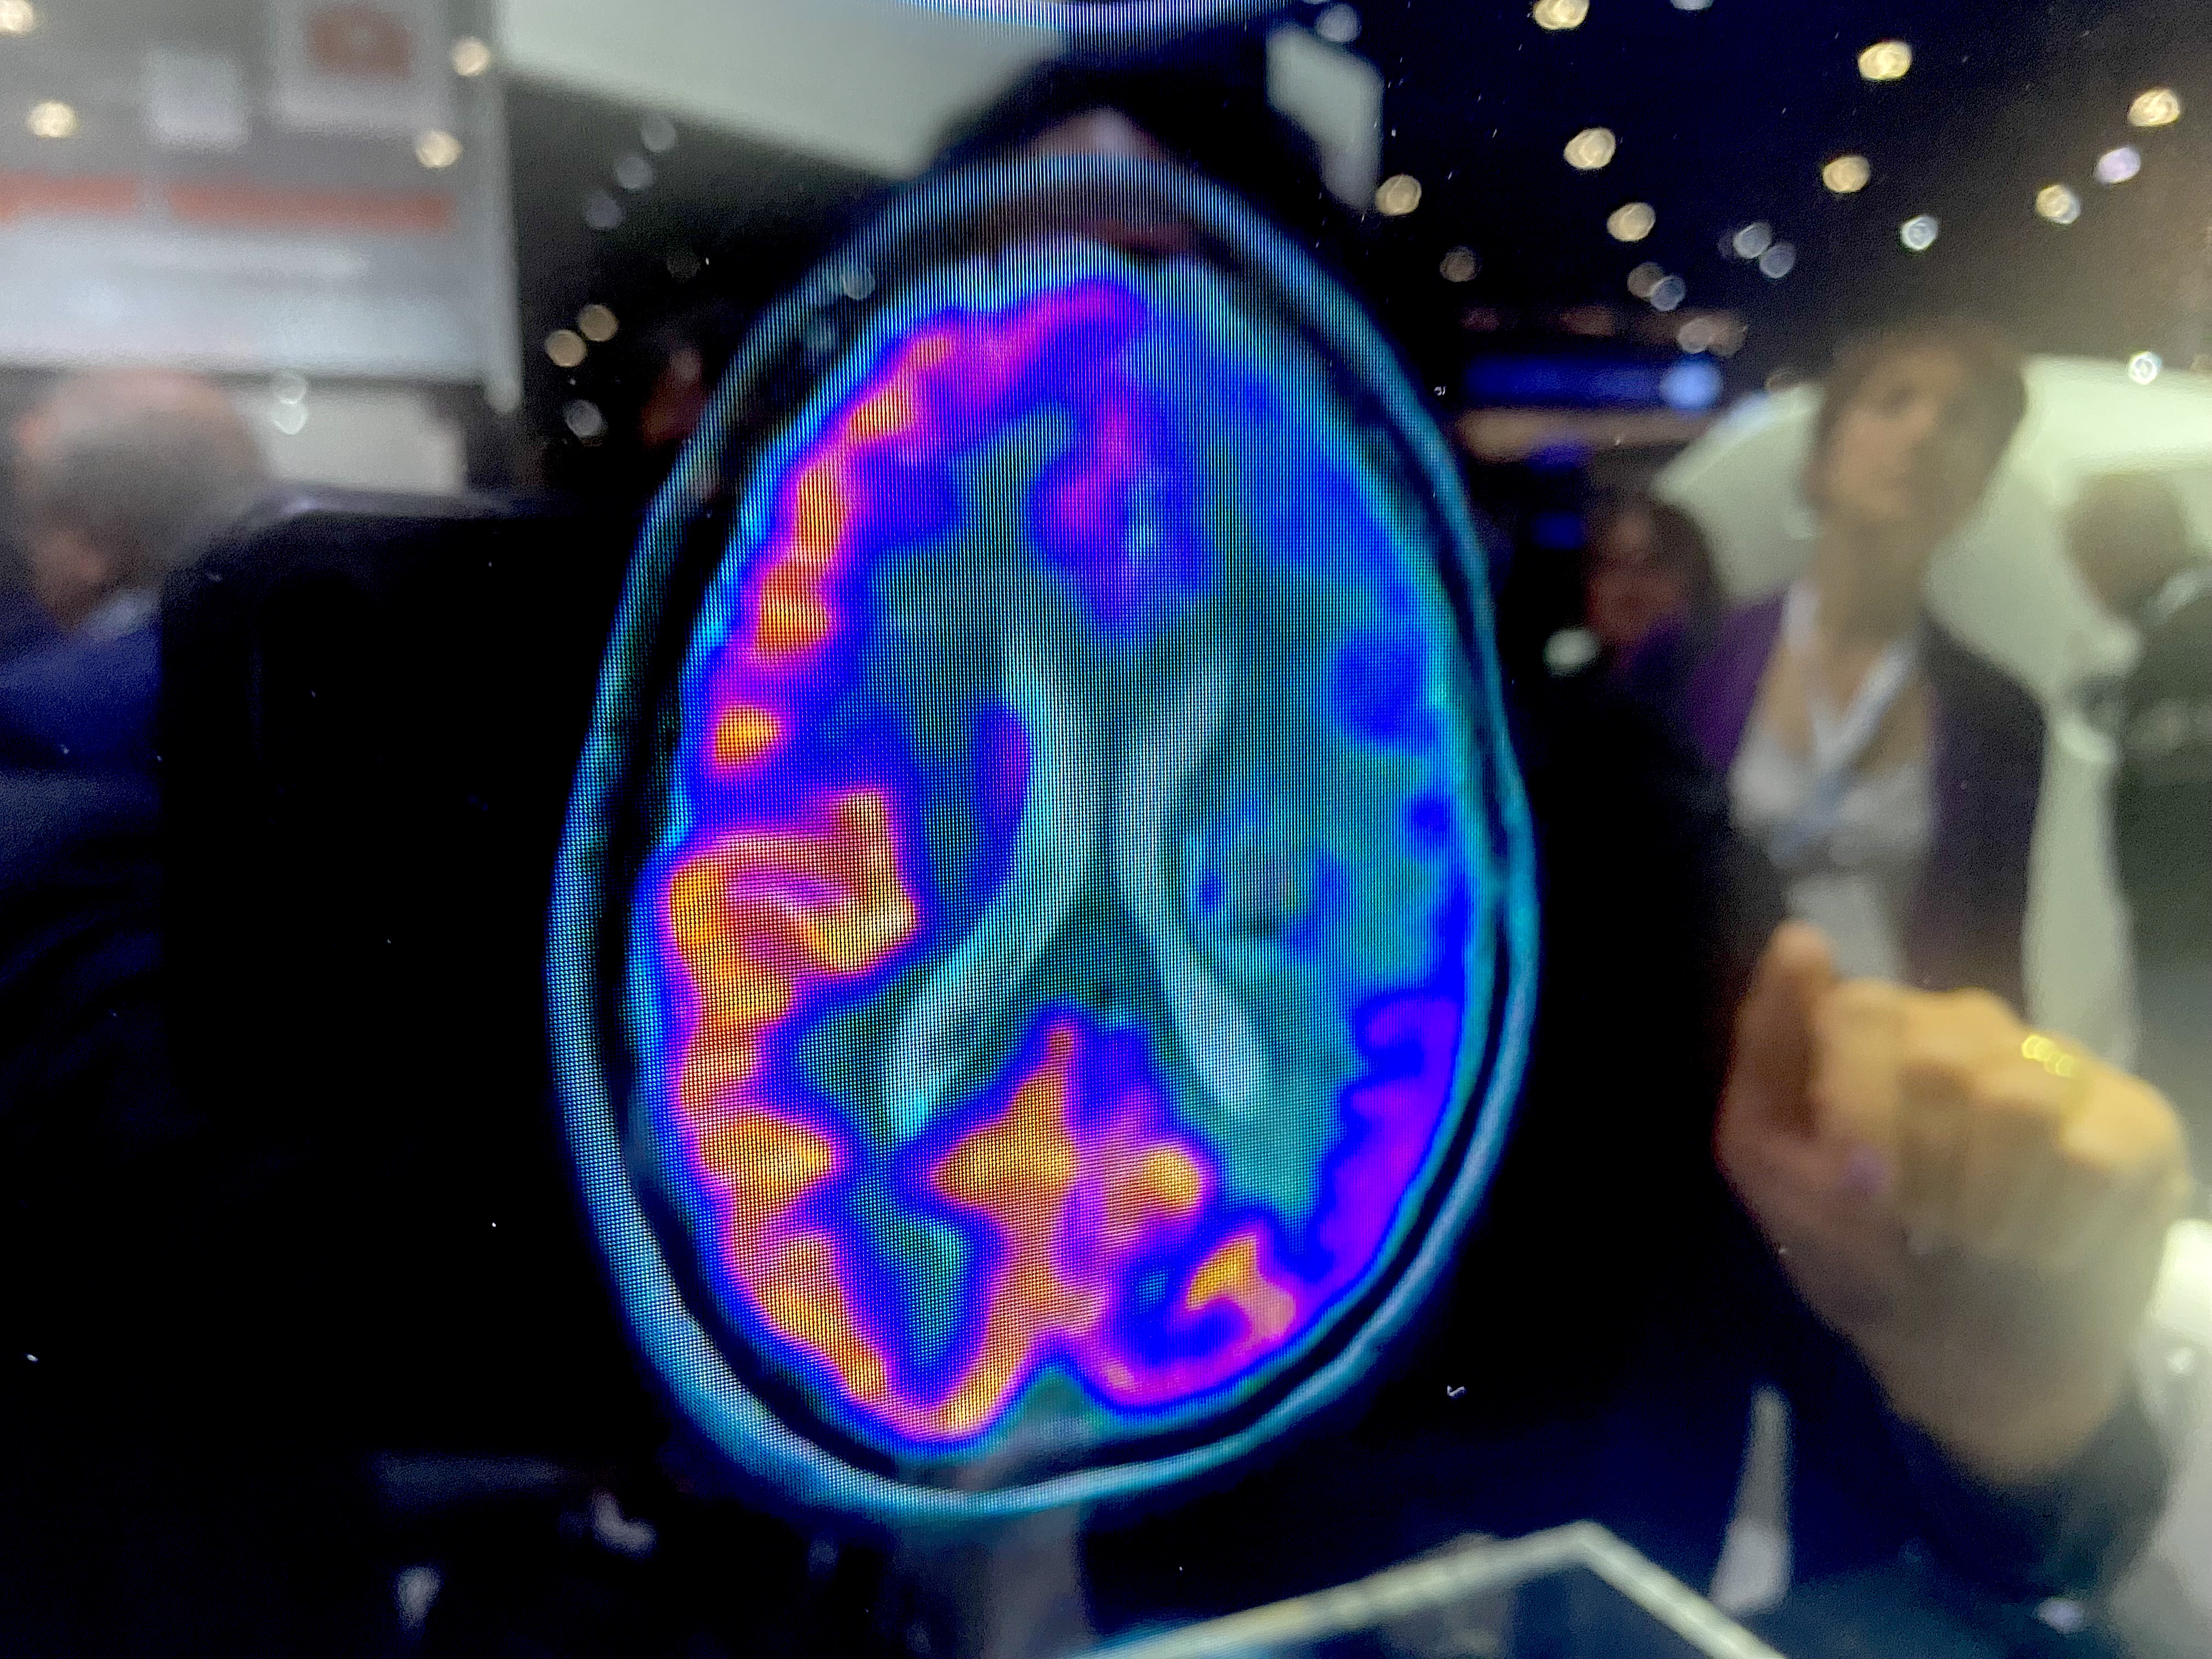
Example of positron emission tomography-computed tomography (PET-CT) imaging displaying blood perfusion in the brain. Bright orange and red areas highlight regions with healthy blood flow, while areas of low or no blood flow indicate stroke-induced ischemia. PET imaging, such as this example from a Siemens Biograph Vision X system showcased at RSNA 2023, provides insights into cellular metabolism by detecting radiotracer uptake, revealing normal brain function, ischemic regions deprived of oxygen due to reduced blood flow, and infarct areas where brain tissue has perished from lack of blood circulation.

CT scan of the brain revealing a glioblastoma tumor, a form of brain cancer. Glioblastomas typically exhibit heightened metabolic activity compared to surrounding normal tissues, resulting in increased uptake of contrast agents that accentuate the tumor. This example is sourced from the Sectra PACS displayed at RSNA 2023.

Head coils in MRI are strategically positioned around the patient's head to optimize signal reception and enhance image resolution. Some coils feature built-in mirrors, enabling patients to view videos projected on the wall opposite the MRI machine bore during the scan. This functionality was demonstrated using a Philips BlueSeal MRI system at RSNA 2023.
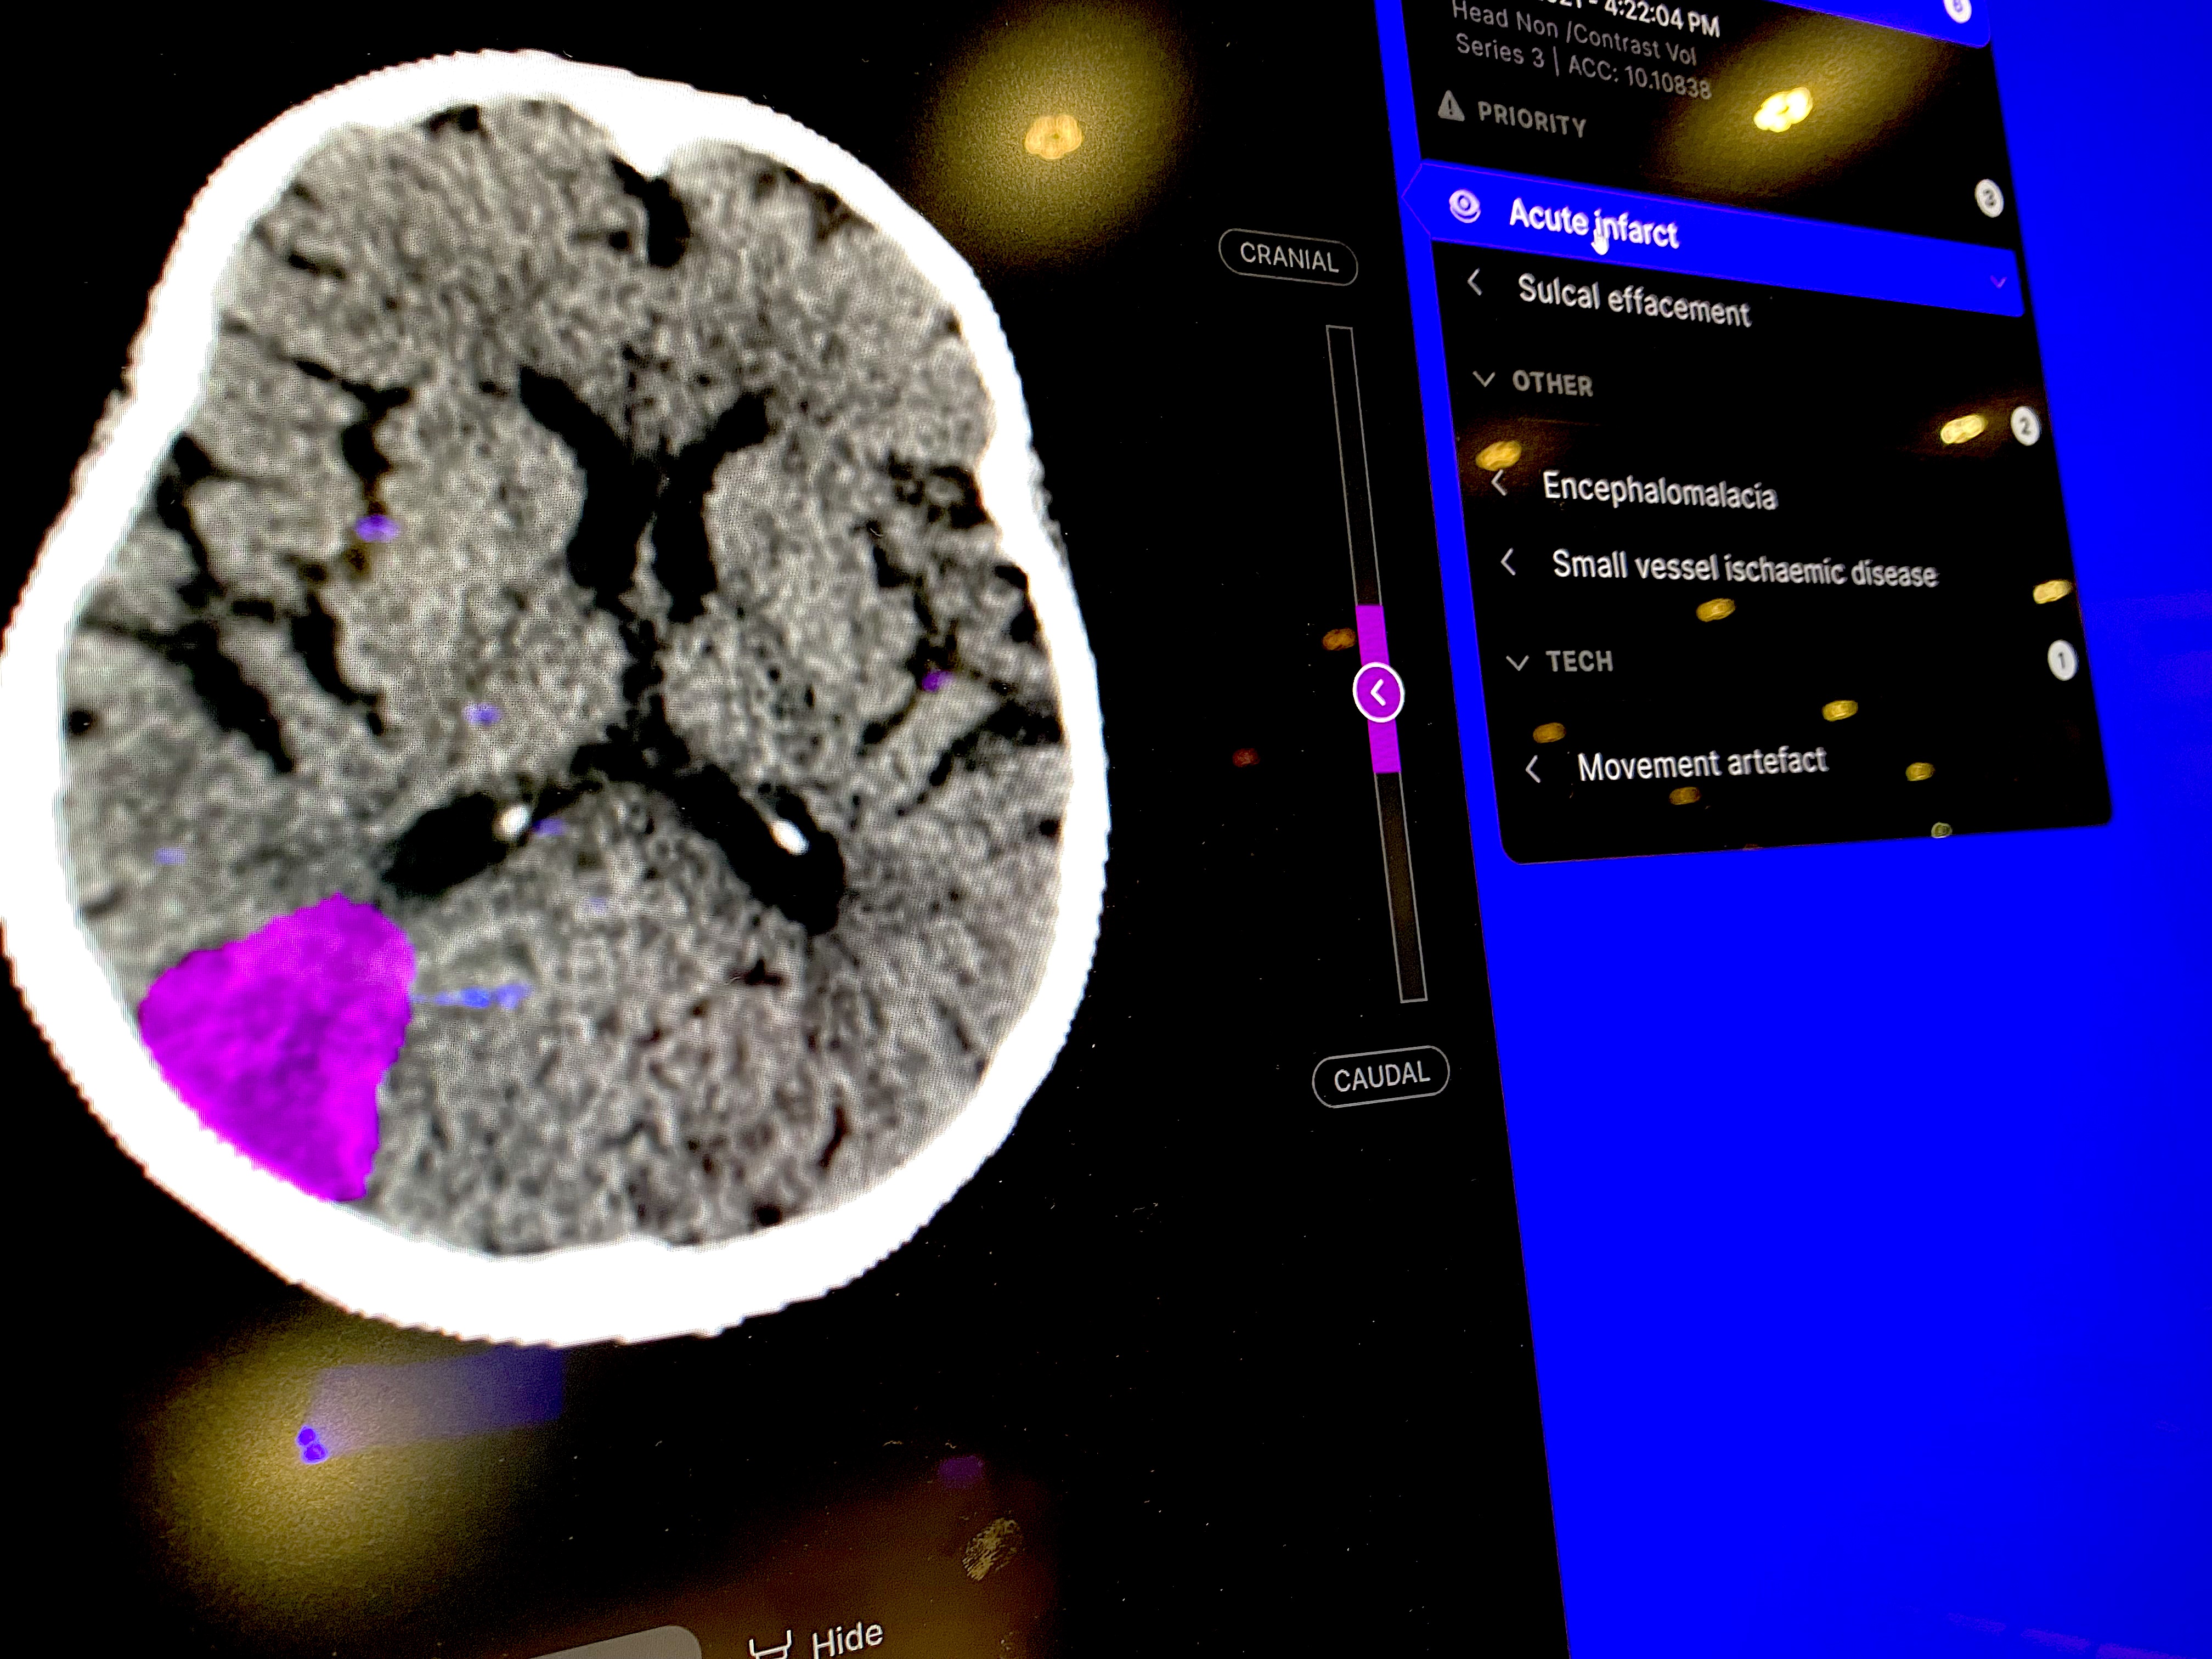
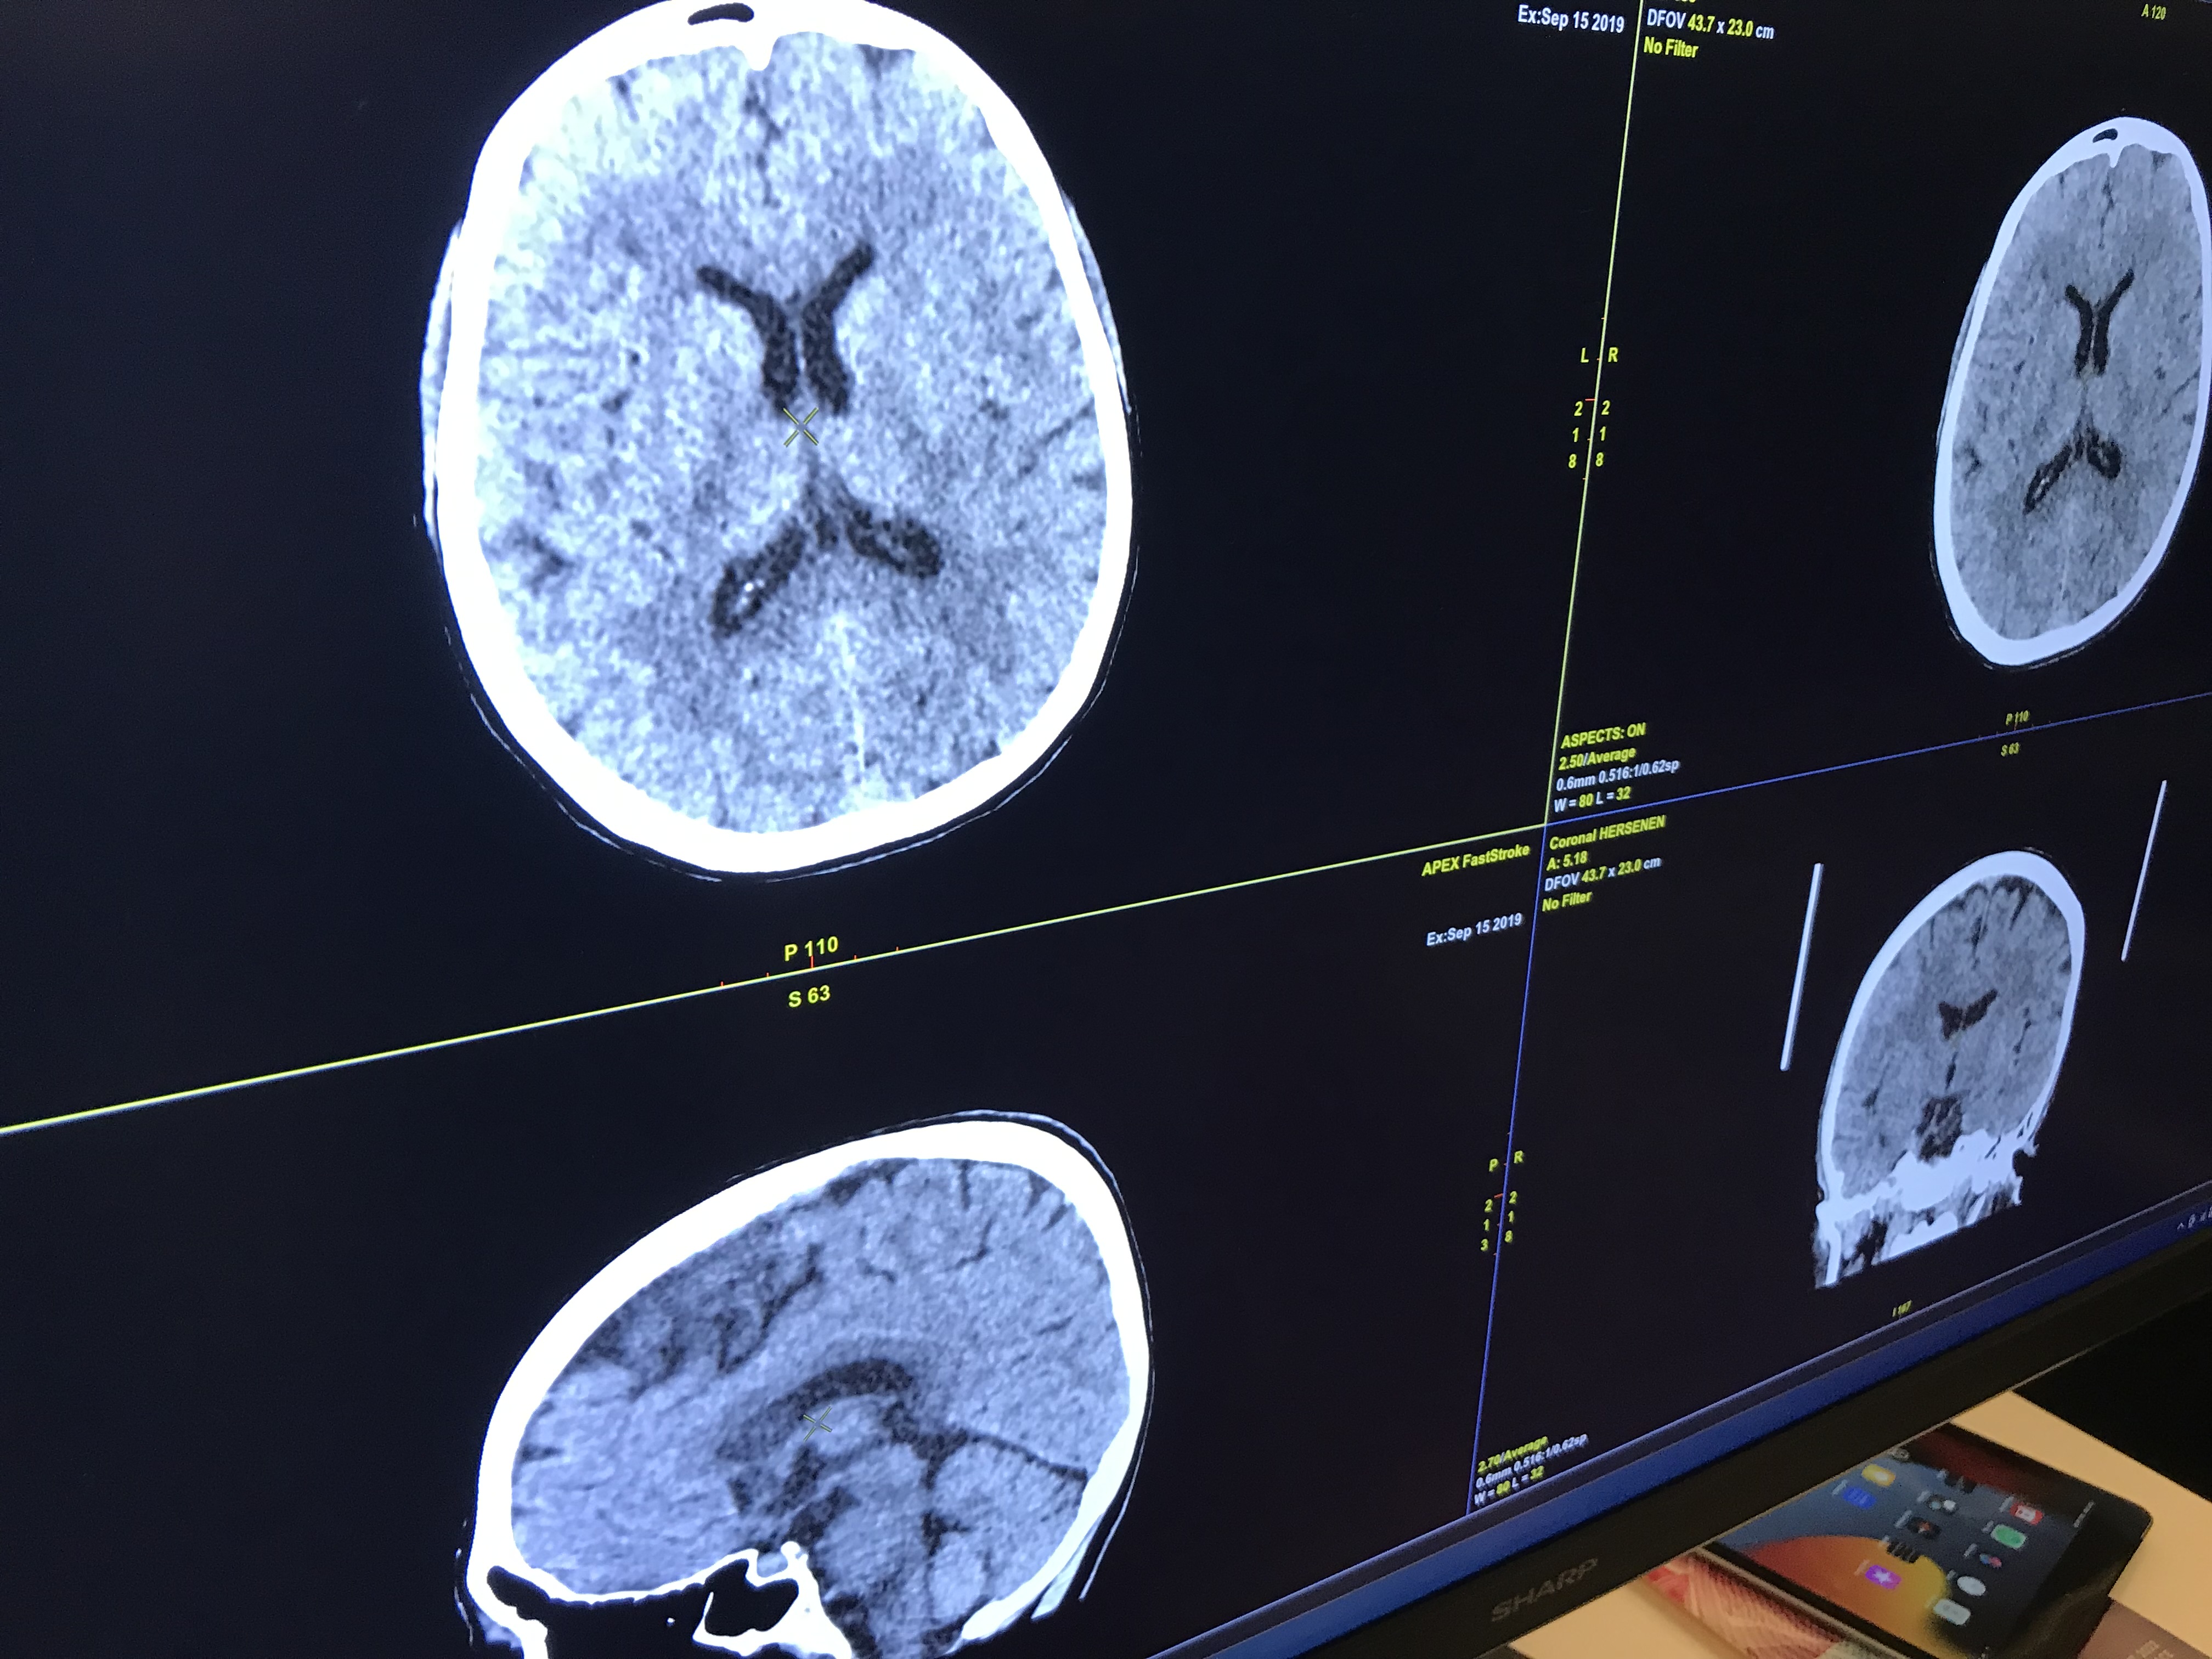
Artificial intelligenece (AI) detected acute brain infarct ischemic stroke on CT. Shown by Annalise at RSNA 2023.
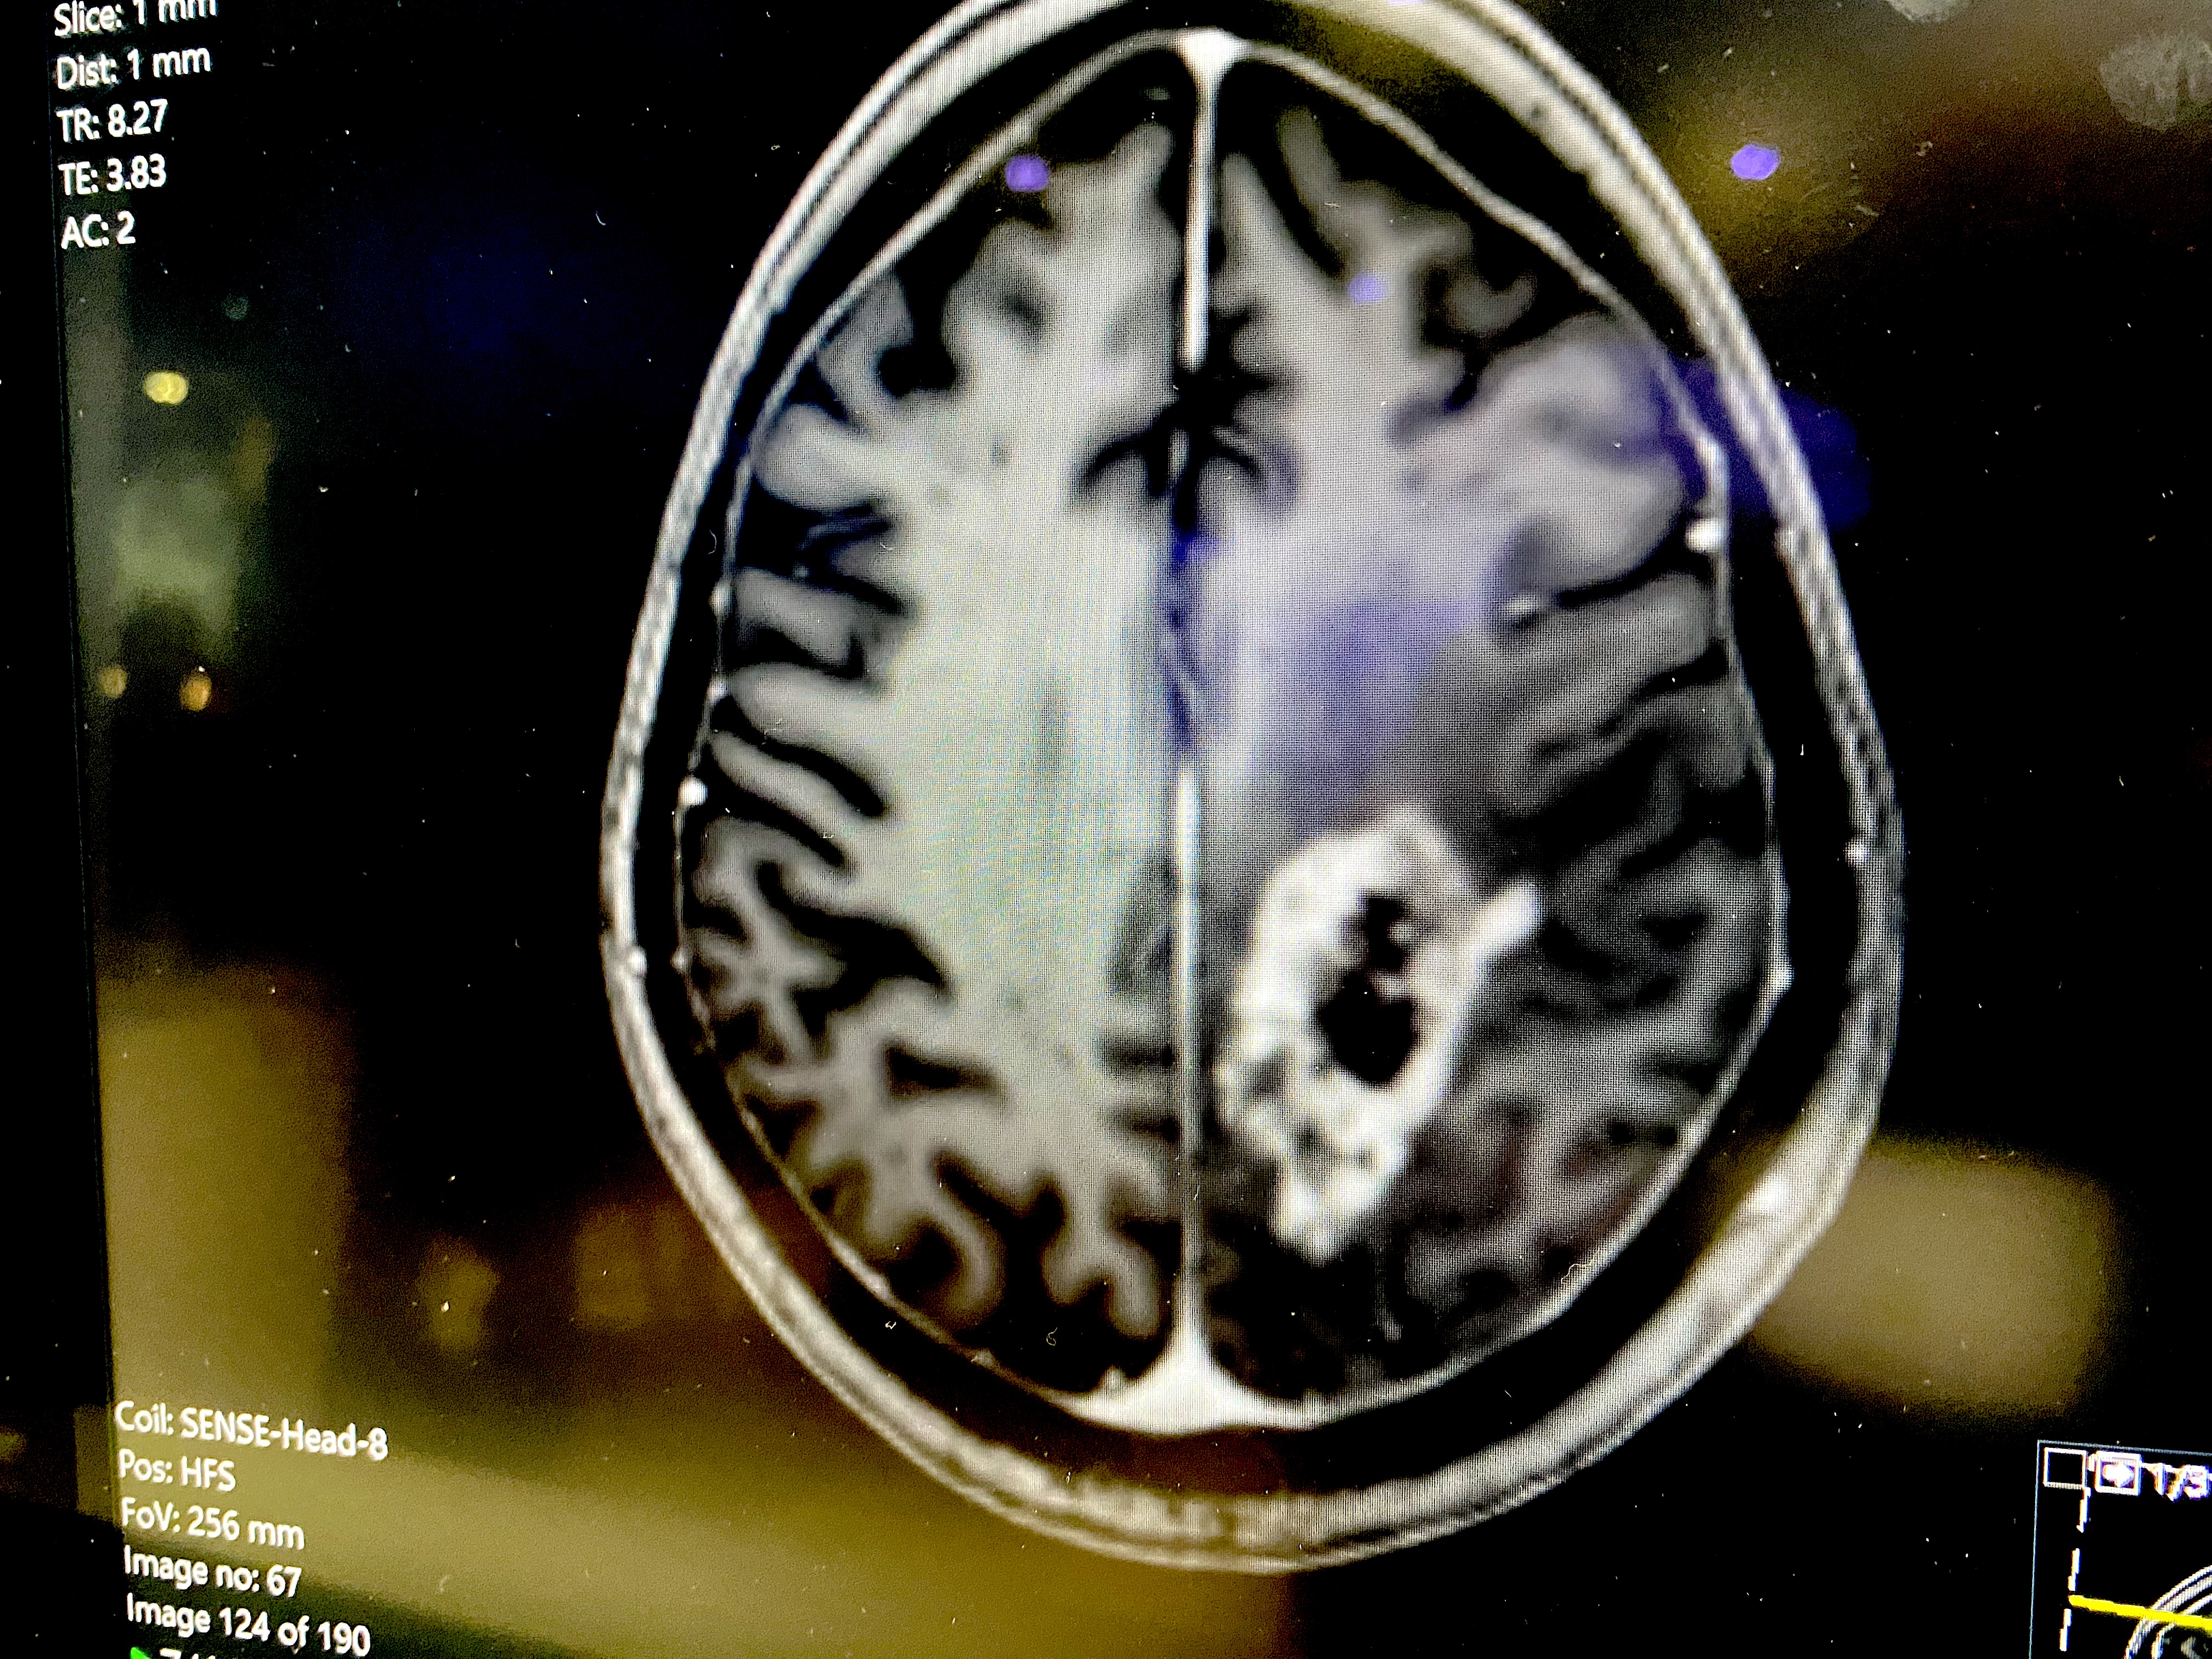
Brain MRI showing a glioblastoma multiforme (GBM) in the lower right. Image displayed on a Sectra PACS at RSNA 2023.

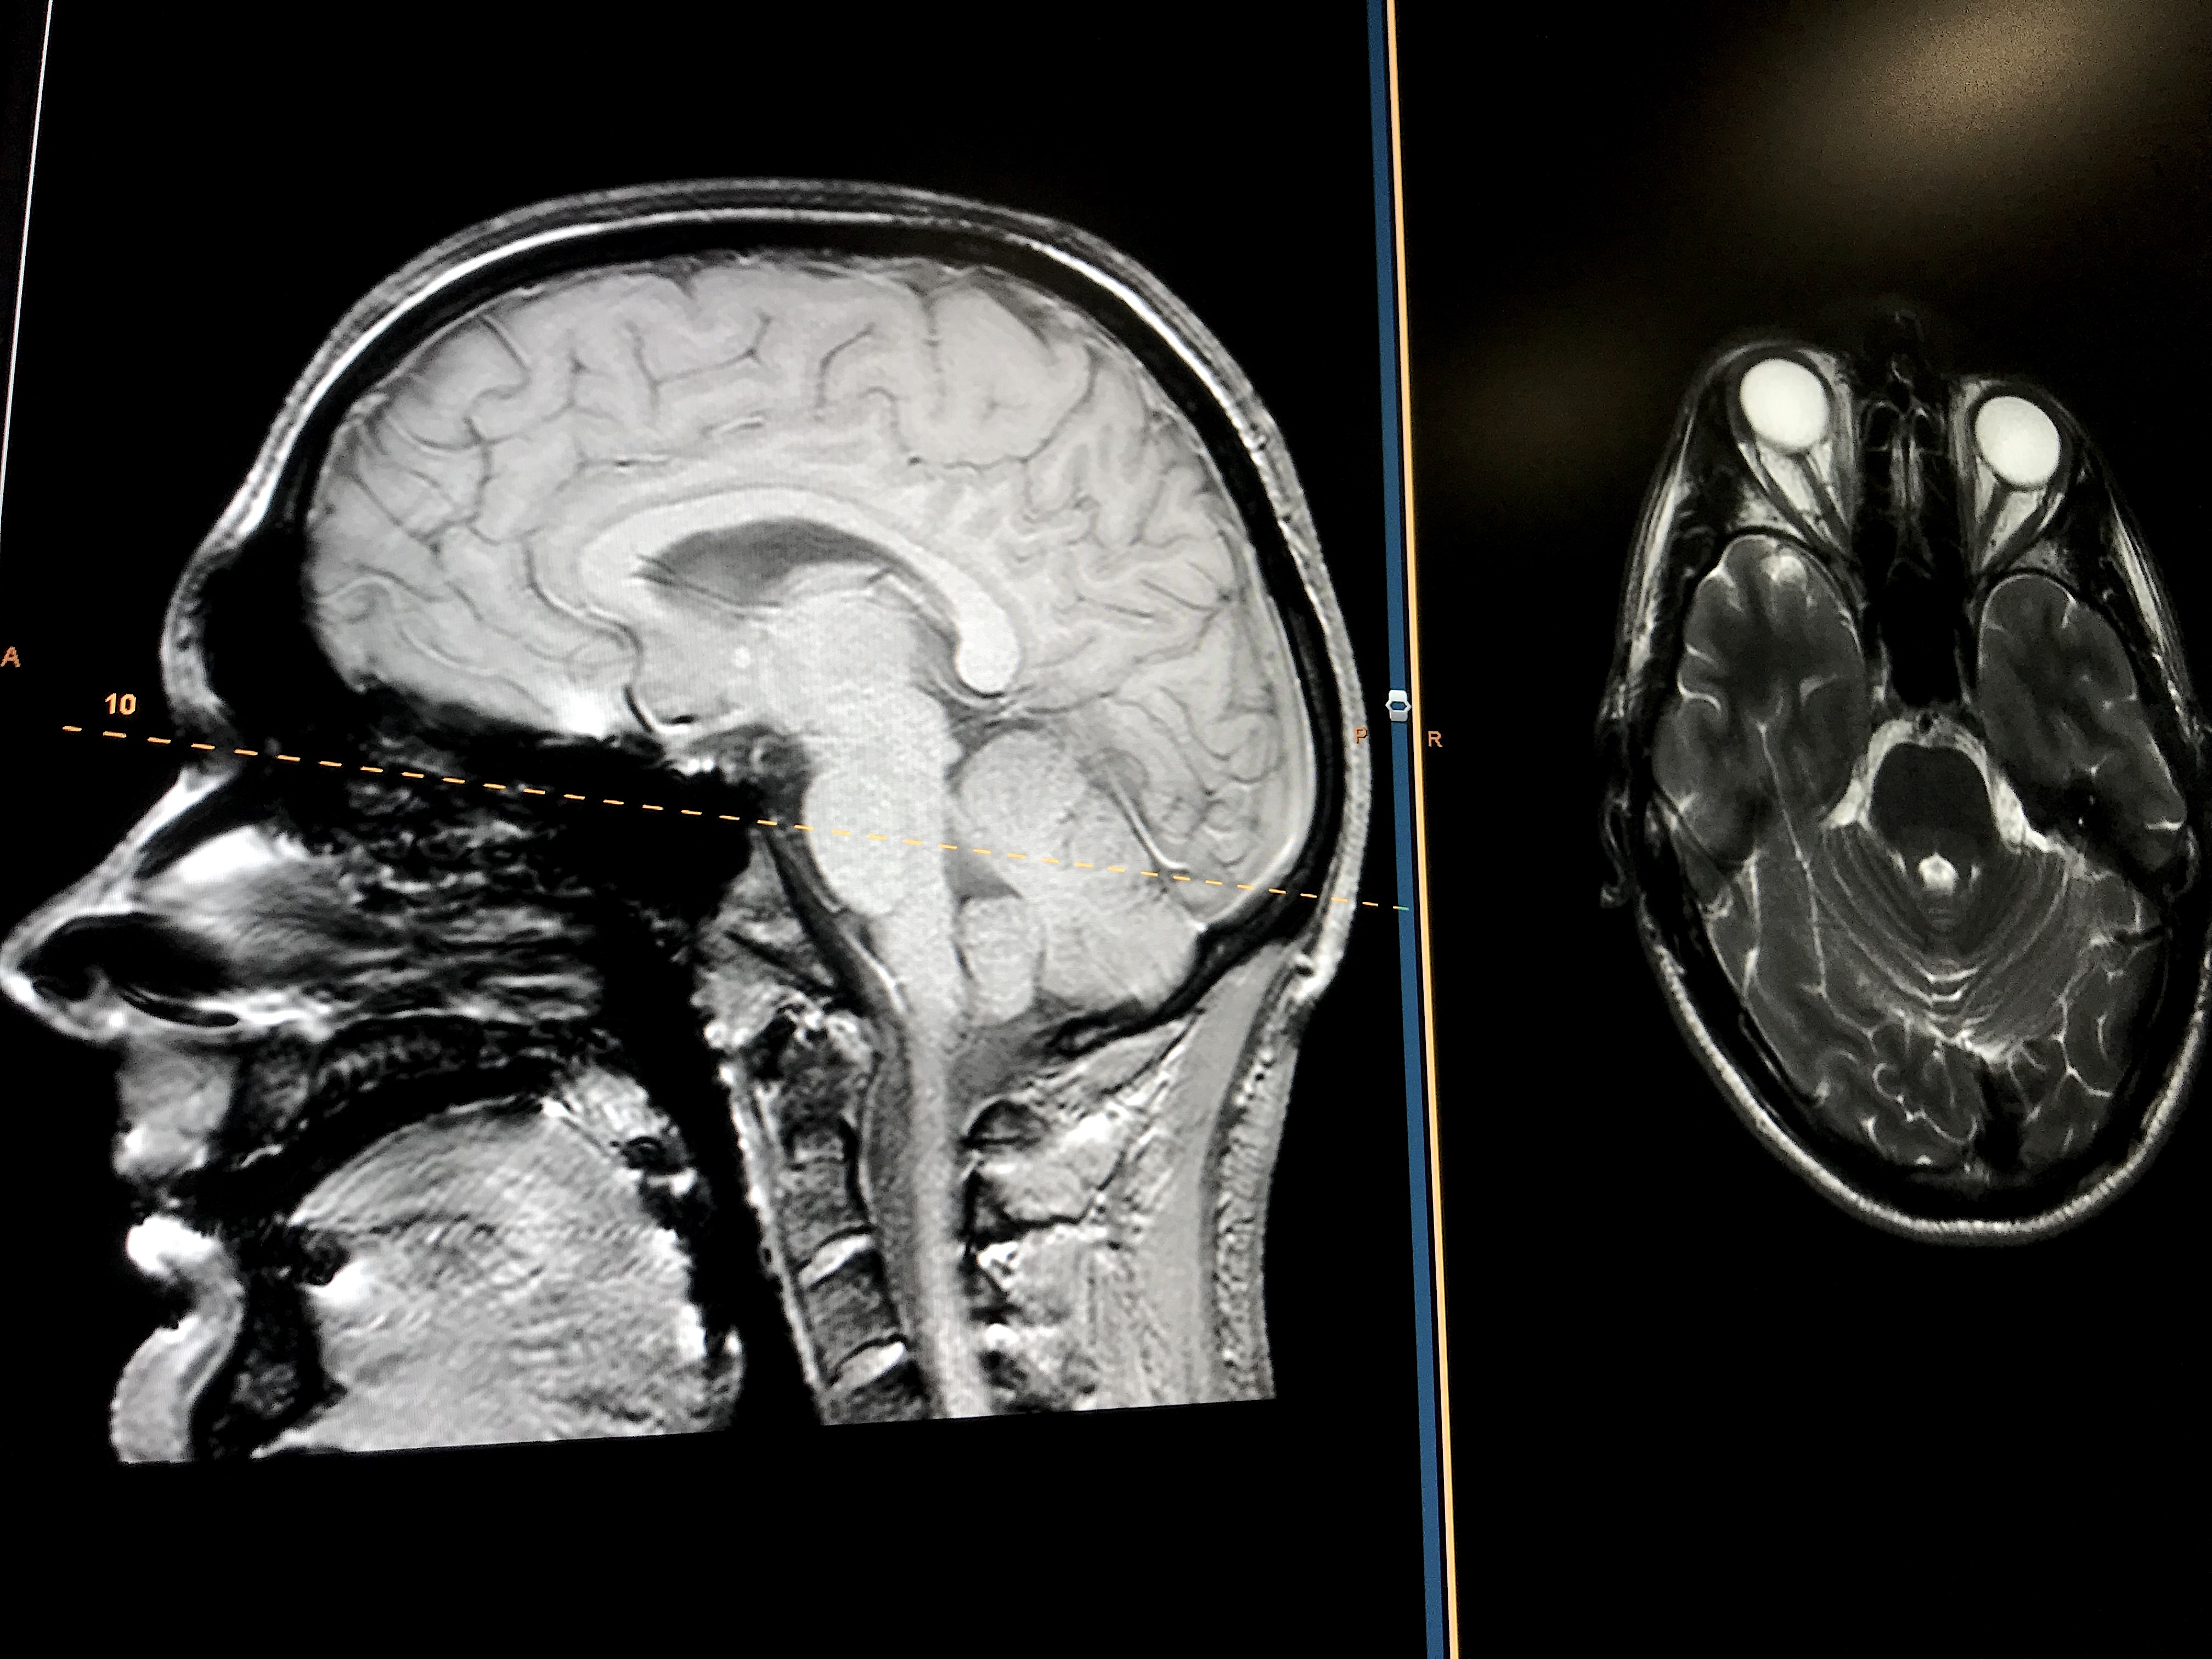
MRI surpasses CT in providing superior visualization of soft tissues. Additionally, MRI offers advantages such as the detection of flowing blood, cryptic vascular malformations, and demyelinating diseases. Unlike CT, MRI eliminates beam-hardening artifacts and does not expose patients to ionizing radiation. The brain MRI images were acquired using a Philips Blue Seal 1.5T system.
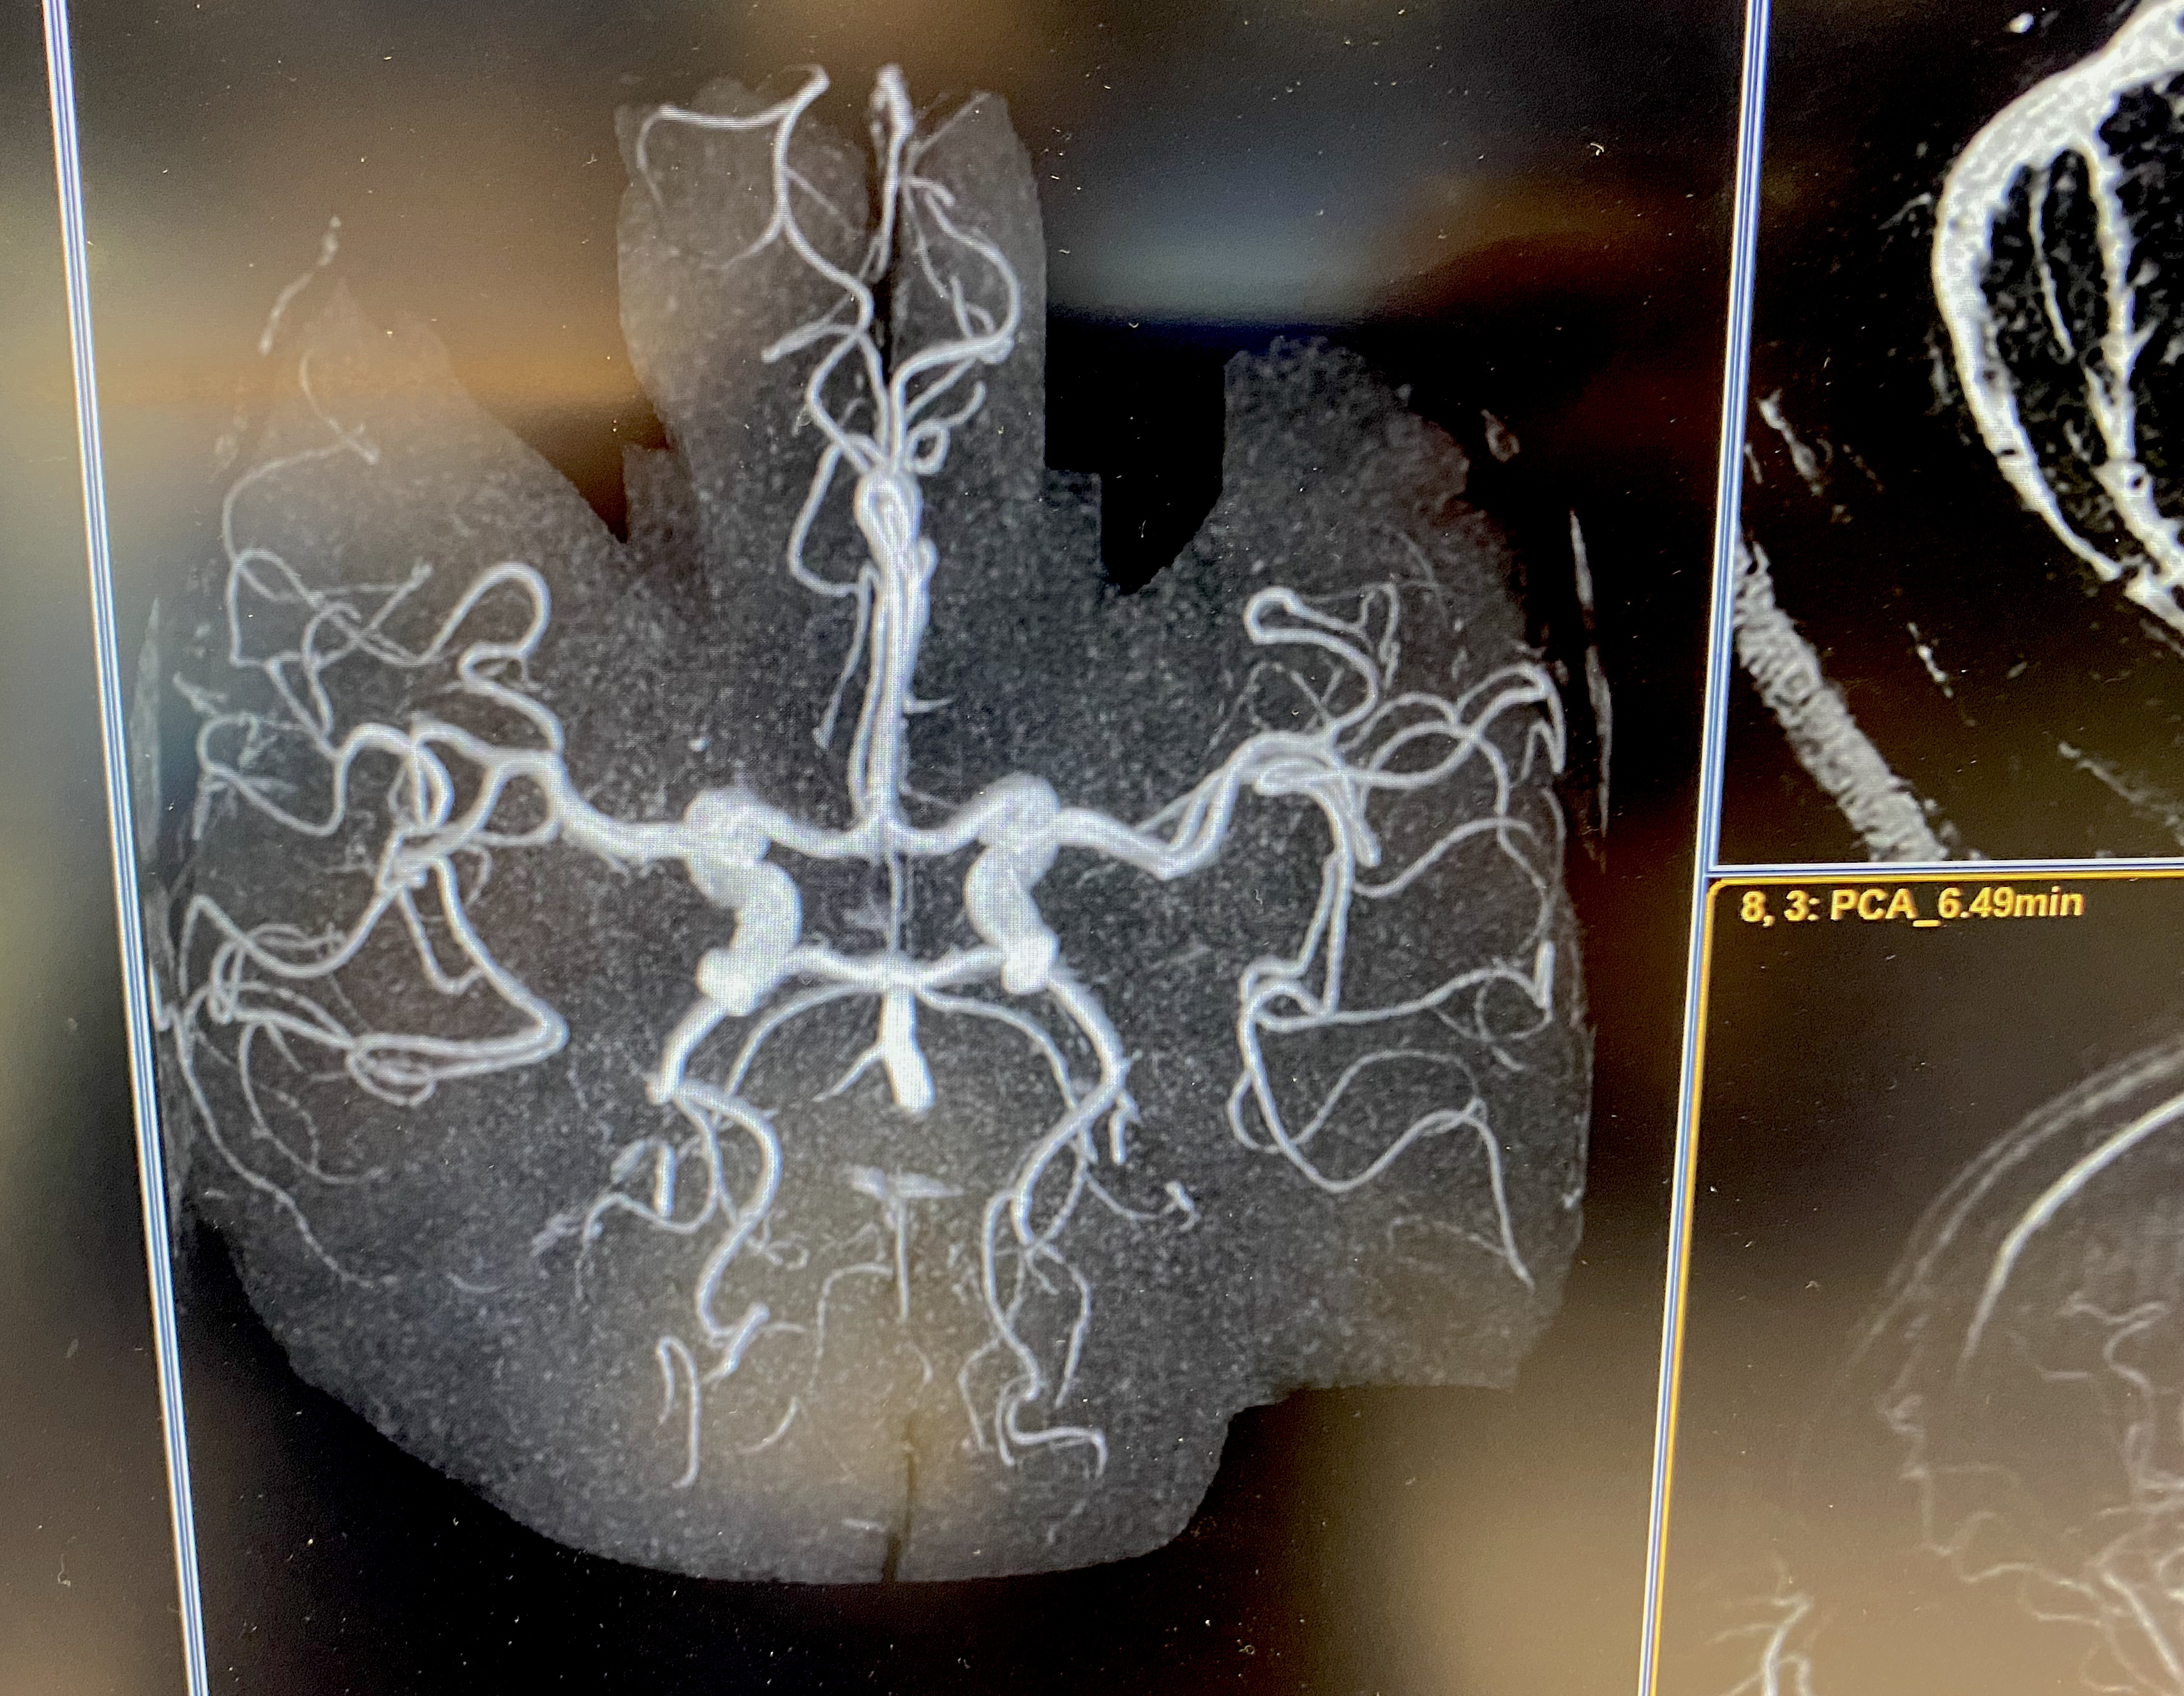
MRI showing blood vessels in the brain enhanced with gadolinium contrast. This type of imaging can show stroke, vascular malformations, aneurisms, cerebral hemorrhages and highlight tumors with vascular networks. Imaged on a Philips Blue Seal 1.5T system.
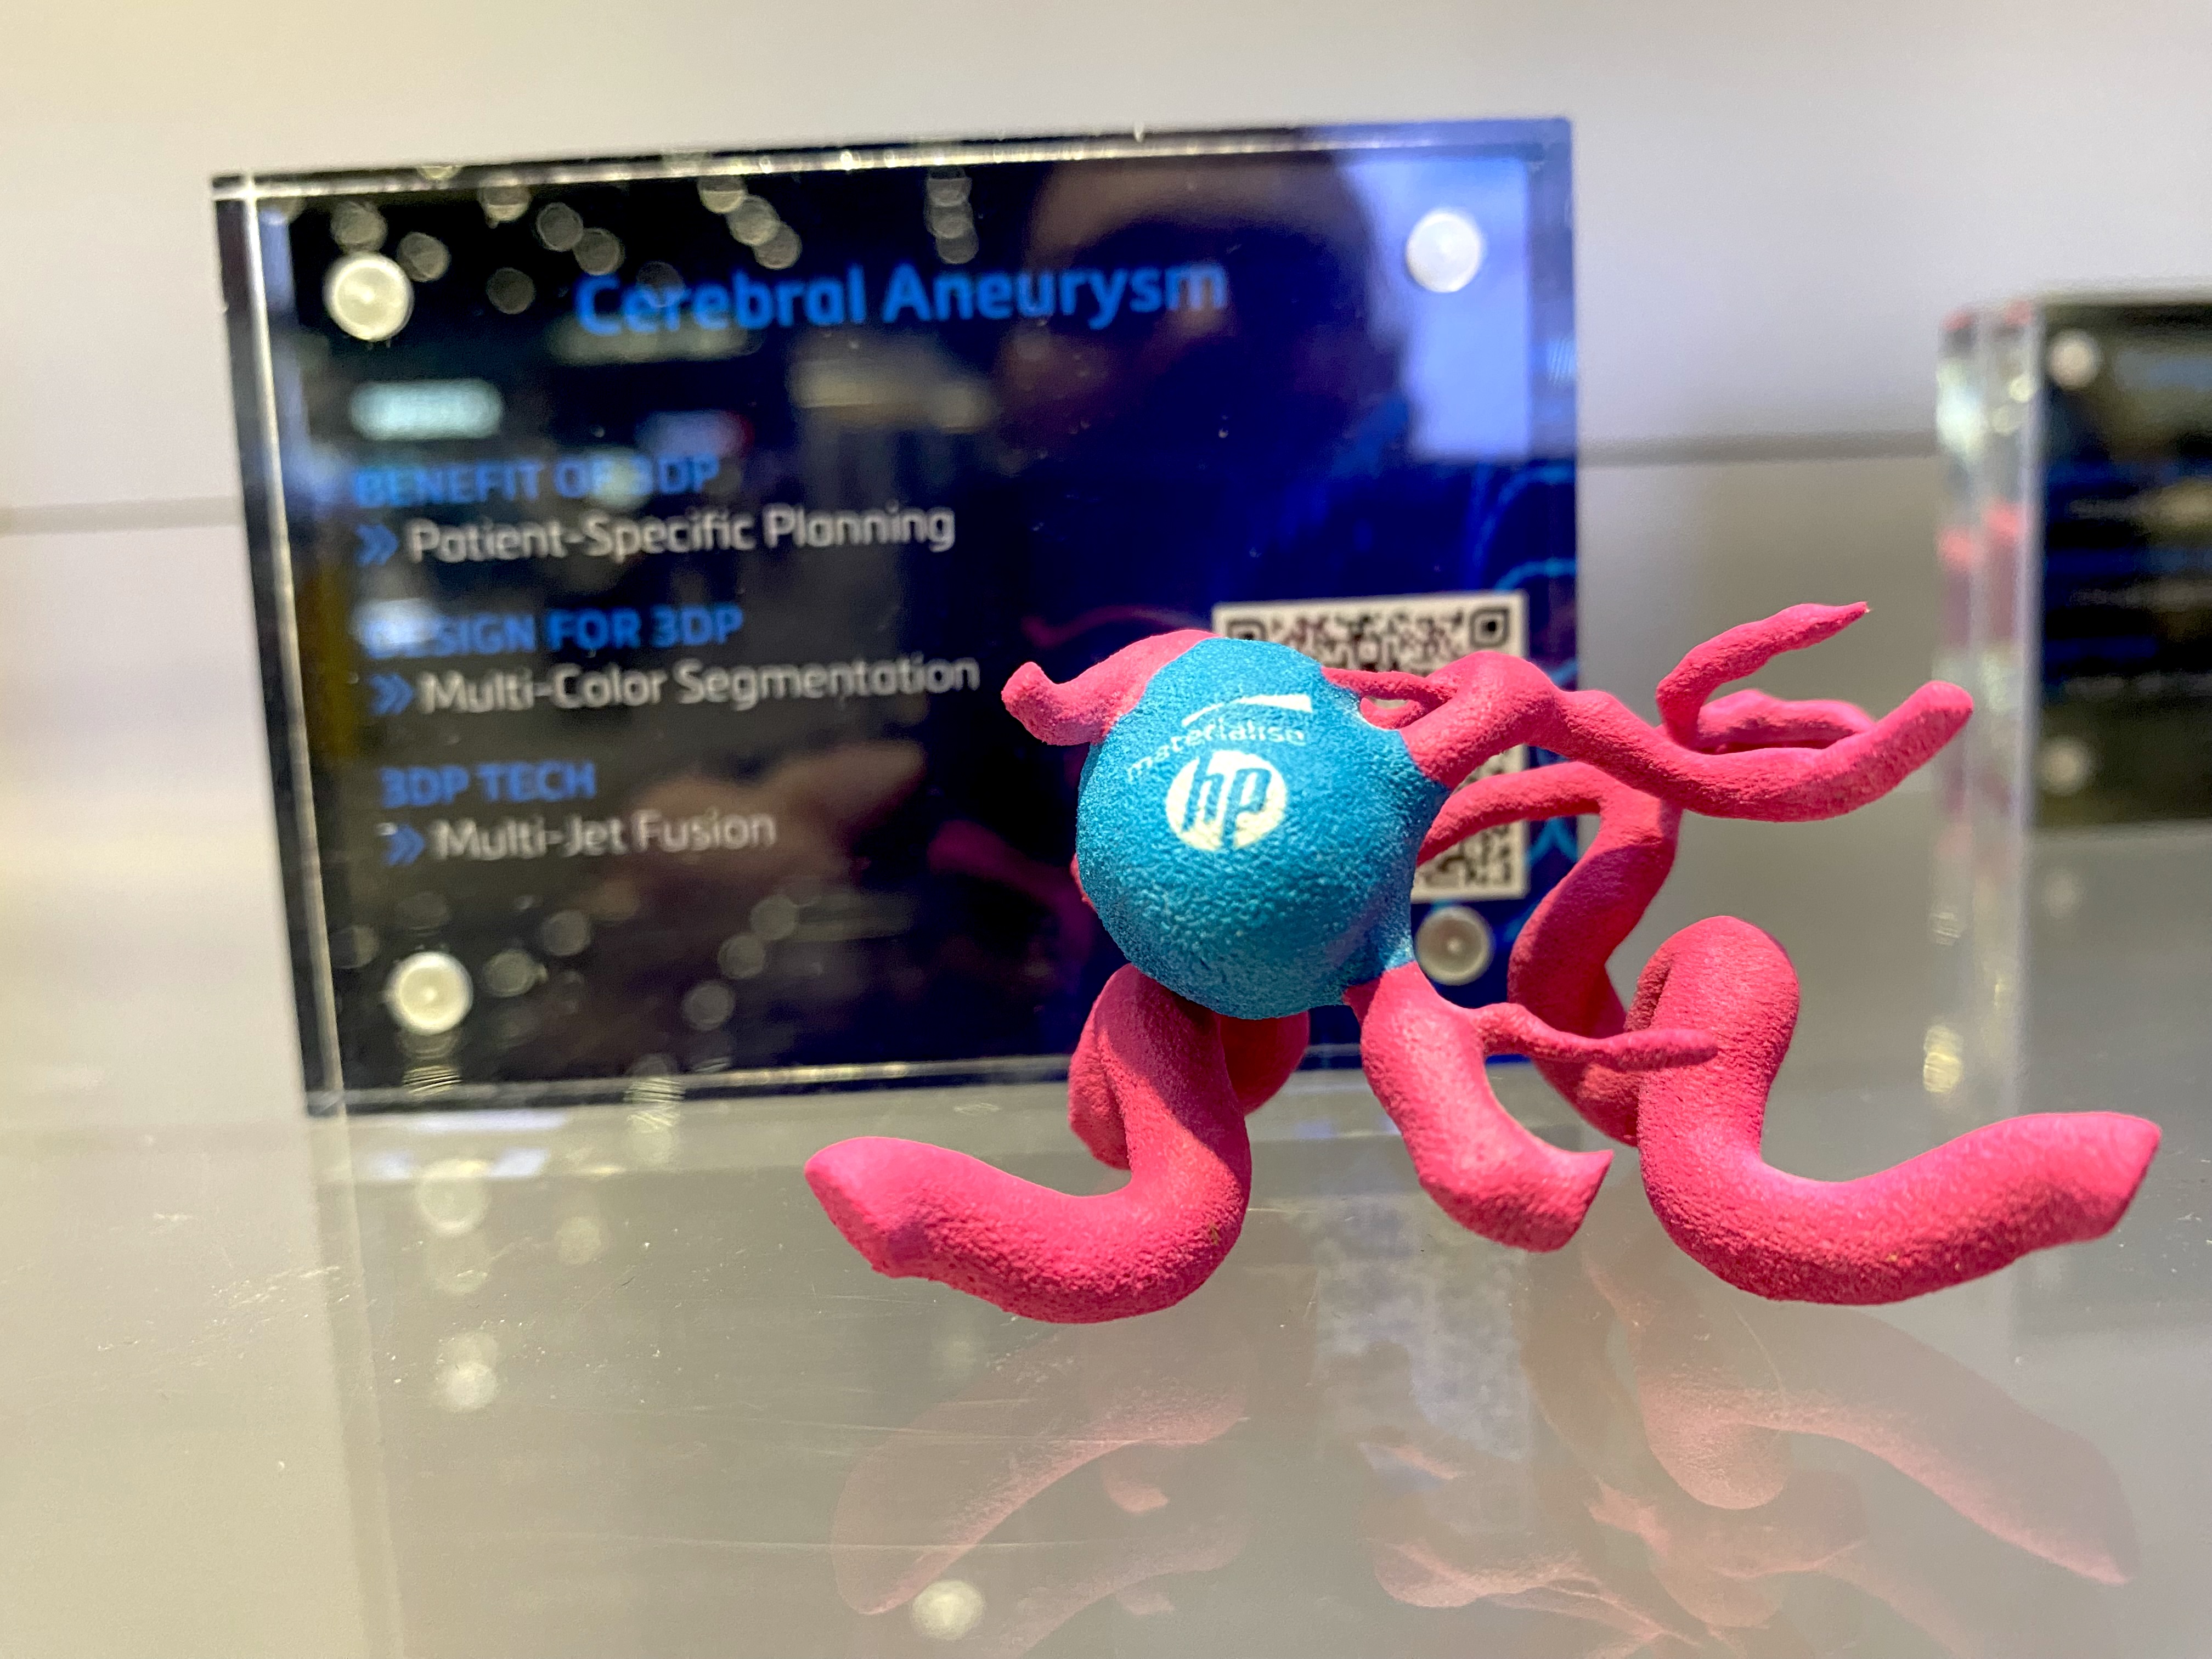
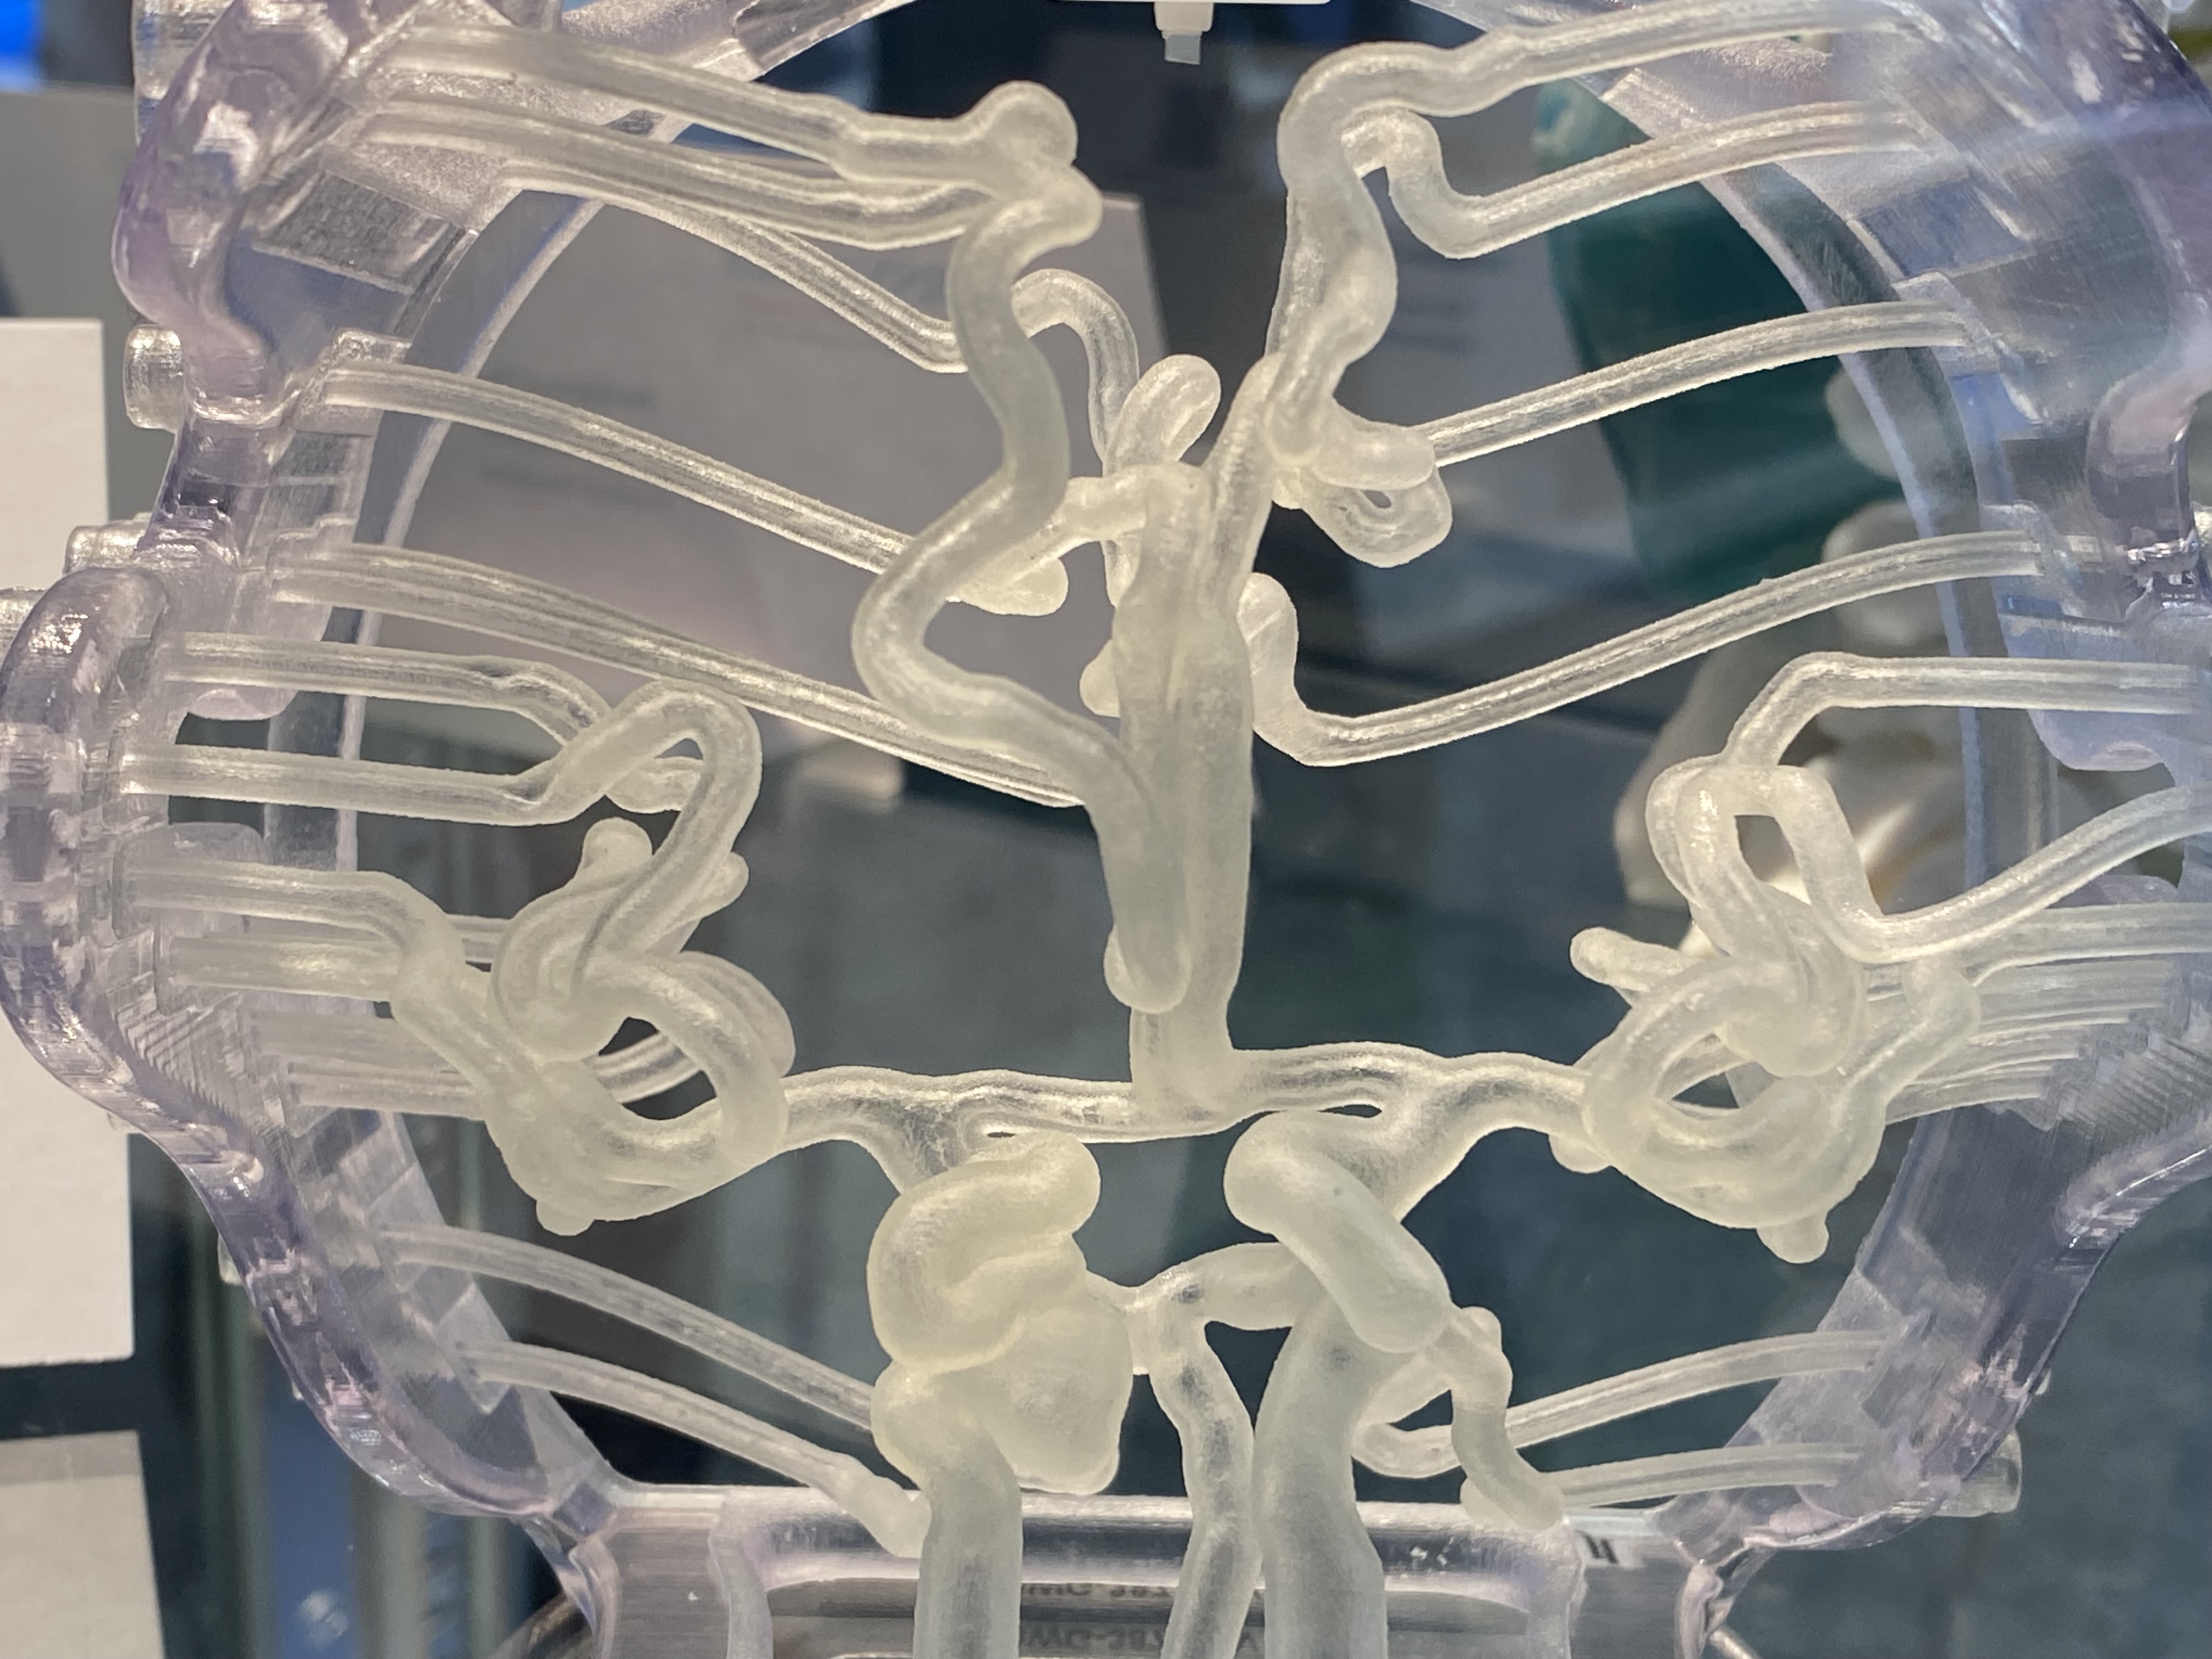
3D printed brain aneurism created from either a CT or MRI image dataset. These types of models are used to help with understanding complex anatomy to help pre-plan surgeries. Example shown by Materialise at RSNA 2023.

MRI diffusion tensor tractography (DTT) showing major nerve fiber bundles in 3D based on neuroactivity in the brain. This imaging method can trace the neuropathways of brain acuities for any action for research, or to help diagnose neural tract injury and some types of diseases. This image was created using a Canon Atlas SPEEDER HeadNeck coil on the Vantage Titan 1.5T.

MRI image quality and soft tissue resolution increases the more powerful a magnet is. Standard MRI systems are 1.5 Tesla (T), but 3T systems are becoming more common and a 7T system is also available. This image is from a Canon Vantage Titan 3T system with MP-RAGE (magnetization prepared - RApid gradient echo) enhanced T1 gray-white matter contrast for surgical planning.

Example of MRI diffusion tensor tractography (DTT) showing major nerve fiber bundles in 3D based on neuroactivity in the brain. This imaging method can trace the neuropathways of brain acuities for any action for research, or to help diagnose neural tract injury and some types of diseases. Image from a GE 48-channel head coil Signa FLAIR Cube Fusion.

Series of CT iodine contrast enhanced images showing an ischemic stroke. The vessels on both halves of the brain should be symmetrical, but the top vascular images show filling defects on the right side, indicating an obstruction. The bottom images show CT brain perfusion, showing a a lack of blood flow, best seen in red in the center image. Imaged on a Canon Aquilion One.

MRI brain perfusion image showing blood flow in the brain and an anomaly in flow in the lower right. Image shown on a Sectra PACS at HIMSS 2023.

A pediatric brain MRI T1 MP-RAGE image on a Merative enterprise imaging system at HIMSS 2023.
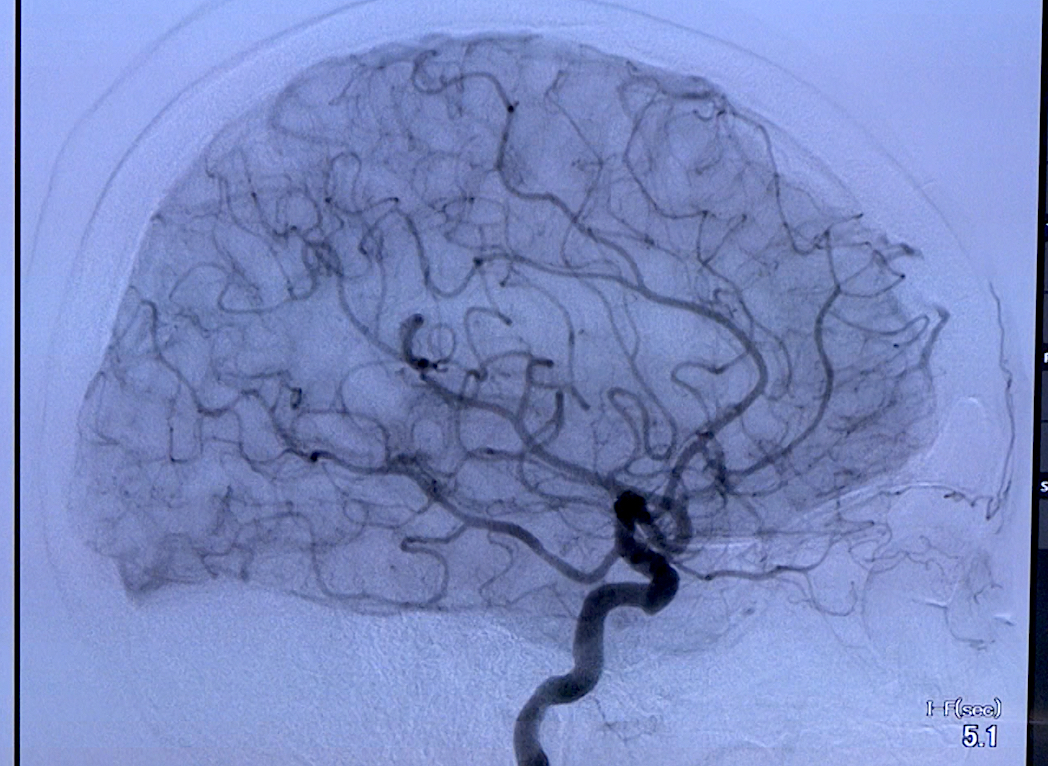
A brain angiogram image capturing a catheter iodine contrast injection into a carotid artery to enhance blood flow throughout the brain for perfusion assessment. This crucial procedure, performed in neuro interventional cath labs, aids in pinpointing arterial blockages for thrombectomy procedures. These interventions aim to eliminate clots, restoring blood flow in ischemic strokes. Image courtesy of Shimadzu.
Assessment of brain atrophy on MRI using the automated Quantib artificial intelligence algorithm, where AI automates quantification faster and more accurately than a human can. Cerebral atrophy is from the loss of neurons and the connections between them. Many diseases can cause atrophy, including Alzheimer's disease, cerebral palsy, Pick's disease, Huntington's disease, multiple sclerosis, epilepsy and several other disorders.
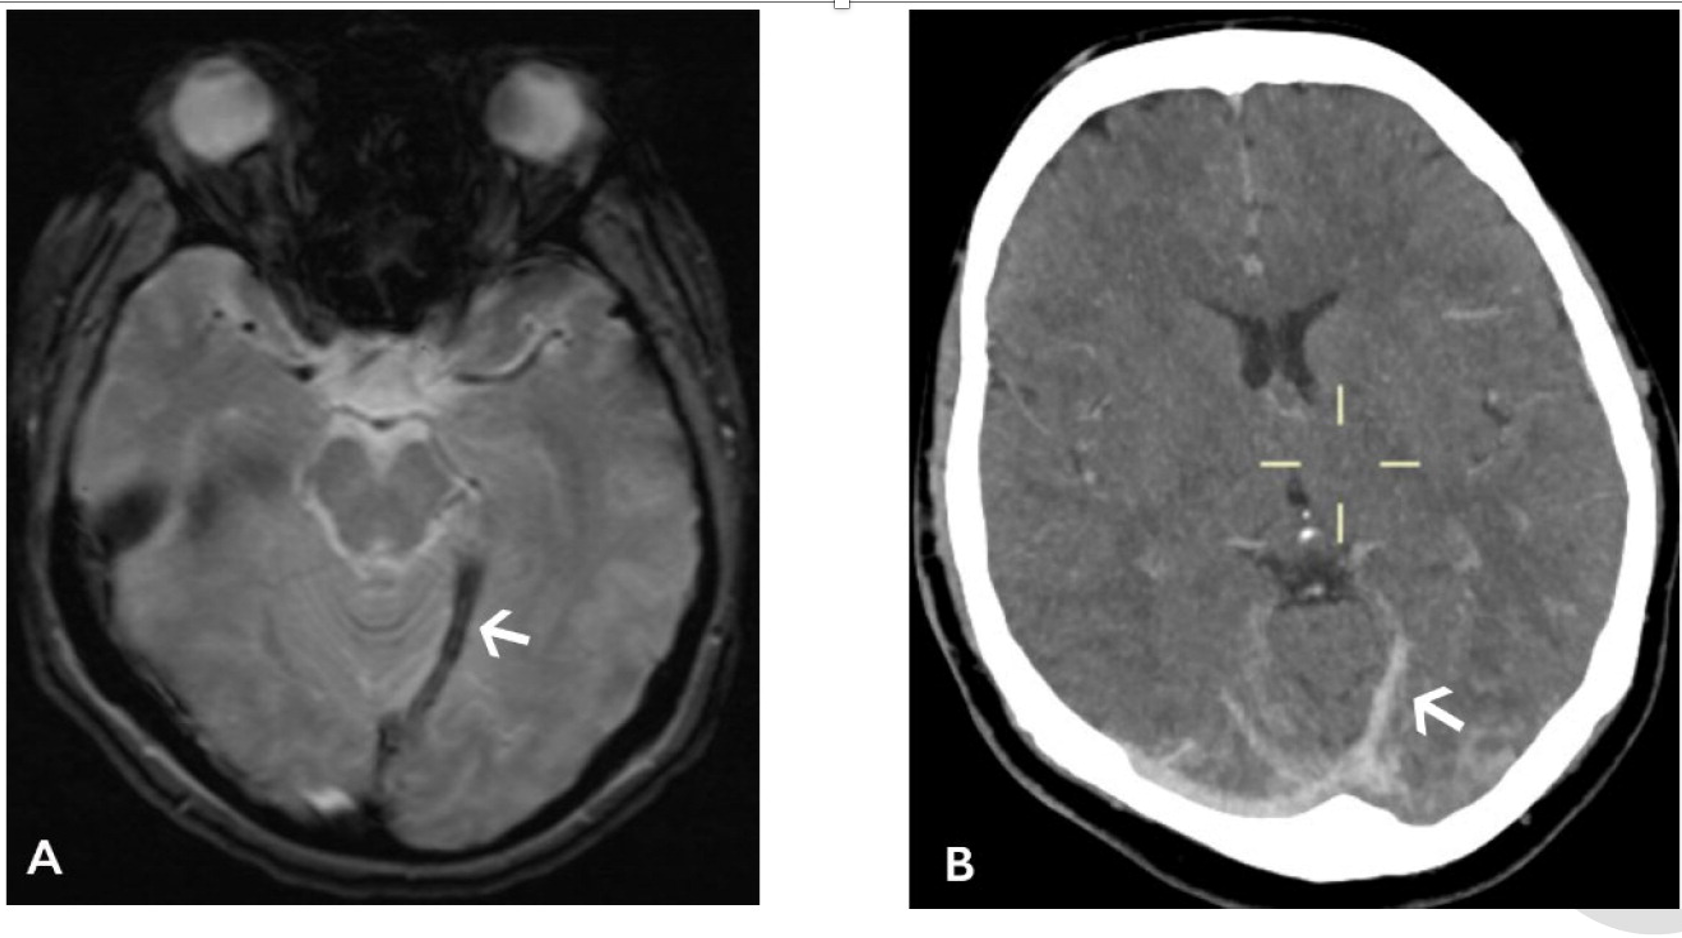
COVID-19 caused brain hemorrhages on MRI. The SARS-CoV-2 virus commonly causes clotting in patients that can result in strokes, but it also can cause brain hemorrhages in less common cases. Images courtesy of RSNA.
Example of an ischemic stroke on a head CT scan. Iodine contrast is injected into the patient to show areas of low perfusion, which can be seen in the less bright area of the brain at the top of the skull in the bottom left image. Image from a GE Healthcare Revolution CT scanner.
Example of a rare blood clot in the brain caused by the COVID-19 vaccine, which has caused a stroke. Images courtesy of RSNA.
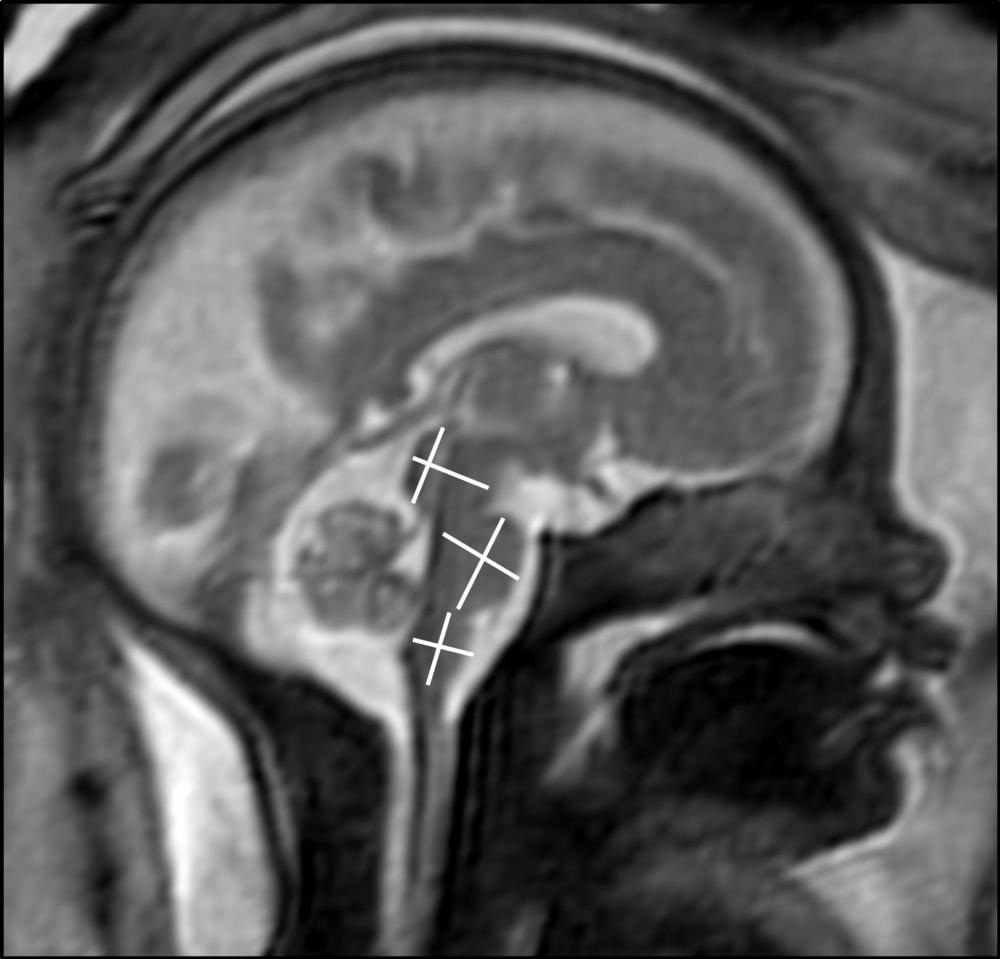
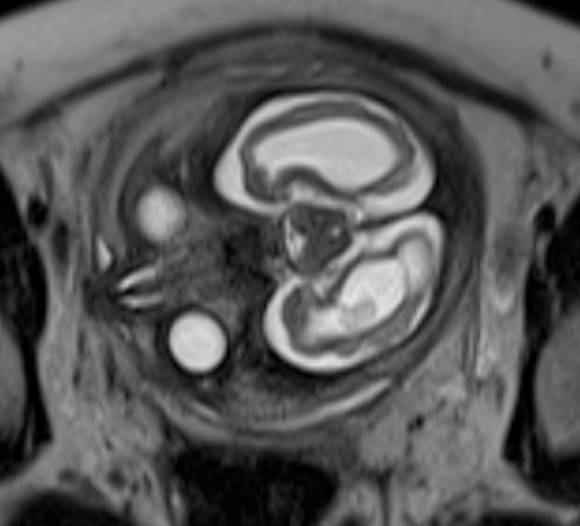
MRI image to assess fetal brain development. MRI does not use ionizing radiation from X-rays, so is safe for fetal imaging. Image courtesy of RSNA
Example of the number of AI algorithms available outside the U.S. for brain conditions by the vendor Annalise.AI. The U.S. FDA requires a higher bar for AI clearance, so the vendor is submitting only a fraction of these for review due to the time and costs it would take to clear them all one-by-one. Several vendors said this has been an obstacle to faster and wider AI approvals in the U.S.
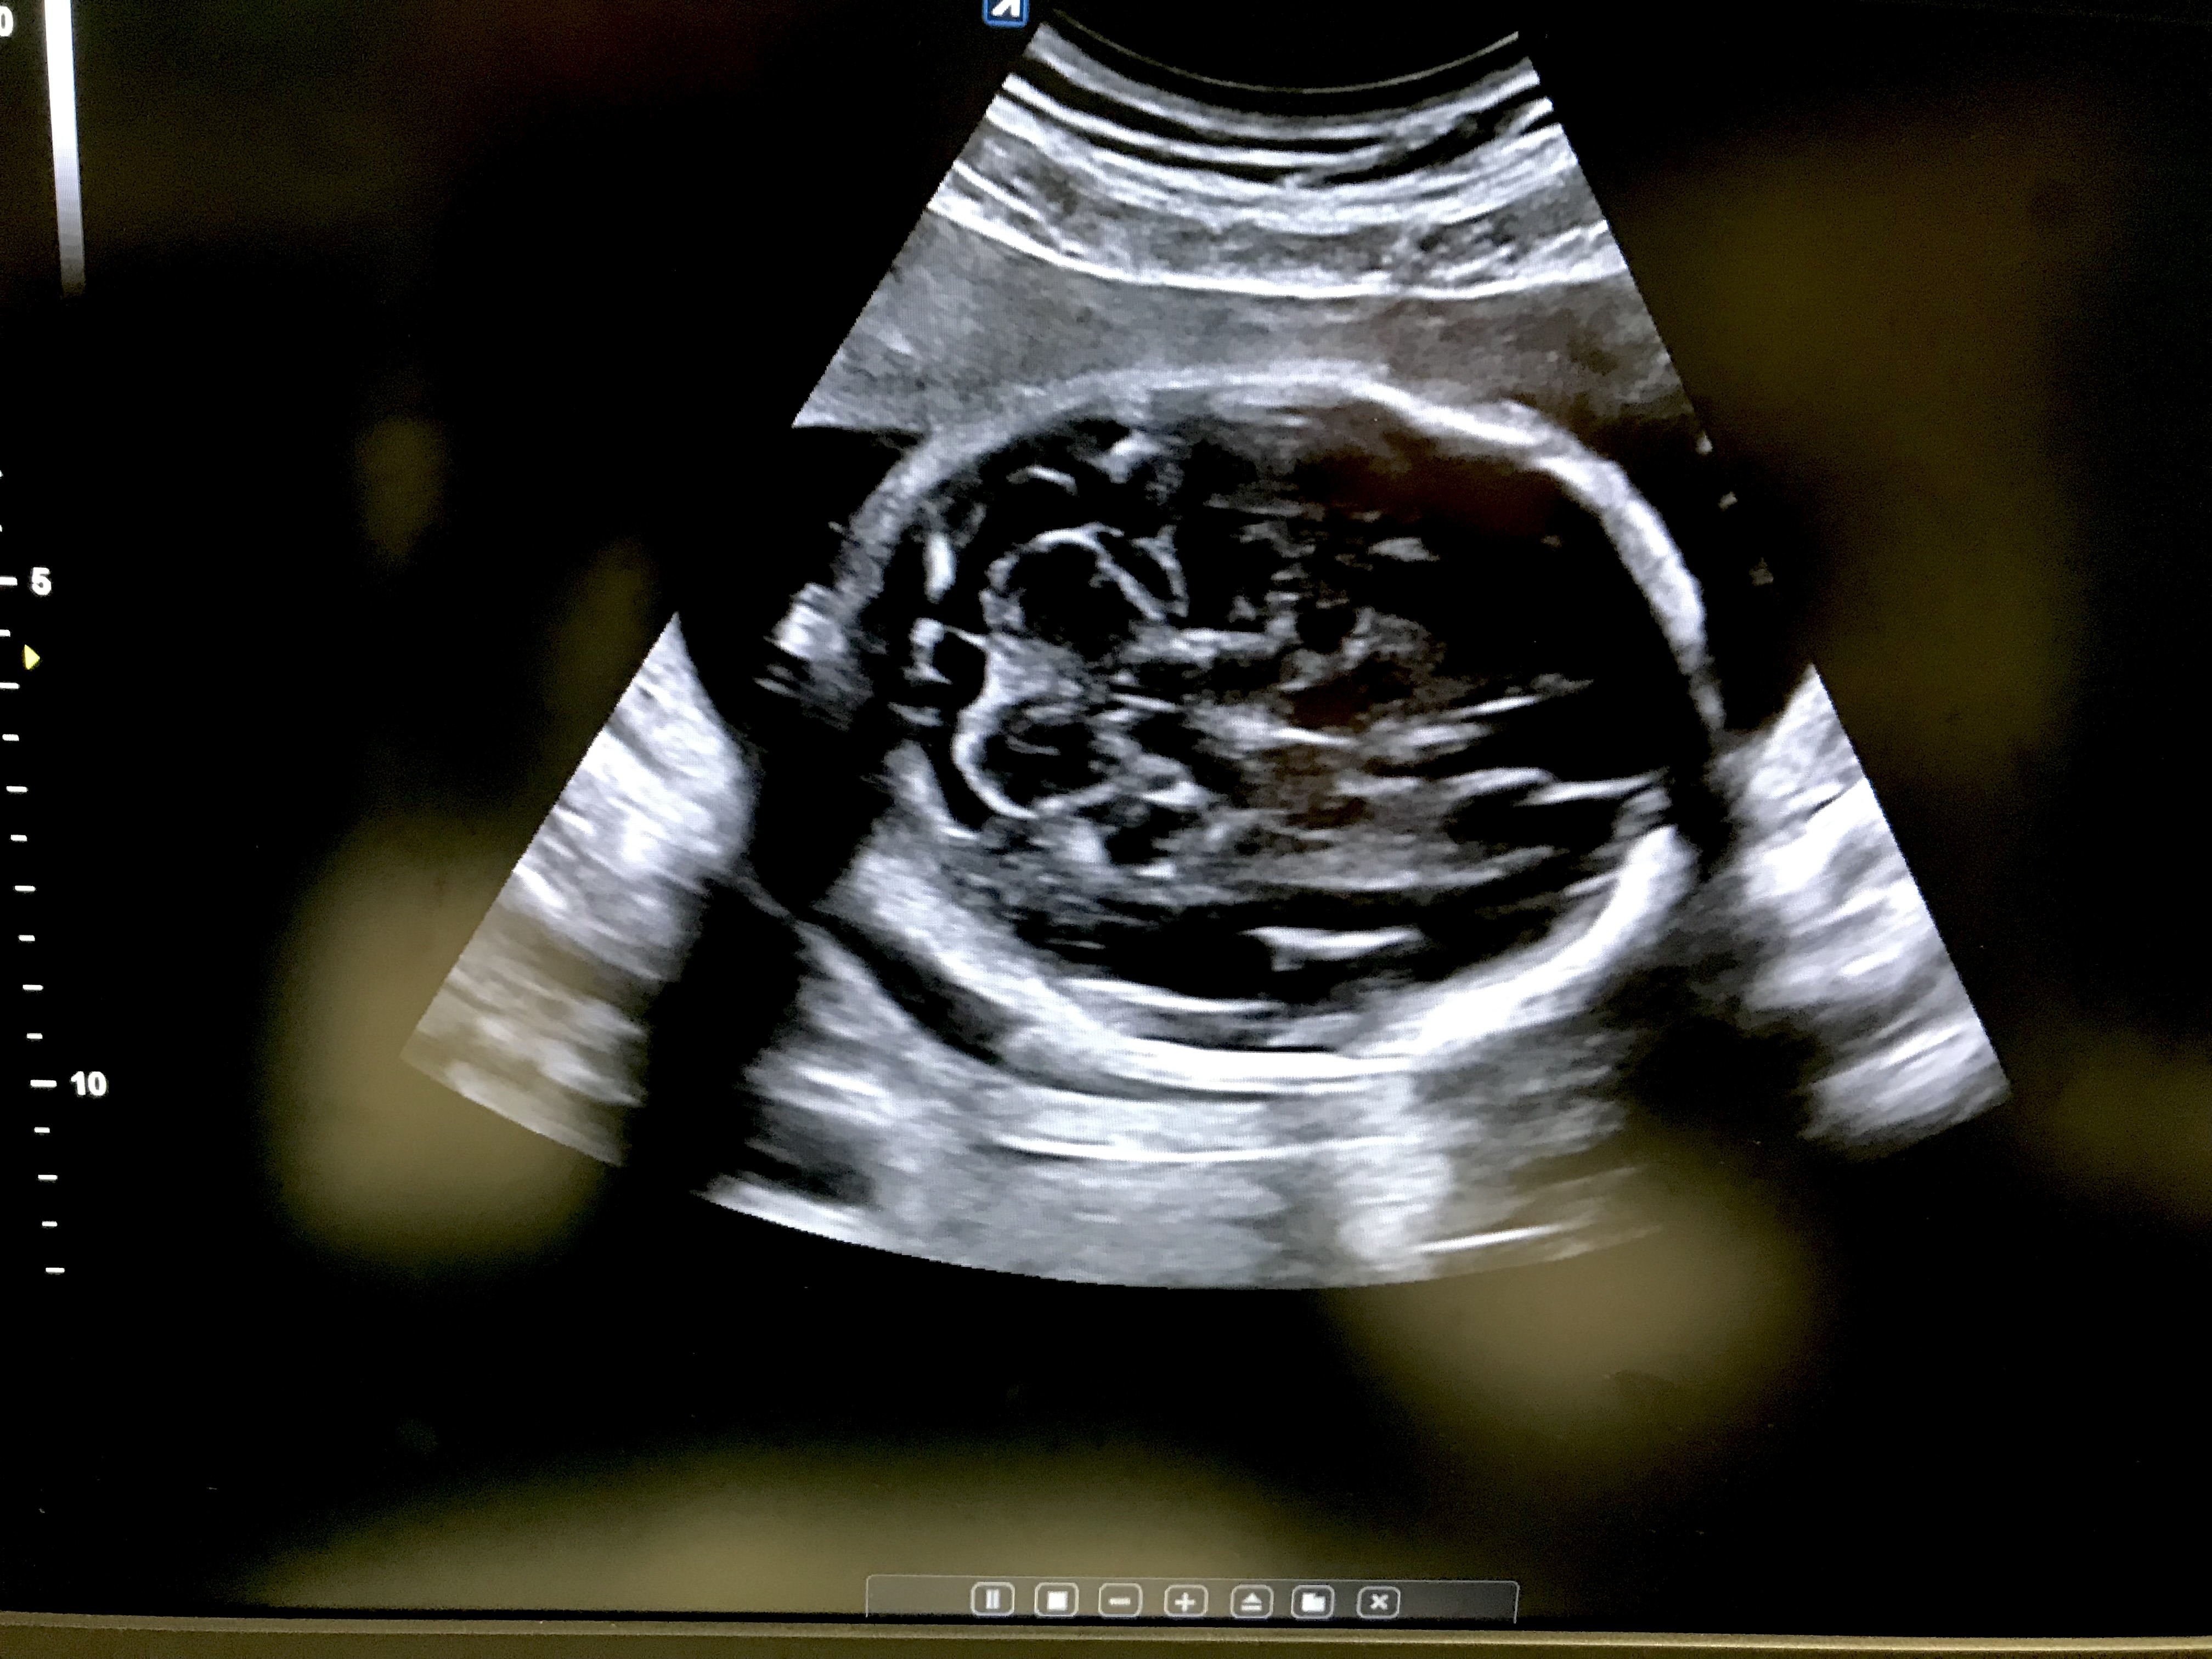
Example of a fetal ultrasound of the head brain, looking tight down from the top of the skull. Image from an Alpinion ultrasound system at RSNA 2022.
MRI of a fetus infected with zika virus microcephaly, which causes a smaller head circumference measurement than what is normal. Image from a zika patient in Brazil, which was at the epicenter of the mosquito-borne zika virus outbreak. Image courtesy of RSNA
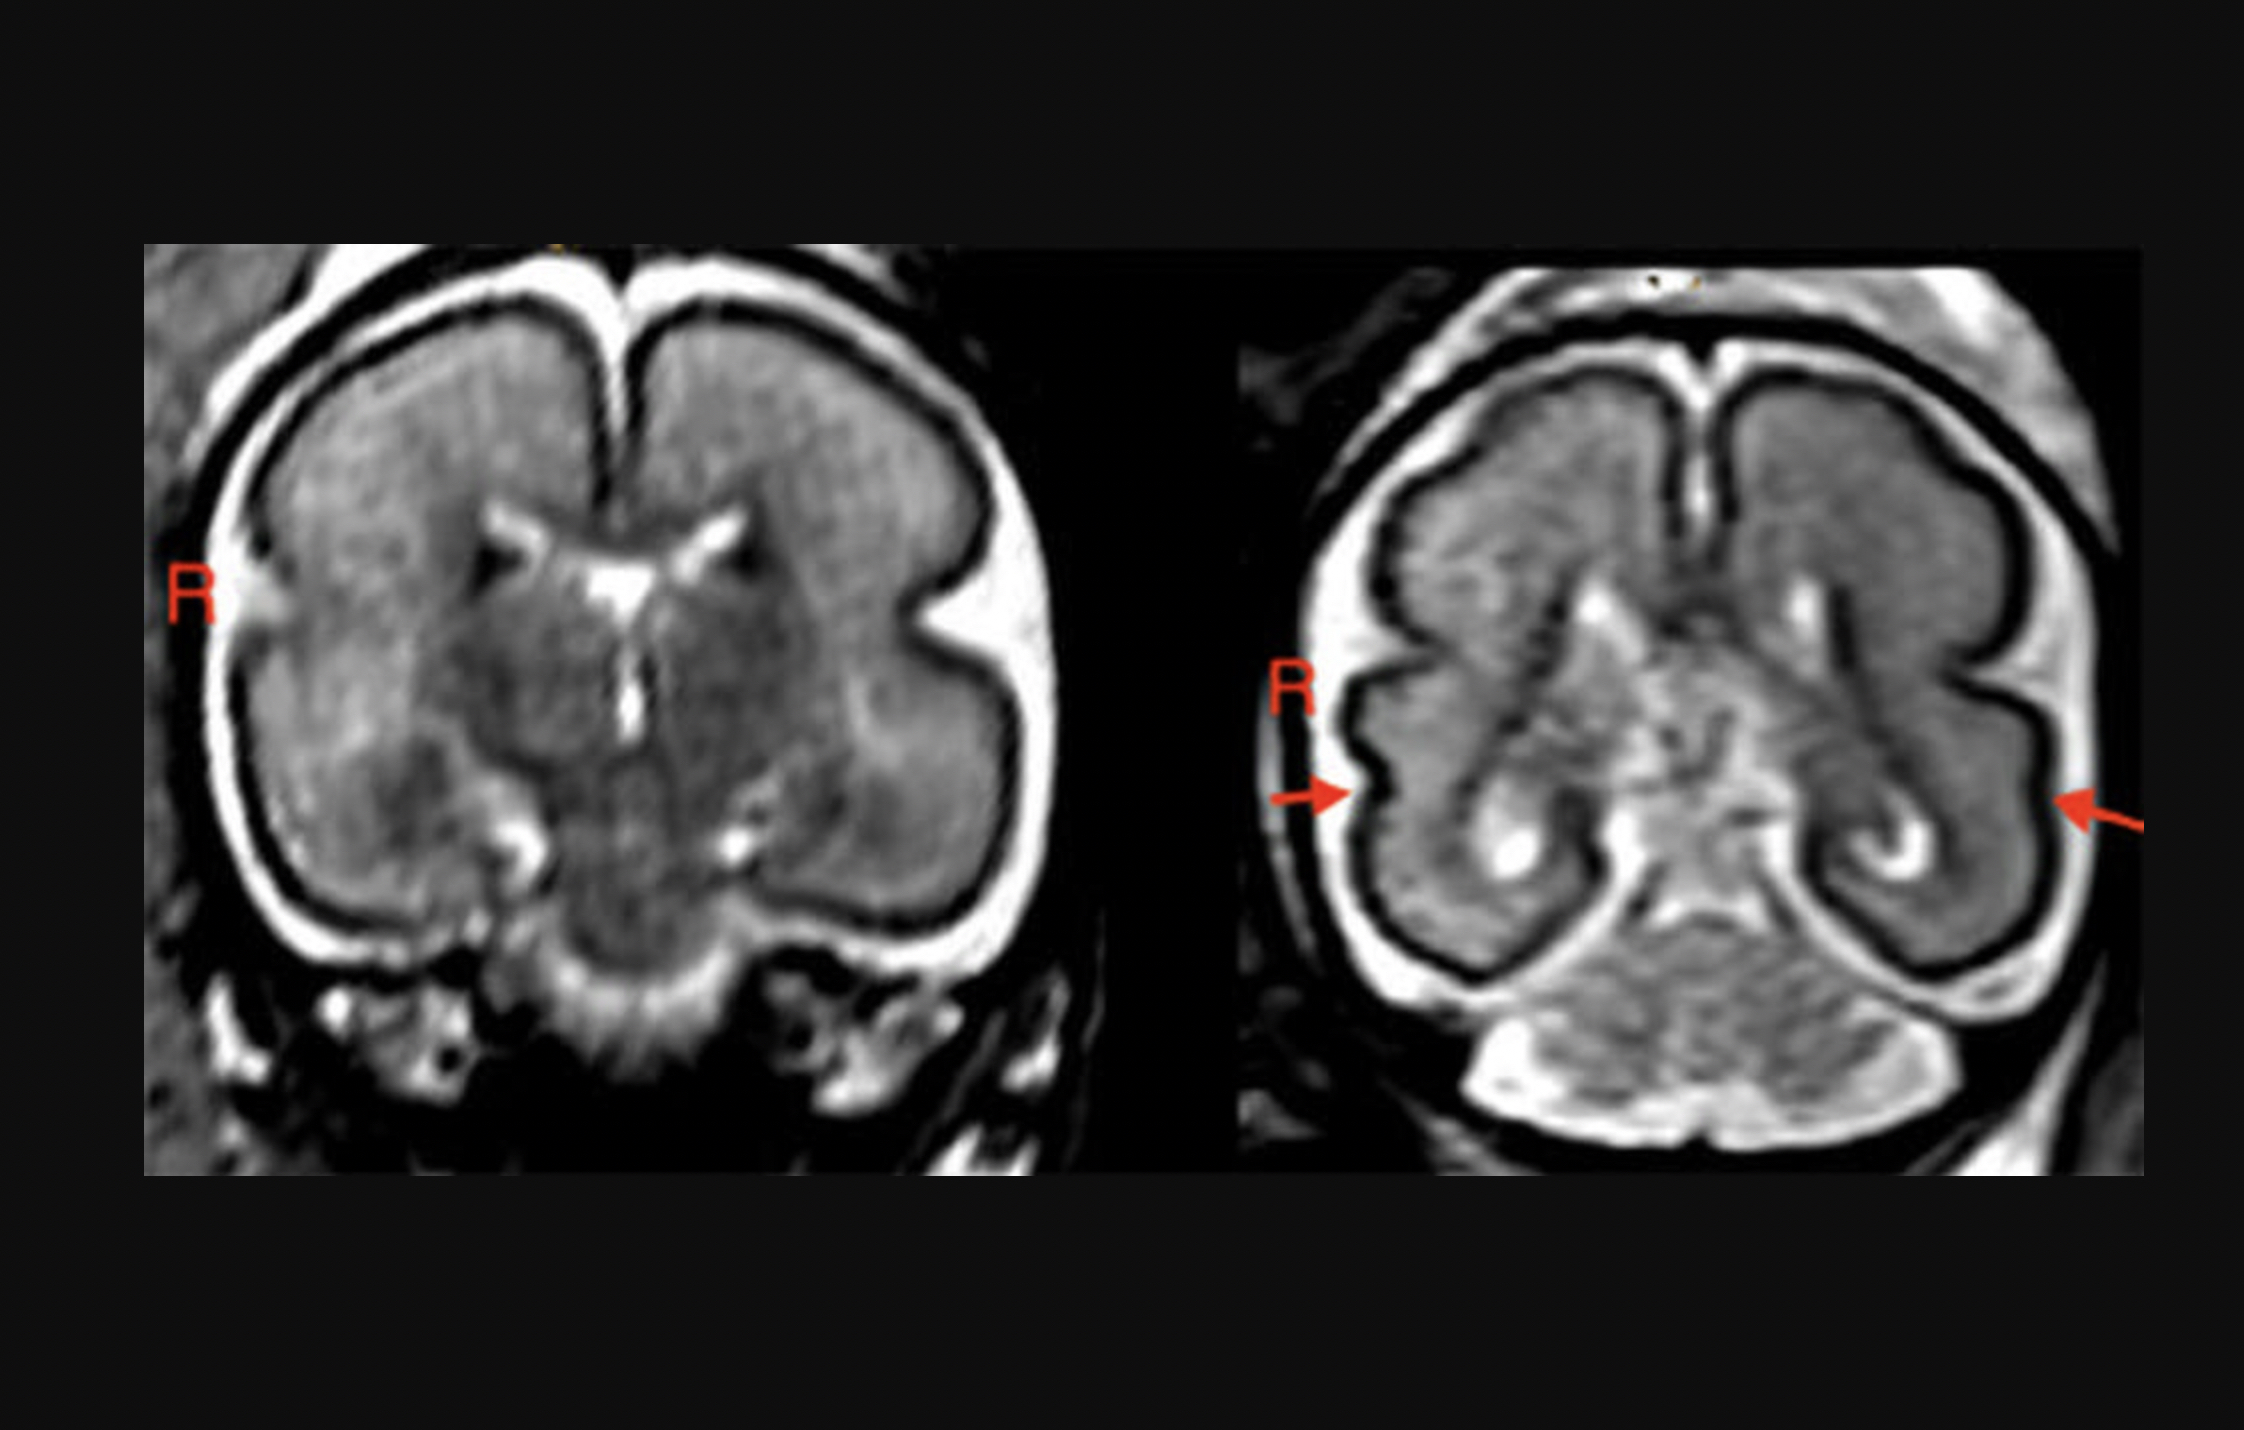
Alcohol consumption during pregnancy can change the unborn baby’s brain structure and delay brain development. Left: Fetal brain post-intrauterine alcohol exposure in fetus between 25 and 29 gestational weeks. Note the smooth cortex in frontoparietal and temporal lobes. Right: Brain of matched healthy control case in fetus between 25 and 28 gestational weeks. The superior temporal sulcus is already bilaterally formed (red arrows) and appears deeper on the right hemisphere than on the left. Read more about this study.
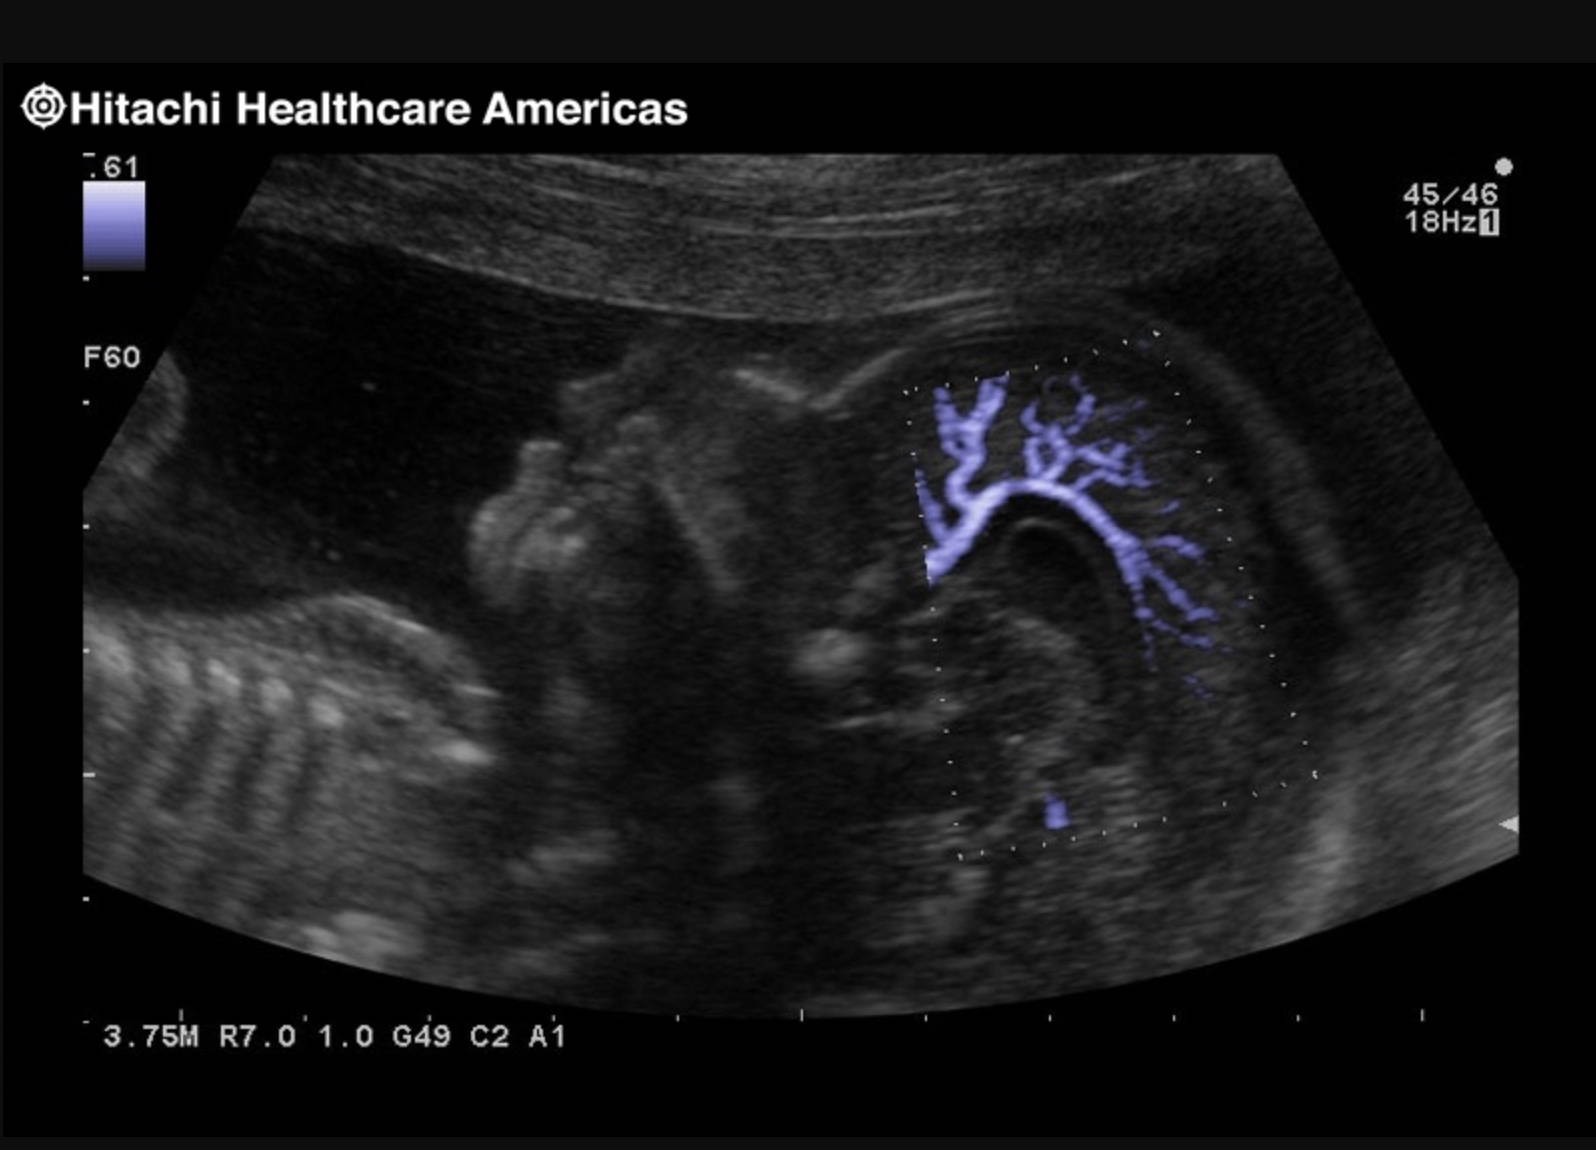
Third trimester fetal face and cerebral blood flow images with a Hitachi Prosound F37 ultrasound system. The ultrasound shows flow in the pericallose artery in the fetal brain with a highly sensitive color mode (DFI). Image courtesy of Hitachi.
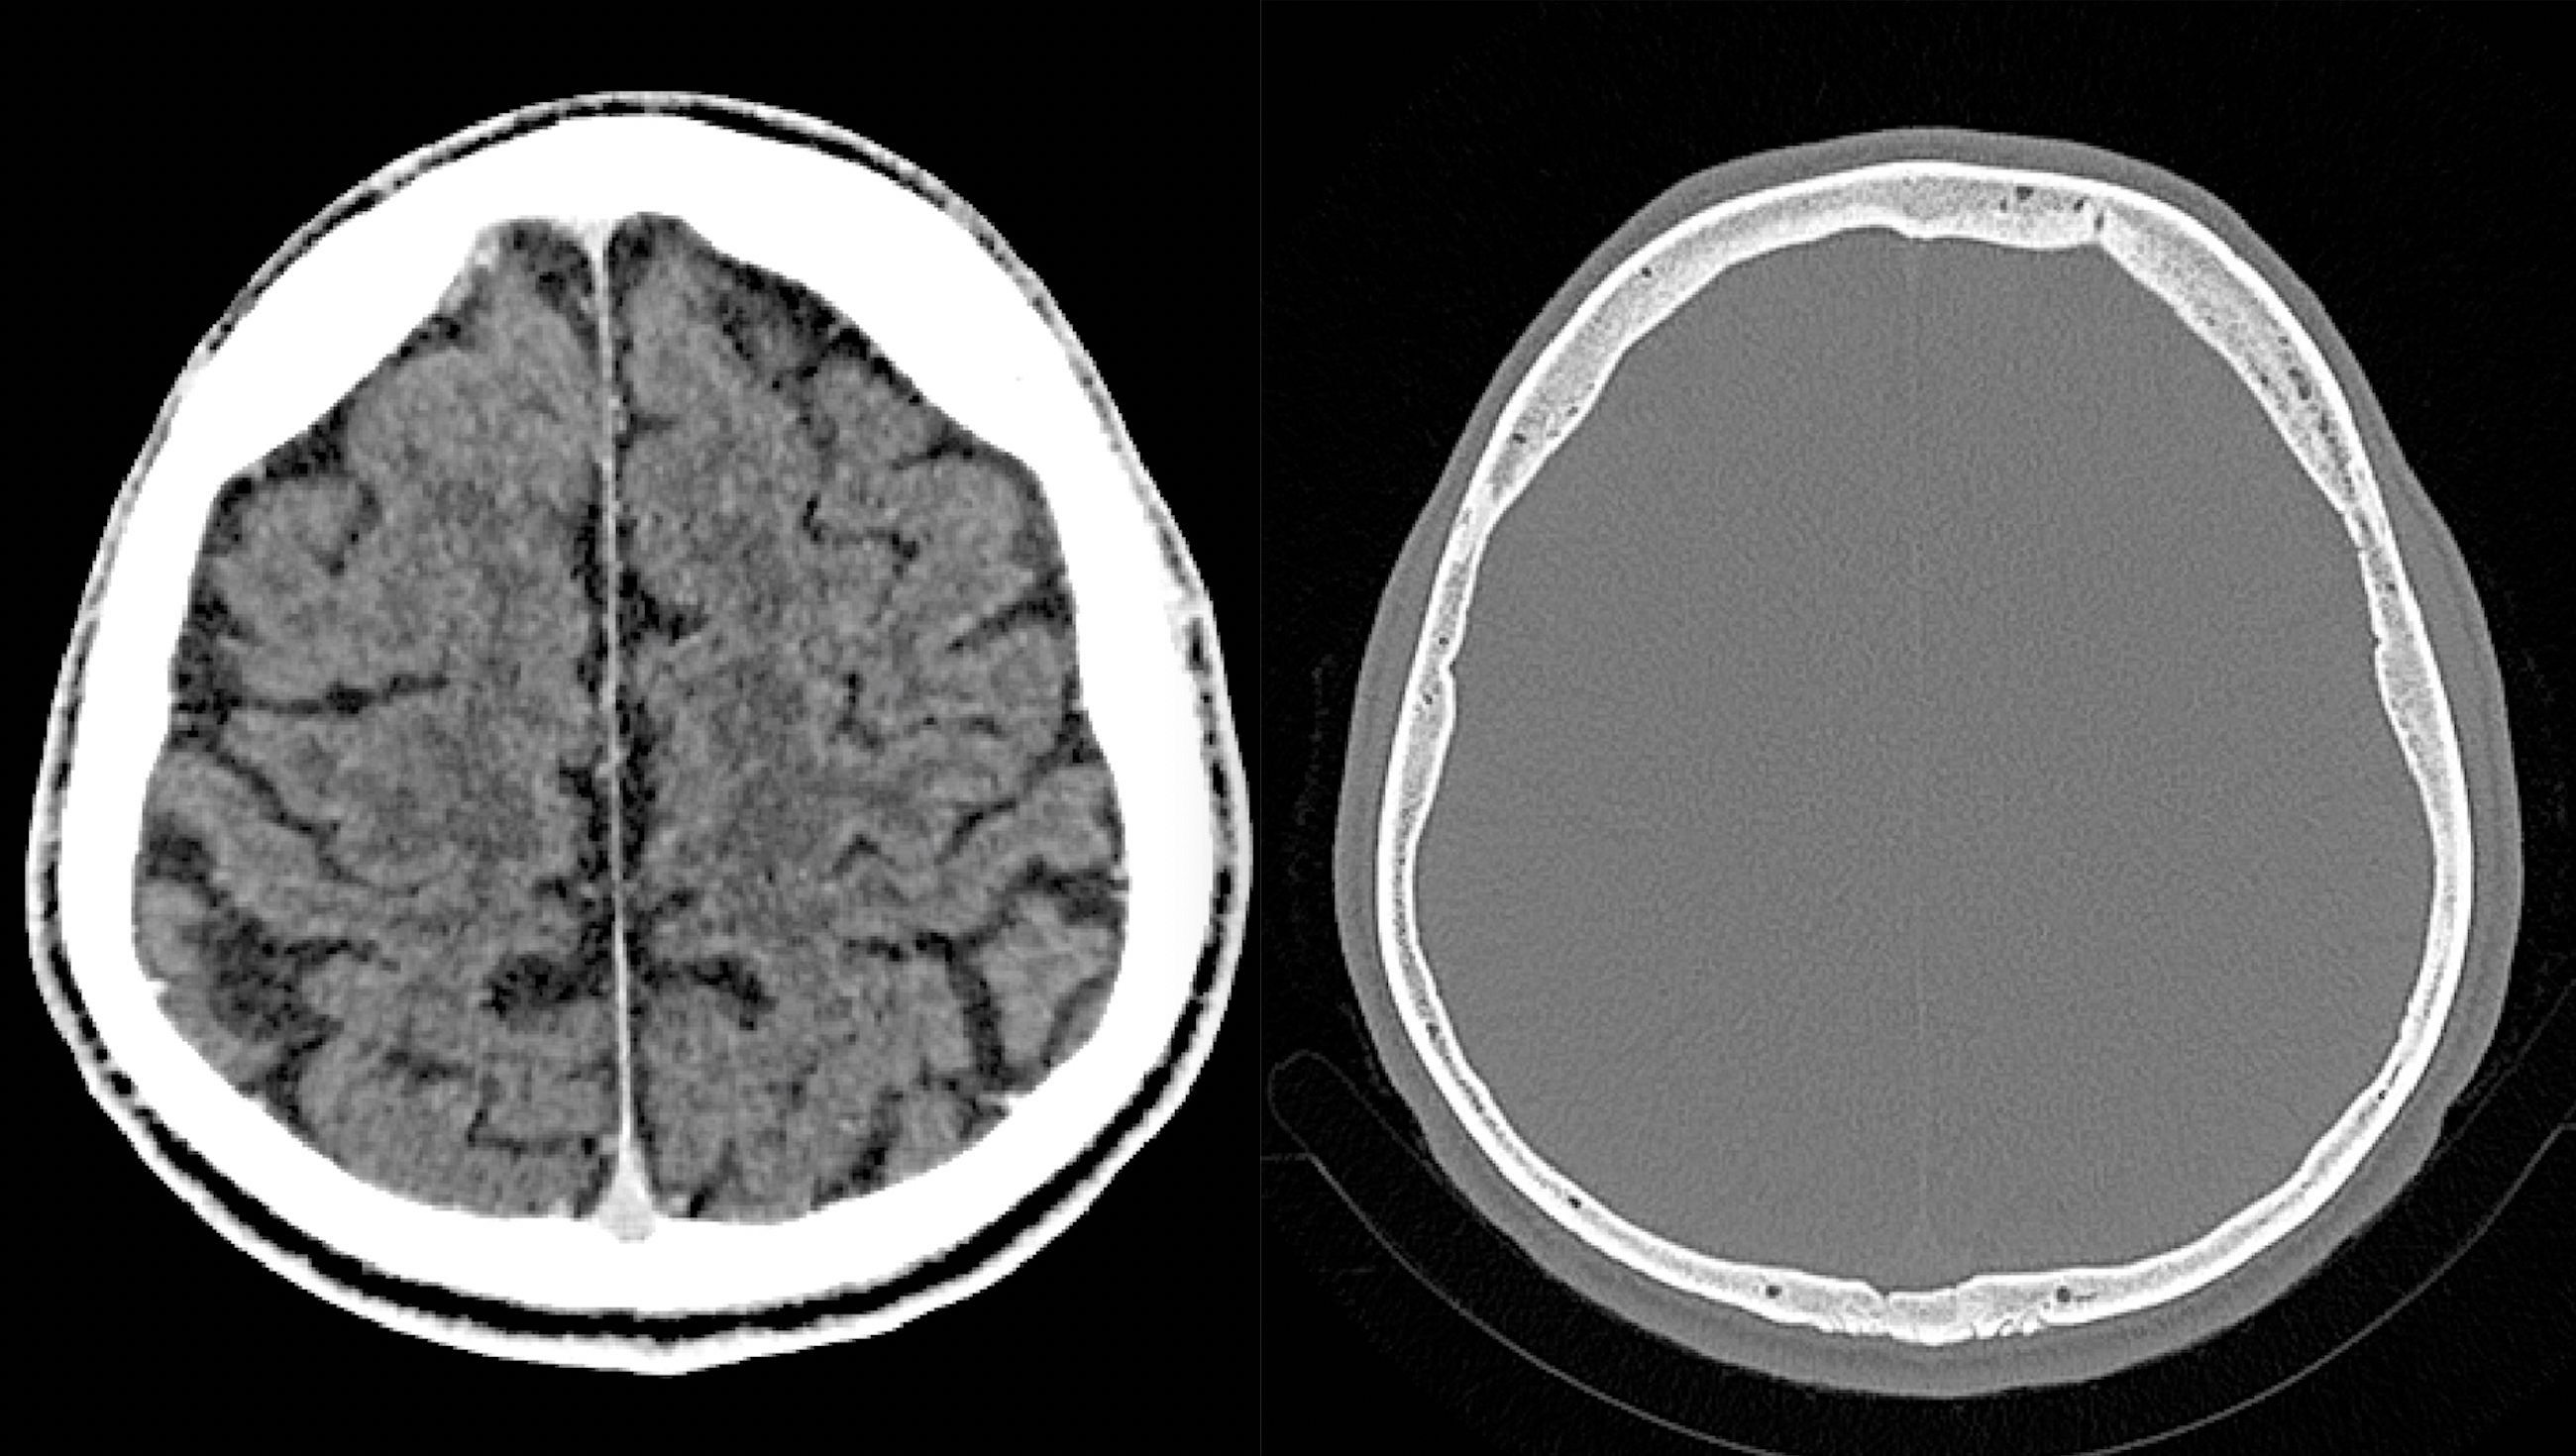
A comparison of contrast and noncontrast brain computed tomography (CT) scans from the same patient.The iodine contrast have help show details in soft tissues and organs that otherwise cannot be seen on non-contrast scans.
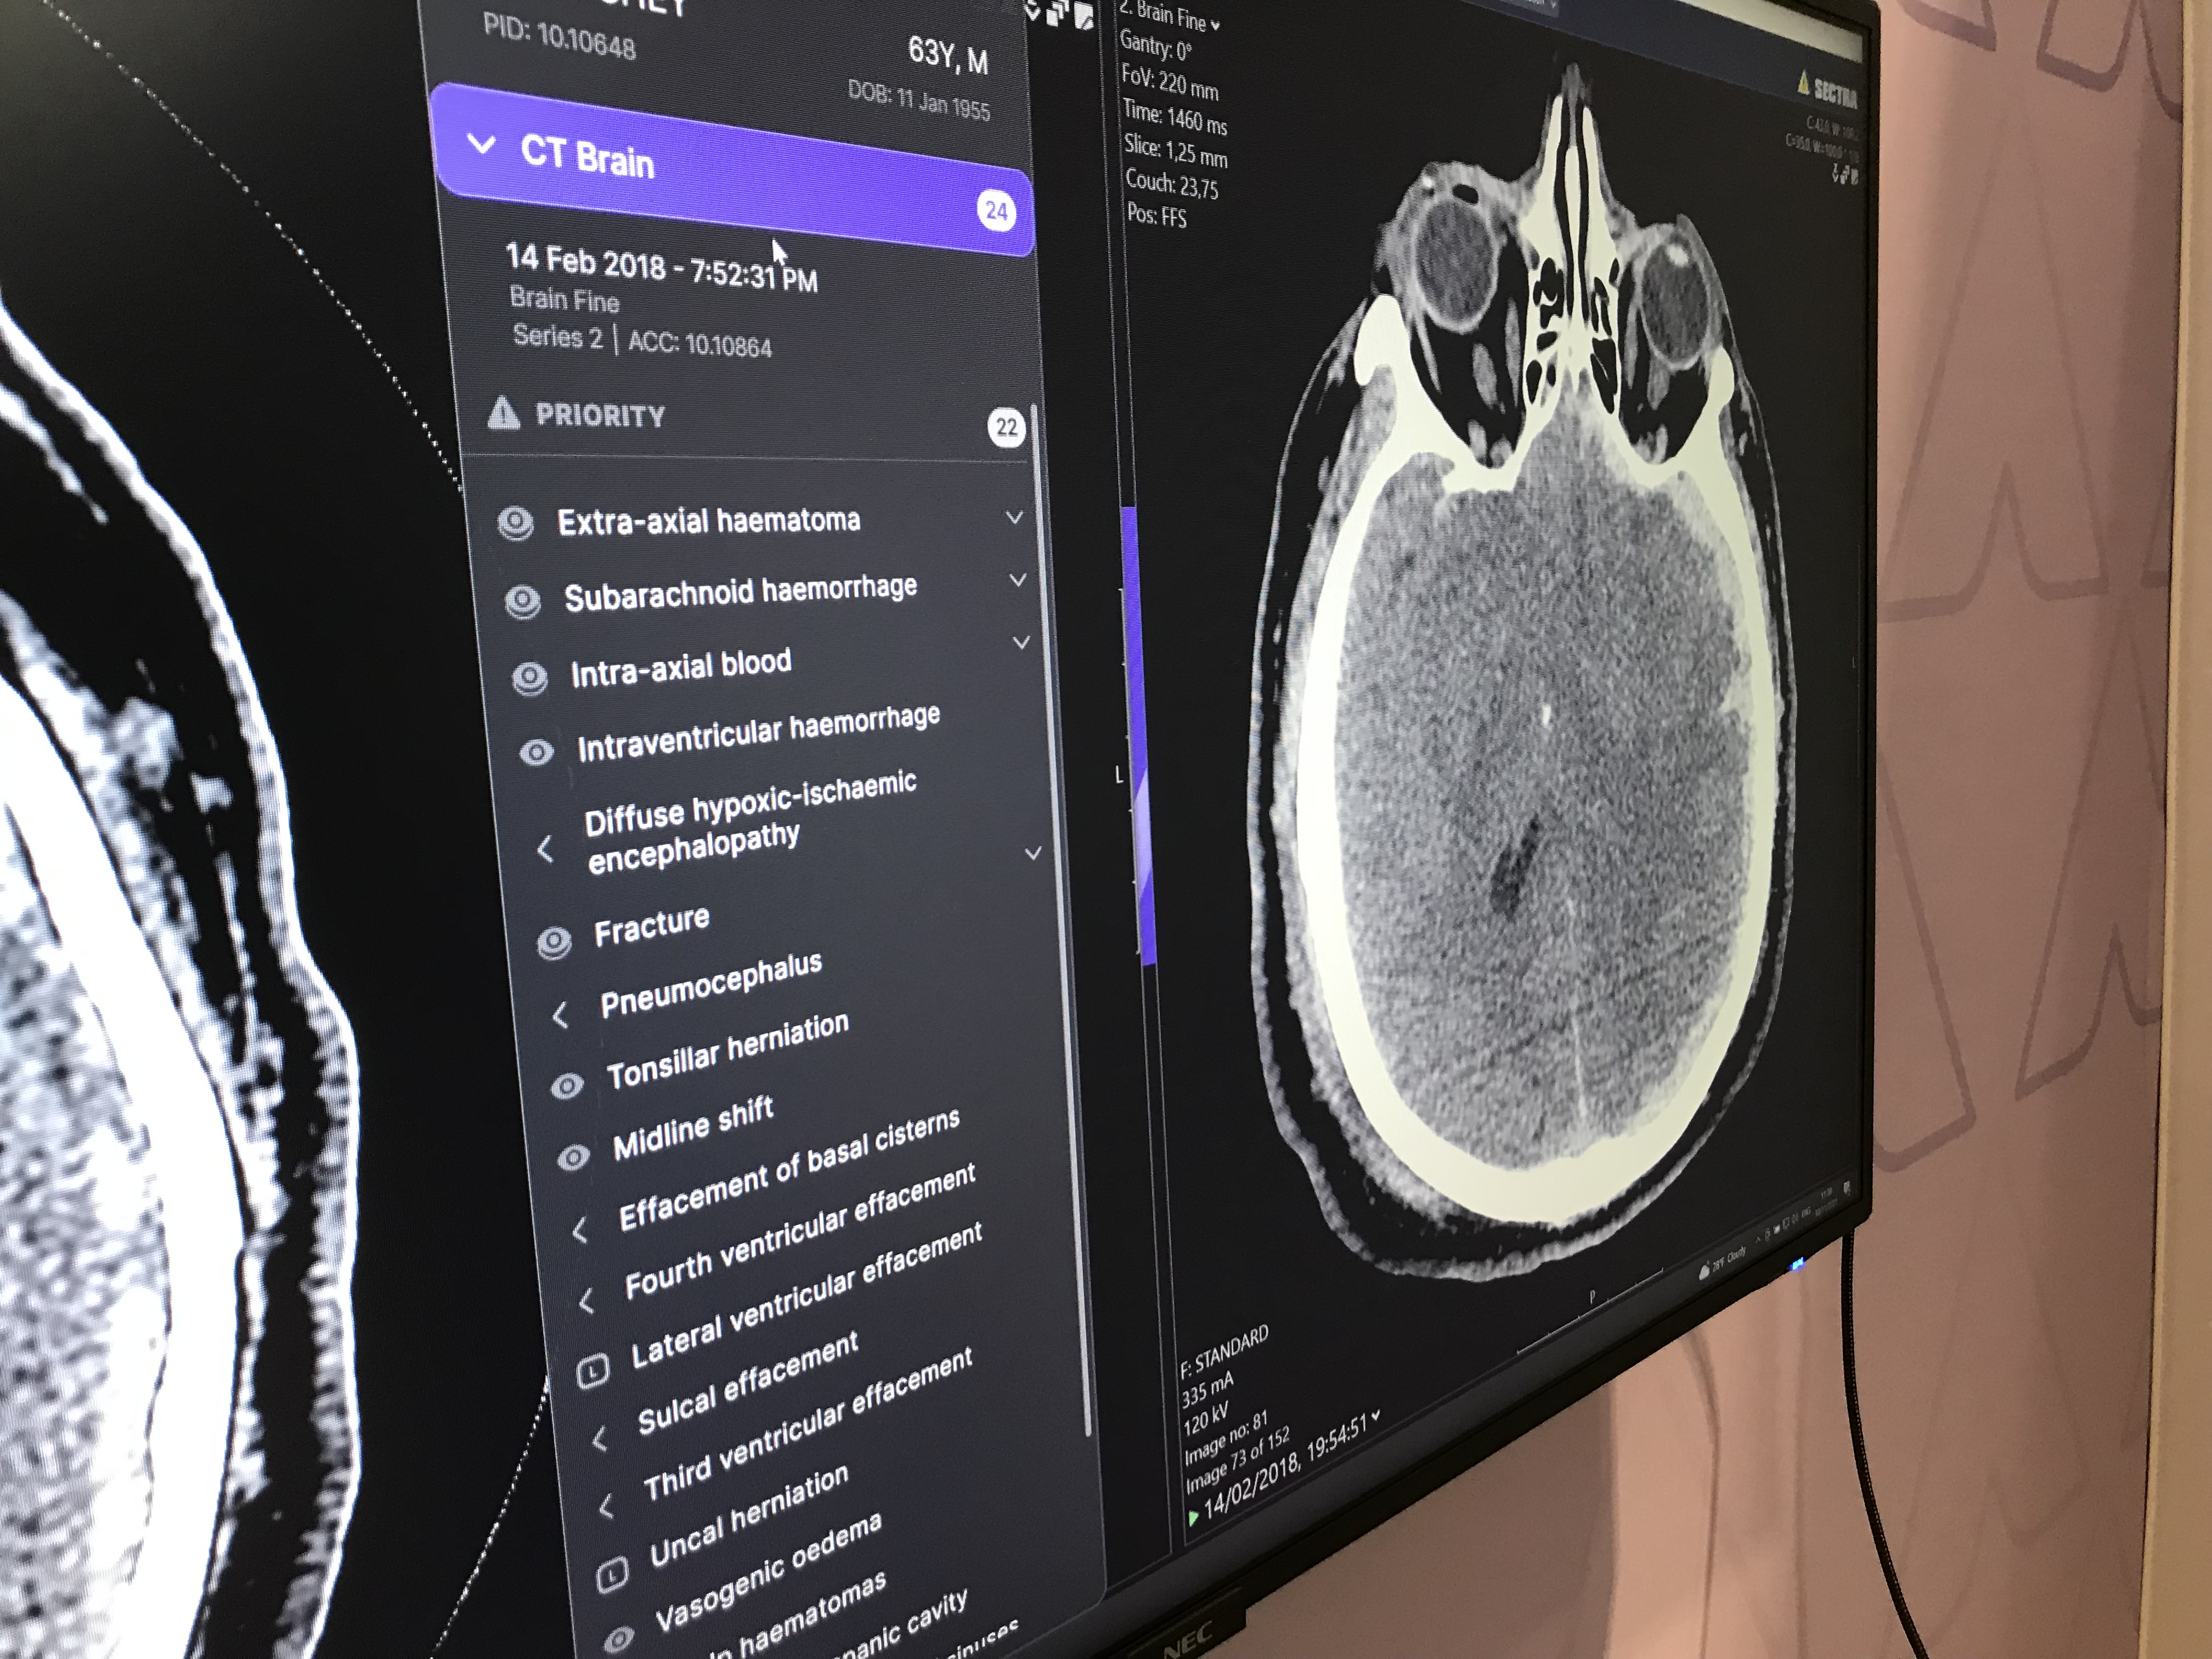
Example of data generated by an automated artificial intelligence (AI) brain CT assessment tool from Annalise.ai at RSNA 2022. The brain is a complex organ composed of irregular shapes, but AI can help automate this complex quanitification of the brain.

Brain CT scan howing shrapnel lodged between the hemispheres of the brain, resulting from Russian rocket artillery striking the front temple of a 13-year-old female civilian during the March 2022 invasion of the Mykolaiv region, Ukraine. Following the bombardment of her village, she was transported to Ohmatdyt Children's Hospital in Kyiv for fragment extraction. The procedure, conducted under ultrasound guidance, successfully alleviated severe headache pain and restored movement to the right side of her body post-removal. See more clinical images of the Ukraine-Russian war
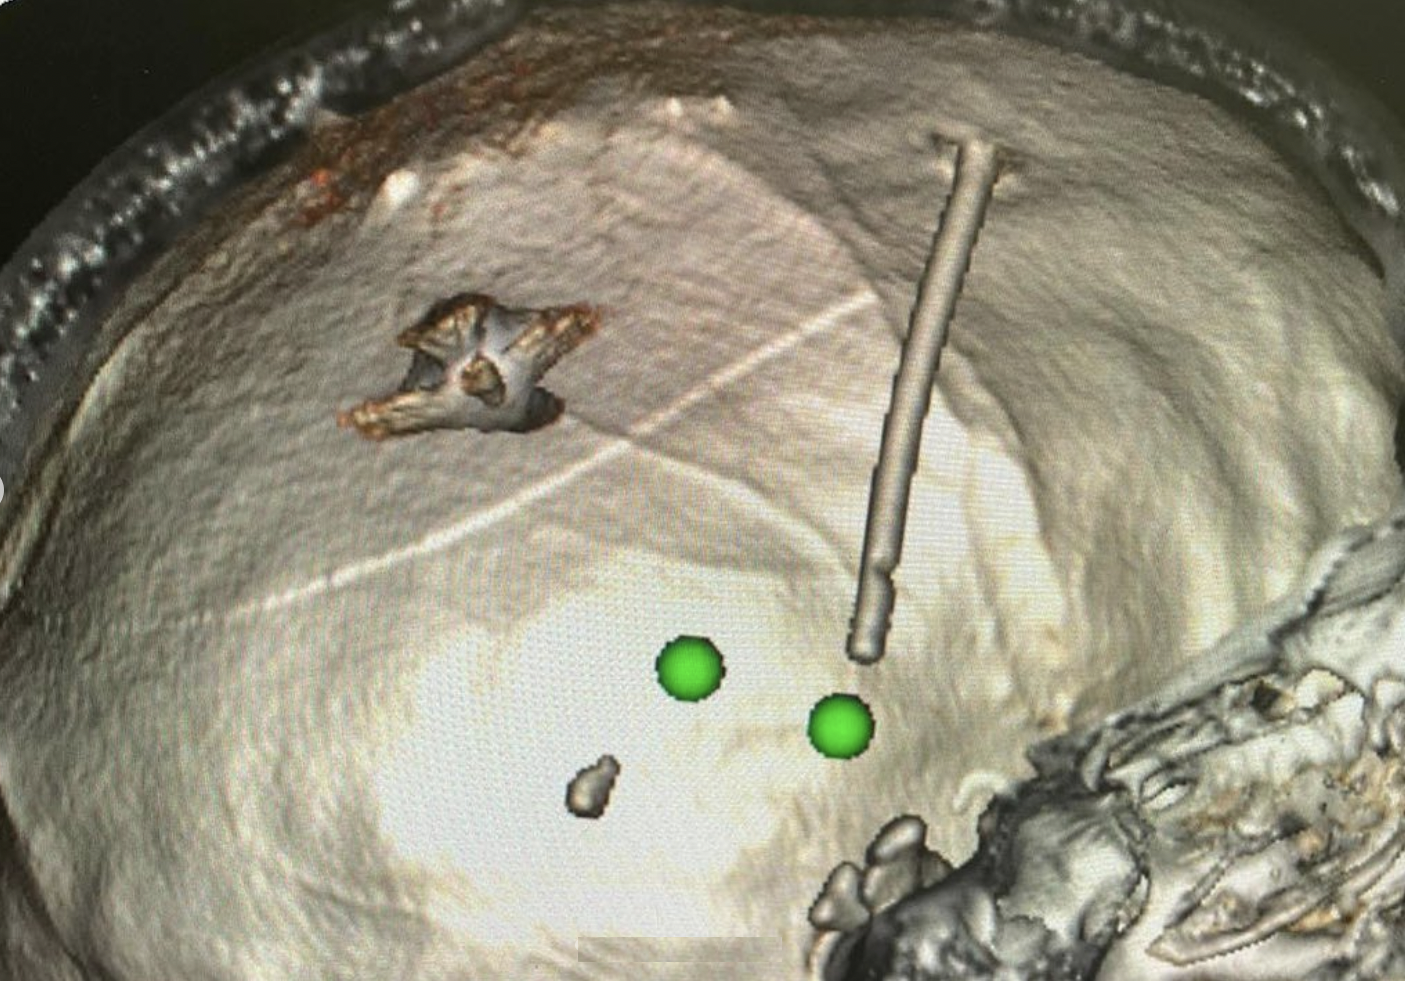
Ultrasound guidance was used to retrieve a shrapnel fragment located in between the hemispheres of the brain after entering the front temple in 13-year-old female civilian from Russian rocket artillery in Ukraine. Ohmatdyt children's hospital in Kyiv removed the fragment. See more clinical images of the Ukraine-Russian war
Brain MRI views on an Intelerad PACS at RSNA 2022.
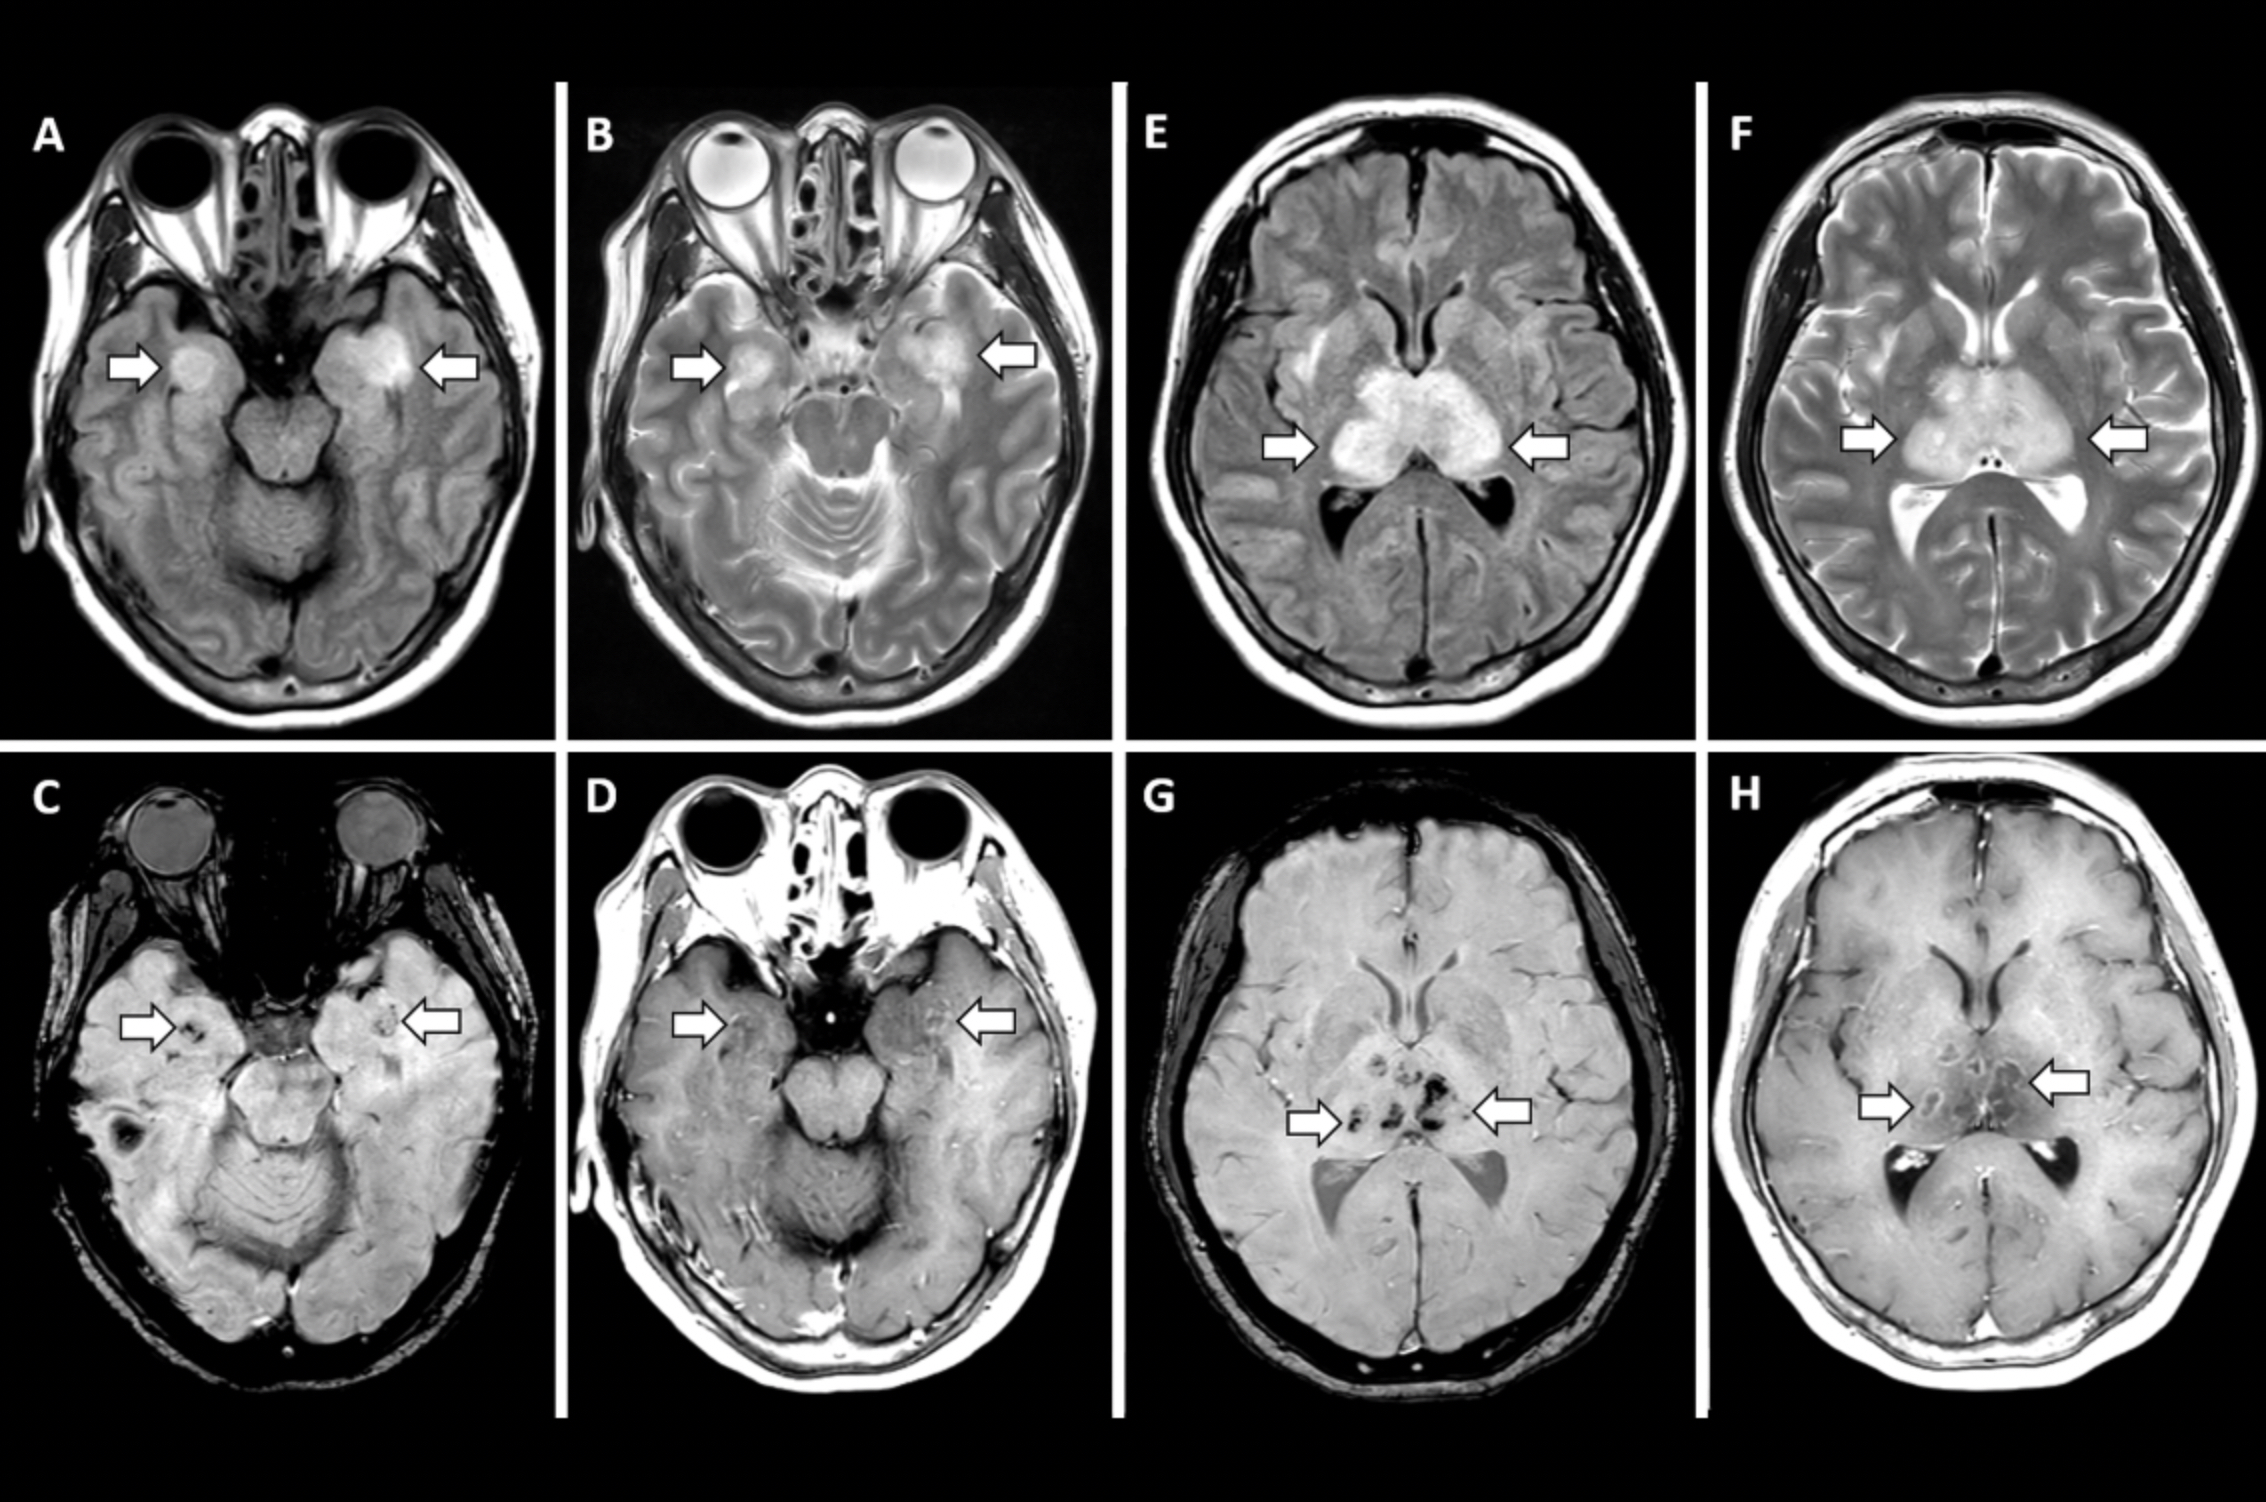
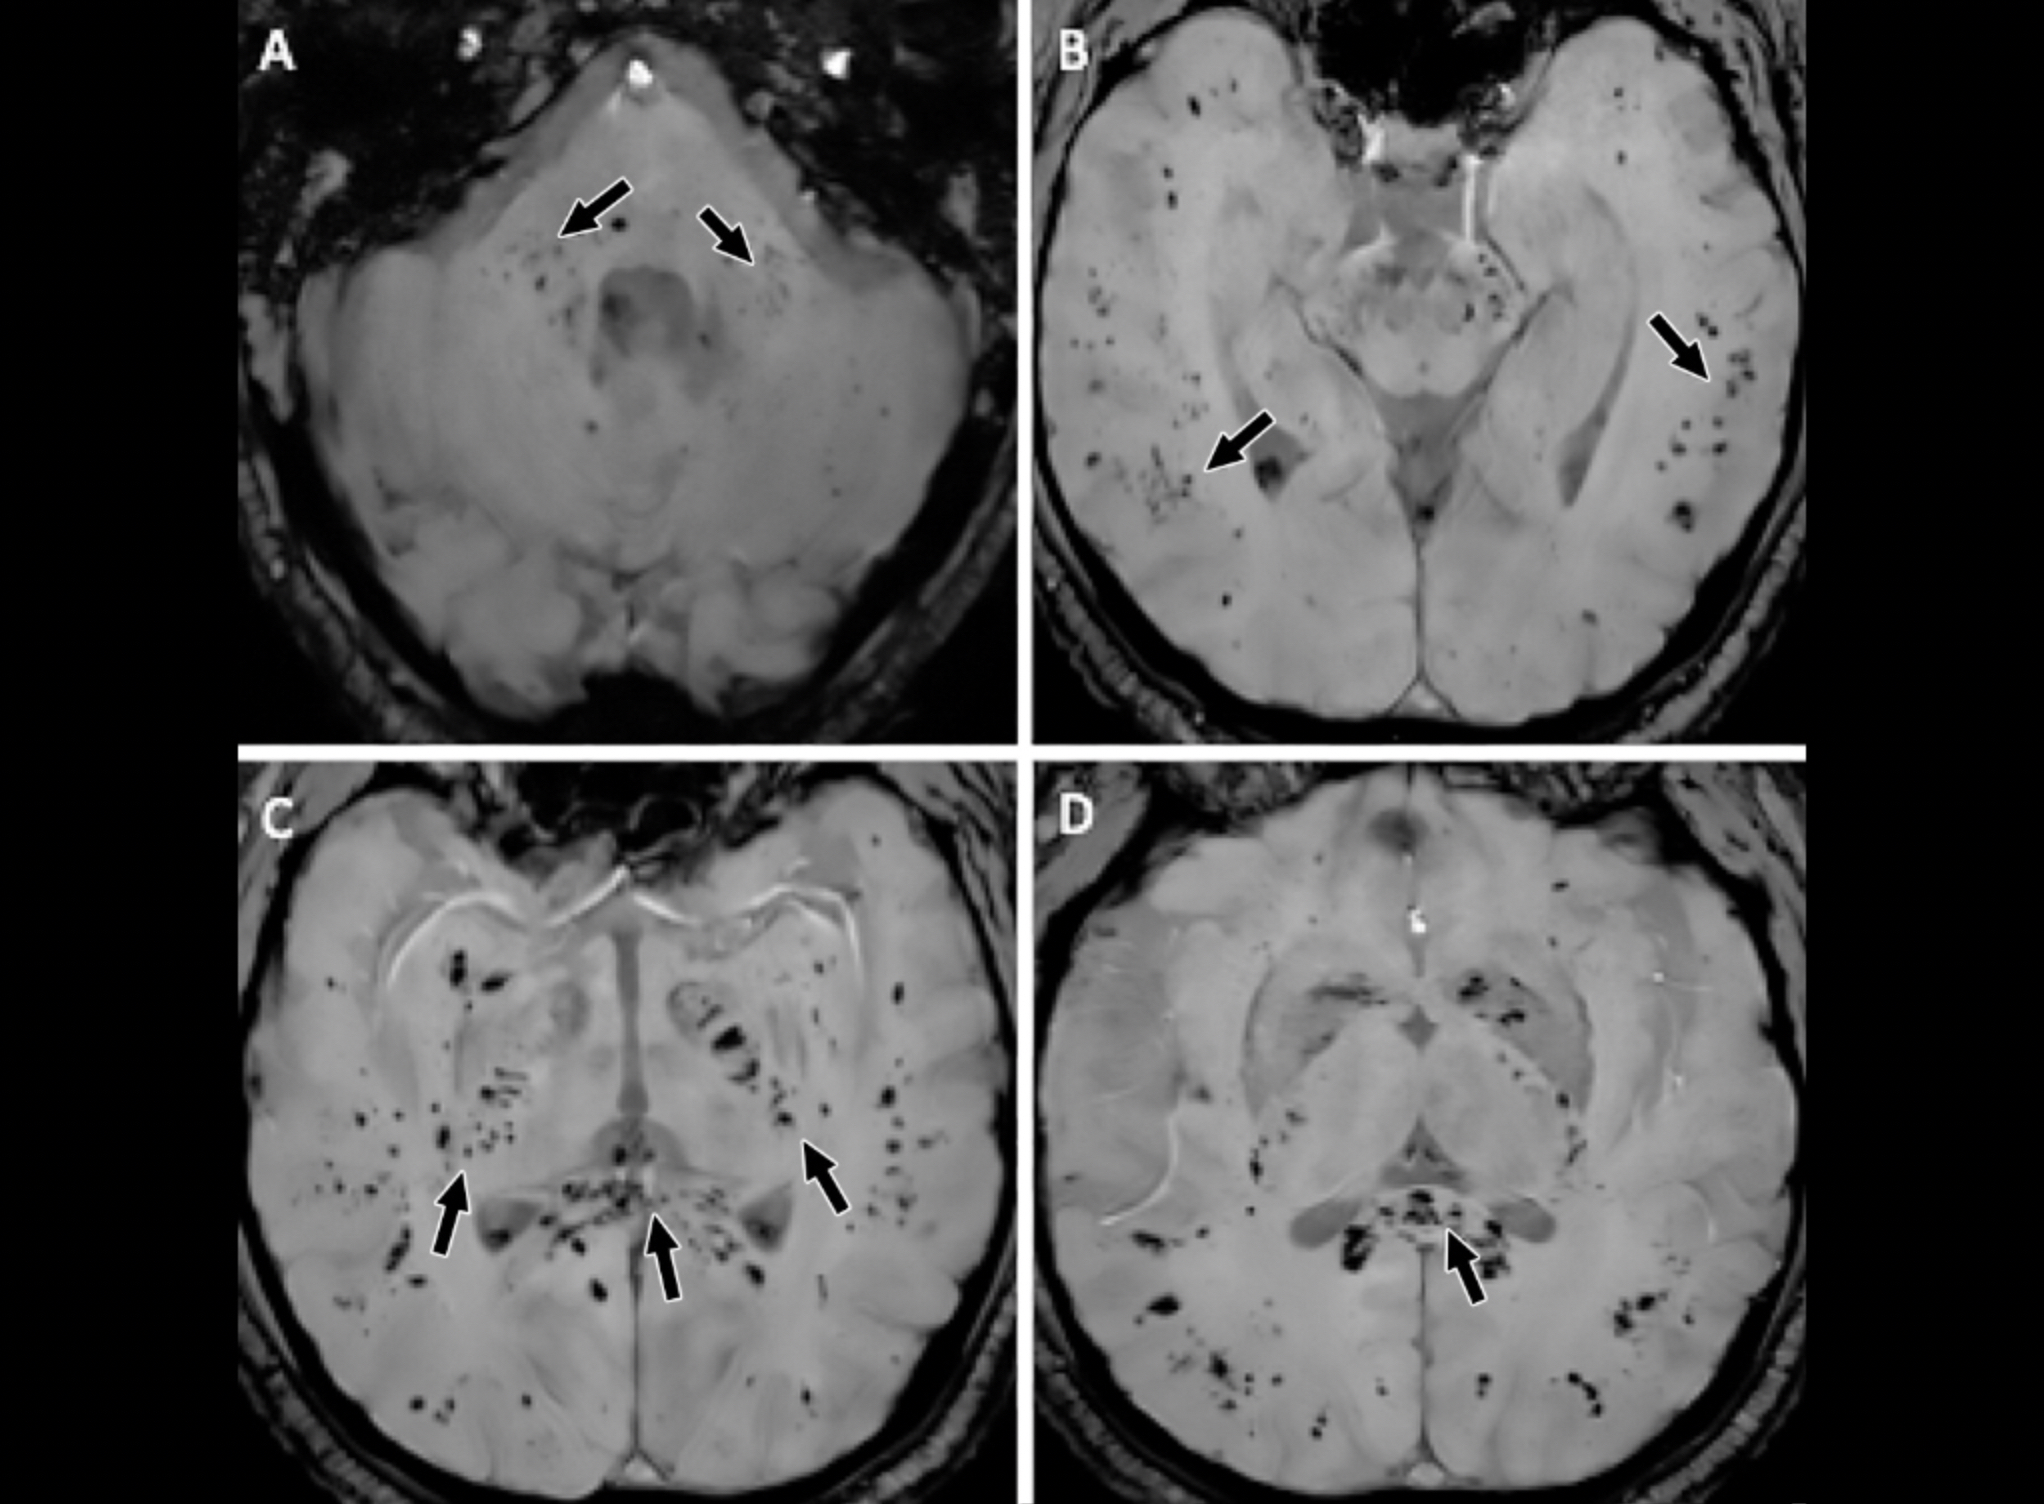
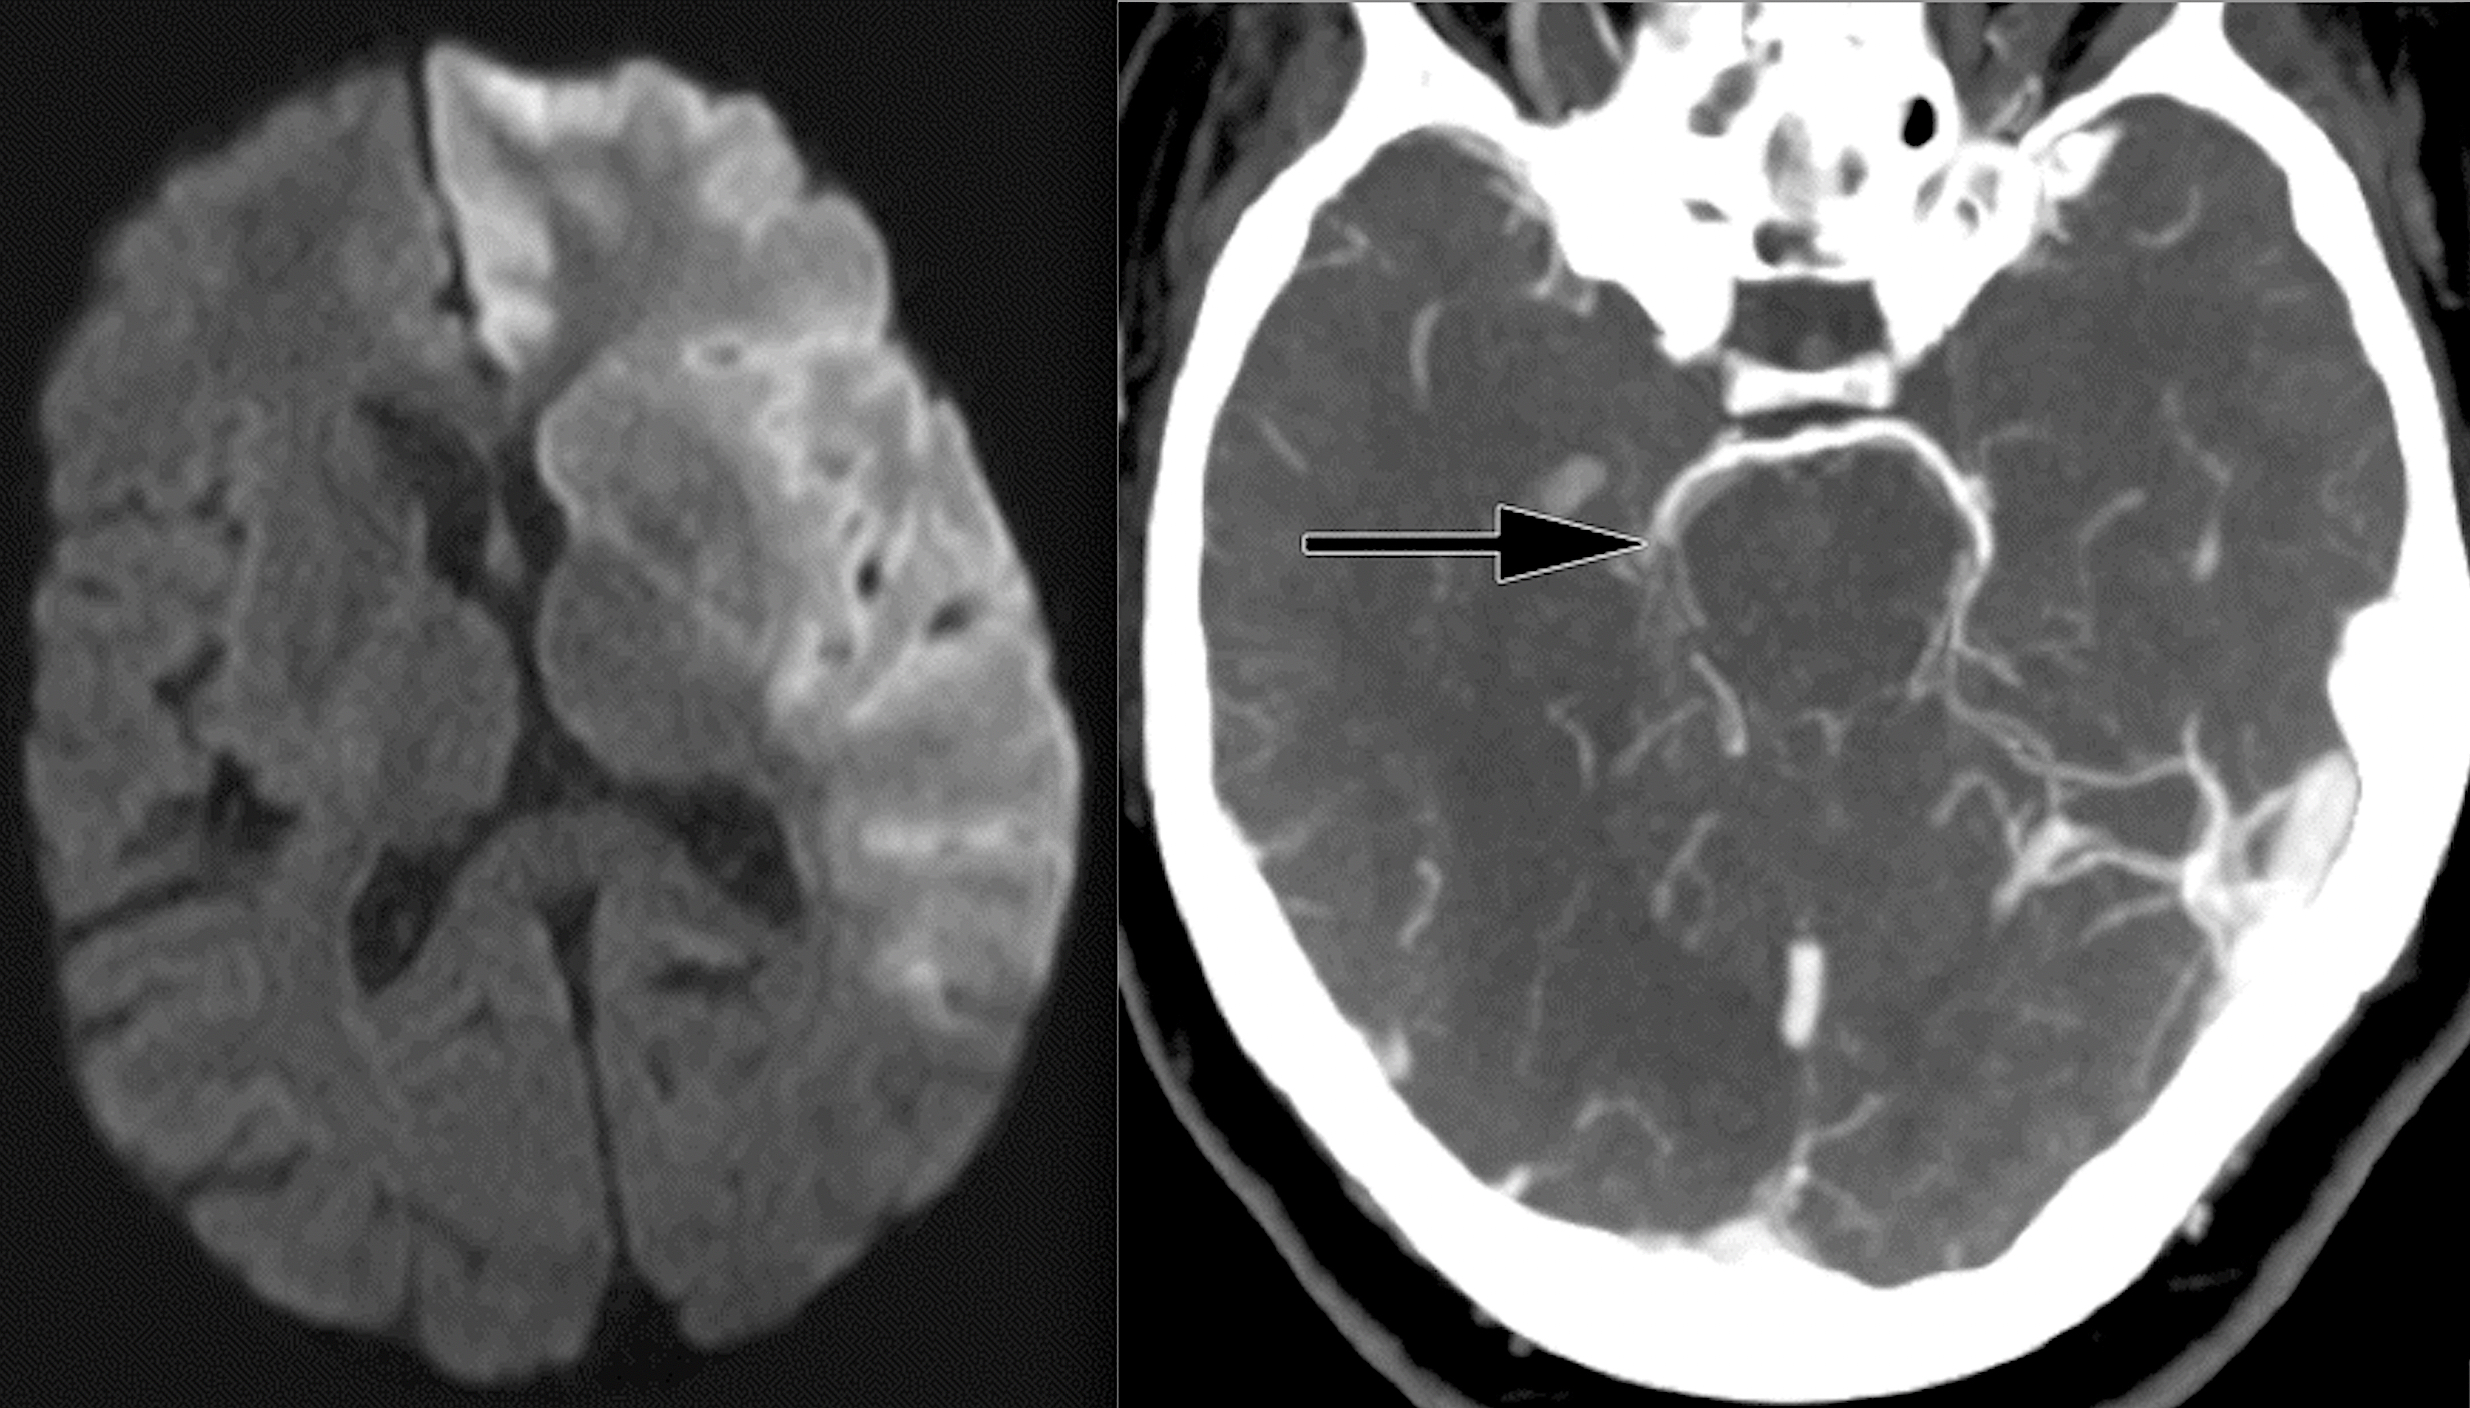
Acute necrotizing encephalopathy is a rare complication of influenza and other viral infections and has been related to intracranial cytokine storms, which result in blood-brain barrier breakdown but without direct viral invasion. Evidence suggests this also happens in severe COVID-19 cytokine storm syndrome, resulting in brain hemorrhages. A, B, E, F, T2-weighted fluid-attenuated inversion recovery MRI scans demonstrate hyperintensity within the bilateral medial temporal lobes and thalami (arrows), with evidence of hemorrhage indicated by, C, G, hypointense signal (arrows) on susceptibility-weighted images and, D, H, rim enhancement (arrows) on contrast material–enhanced images. Image courtesy of RSNA. Read more.

Fludeoxyglucose F18 (FDG) radiotracer positron-emitting tomography (PET-CT) imaging of the brain. Brain cells consume the sugar attached to this radiotracer allowing the radioactive material to concentrate in areas of cell metabolism. The colors show areas of high and low metabolic activity in the brain and can be used to diagnose several conditions. Cancers have very high metabolic activity so will appear as bright spots in this type of imaging.

MRI scans showing diffuse white-matter abnormality. The top three panels display raw MRI images from very preterm infants born at 27 weeks (left), 26 weeks (center), and 31 weeks (right) of gestation. Higher signal intensity can be seen in the central white matter, particularly for the 31-week-gestation infant. The bottom panels display the corresponding slices with objectively segmented DWMA in yellow. The 27-week infant (left) was diagnosed with mild DWMA, the 26-week infant (center) was diagnosed with moderate DWMA, and the 31-week infant had severe DWMA. Image and caption courtesy of Cincinnati Children's and Scientific Reports. Read more
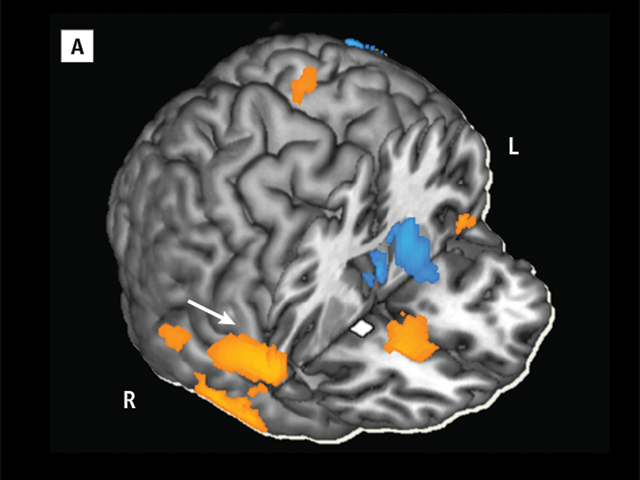
Functional MRI (fMRI image) measuring the strength of connectivity within specific brain circuits before and after subjects were administered either a 20-milligram oral dose of methylphenidate, commonly used in treating ADHD, or a placebo. The scans indicate that methylphenidate enhances connectivity between multiple brain regions responsible for regulating emotions and exerting control over behaviors. This insightful image is courtesy of Brookhaven, Stony Brook, and the National Institutes of Health. Read more
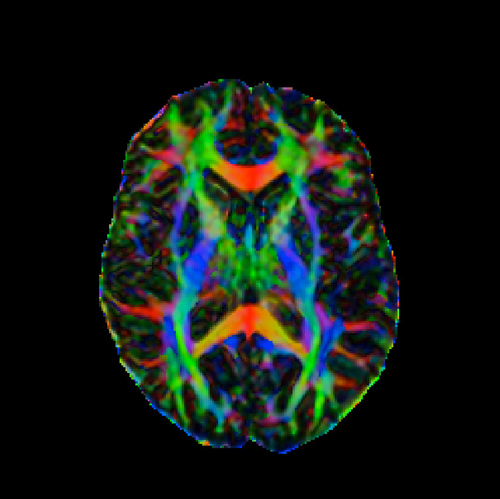
An example of MRI diffusion tensor imaging (DTI) to characterize microstructural changes. The imaging method shows the pathways of neurons in the brain to help diagnose disease or show if treatments are effective.
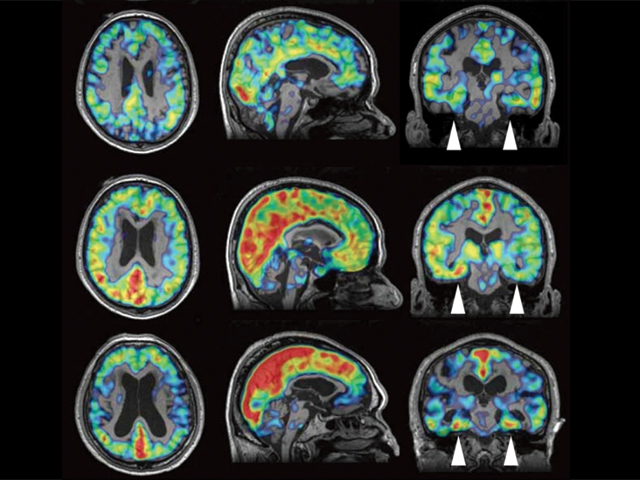
PET imaging series showing the progression of Alzheimer’s disease beta-amyloid plaques imaged using a tau PET flortaucipir F-18 radiotracer. The tau amyloid appears in red. Nuclear imaging agents such as this and amyloid PET florbetapir F-18 made diagnosis and treatment of Alzheimer’s possible in the past decade.
Medium vessel occlusion stroke 3D model created from a patient's CT scan and displayed at RSNA 2023. This 3D printed model is used to help with education of medical students so they can understand the anatomy in 3D formate easier than in a 2D image.

Example of an ischemic stroke angiogram showing blood flow only on one side of the brain due to blocked blood flow. Normal blood flow would show a mirror image of the vessels on the right side of the brain in this image.

An interactive carotid artery diagram from an interventional procedural report showing a carotid artery stent placement and stenosis areas.

Parametric imaging of an ischemic stroke pre- and post-thrombectomy to remove the clot. Canon angiography image.
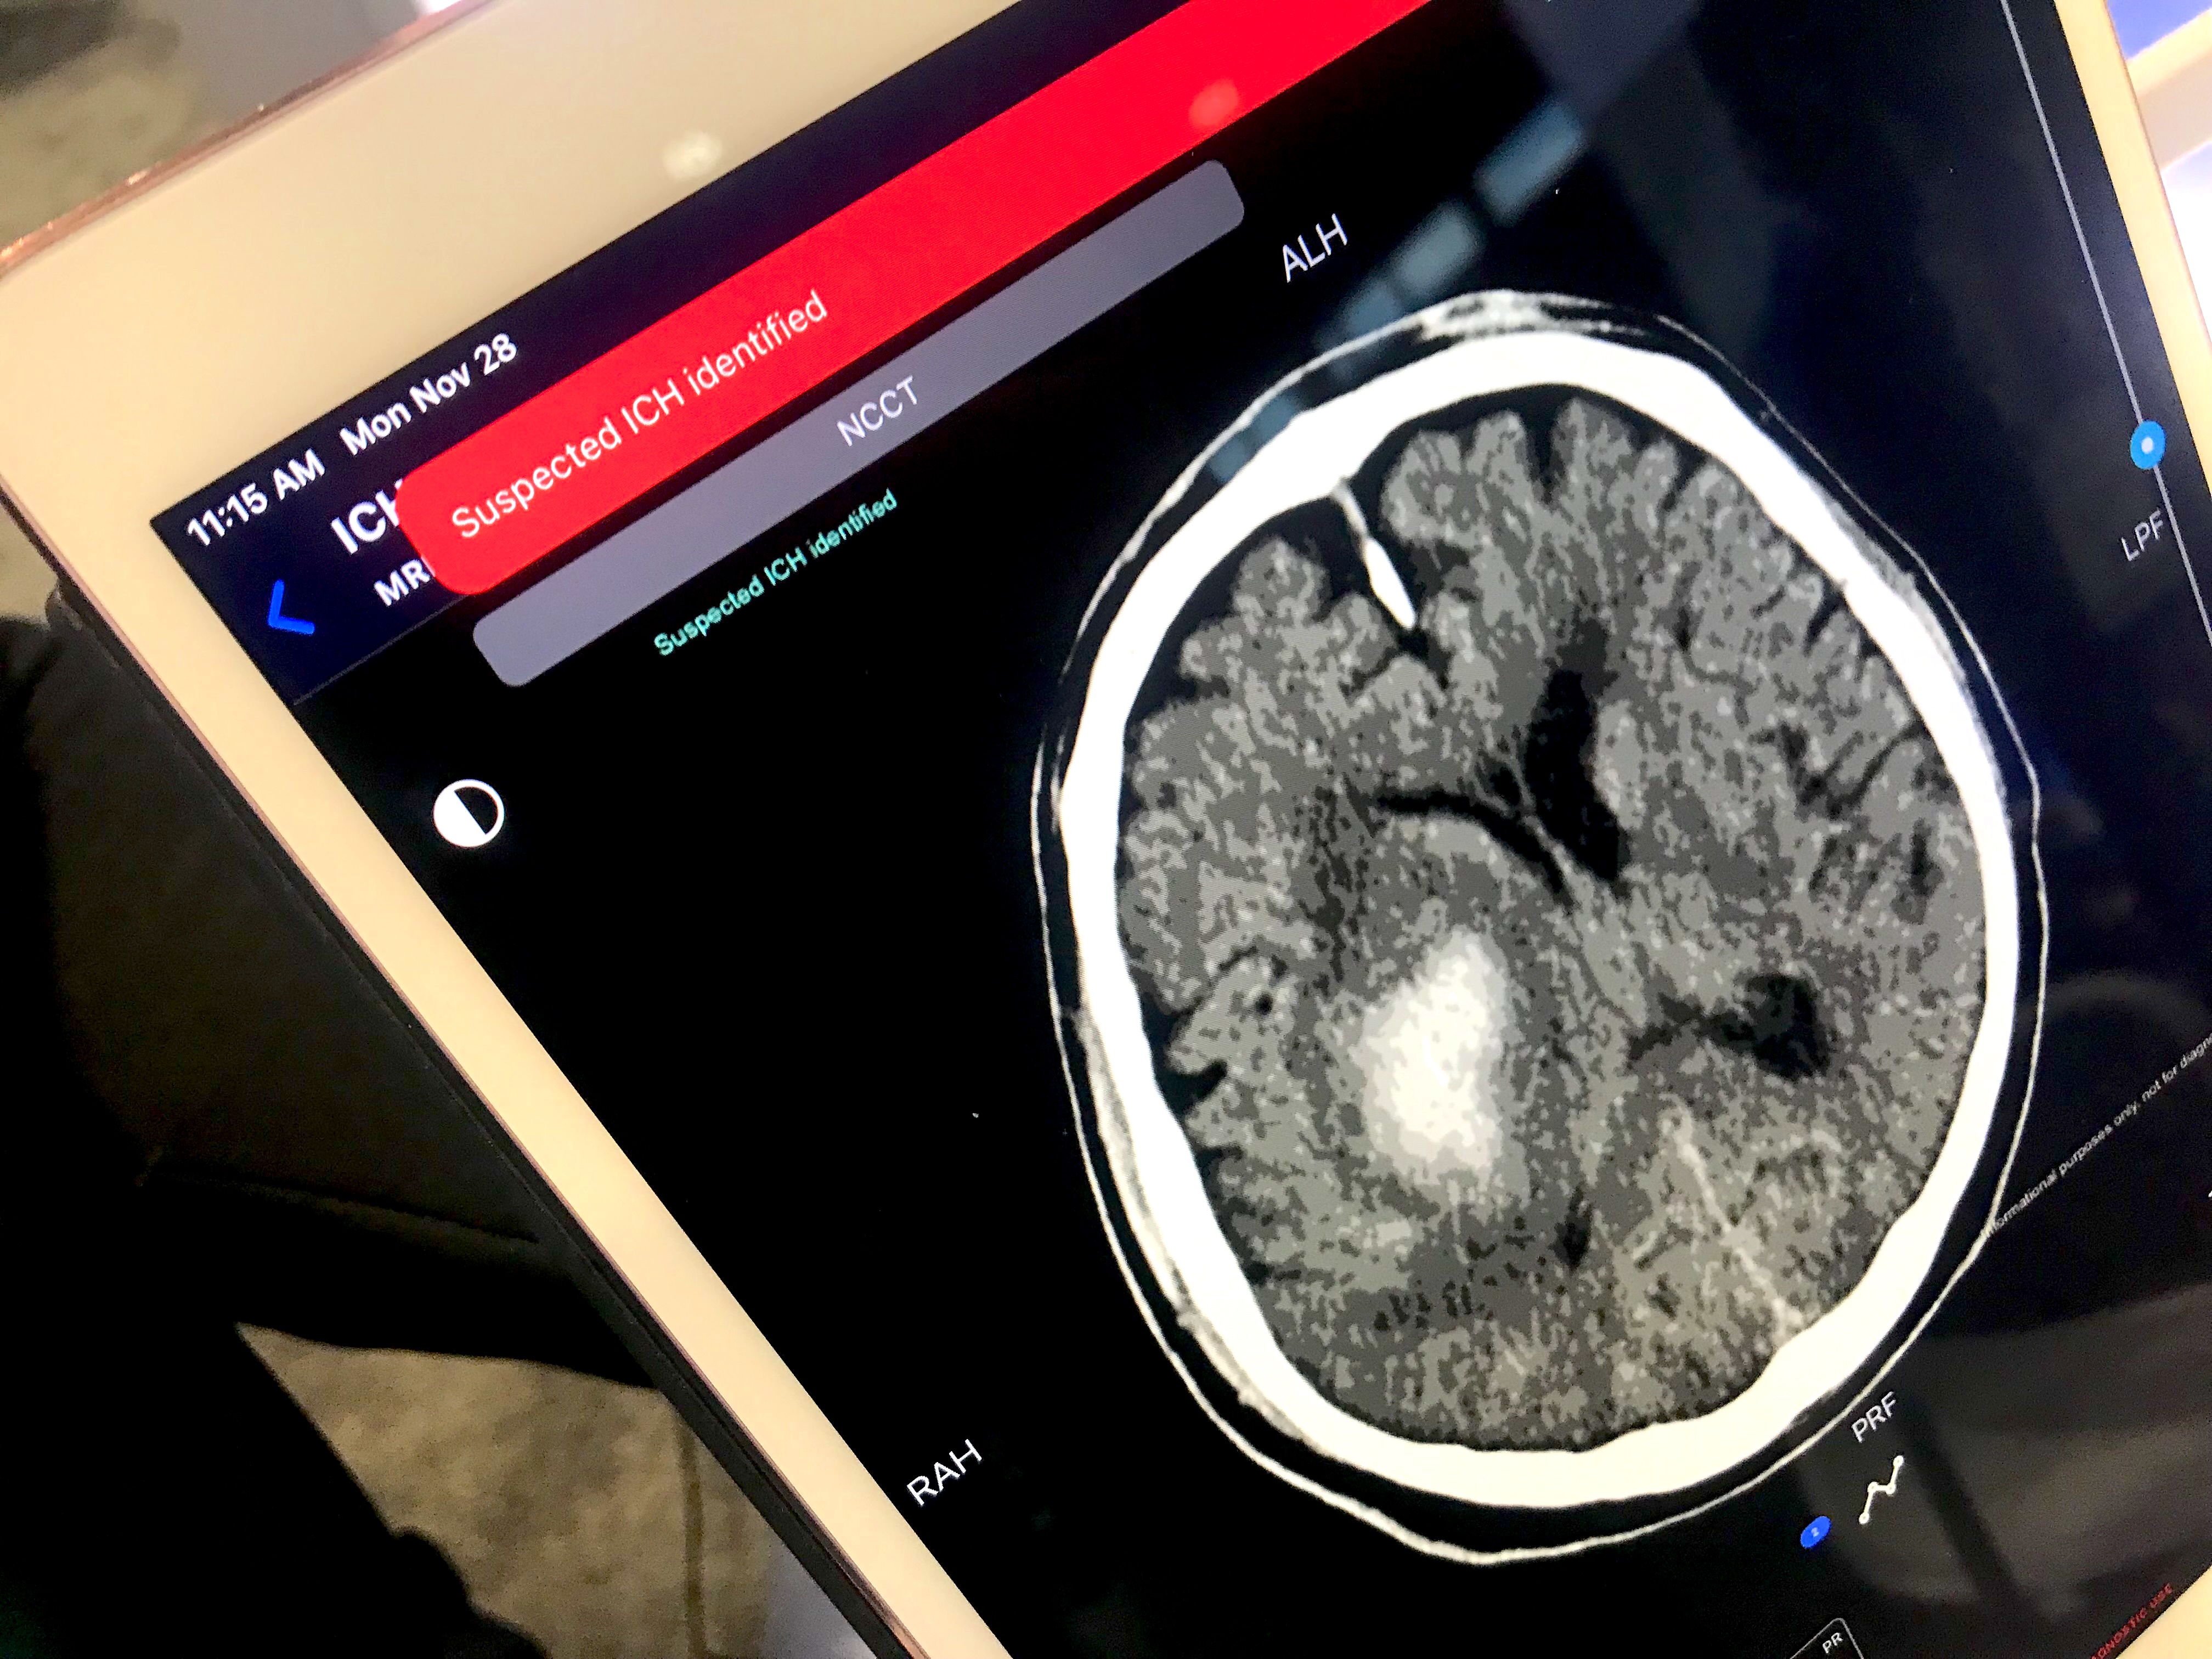
Example of an artificial intelligence (AI) automated notification on an iPad alerting a stroke alert team that a intracranial hemorrhage (ICH) stroke has been detected. These alerts can help speed review by a radiologist and treatment for the patient. This was demonstrated using Terarecon's system at RSNA 2022.

AI detected intracranial hemorrhage (ICH) stroke demonstrated using TR Neuro AI Solution from Terarecon at RSNA 2022.

AI detected intracranial hemorrhage (ICH) stroke detected on a CT scan, demonstrated using TR Neuro AI Solution from Terarecon at RSNA 2022.

Ischemic stroke shown in CT scans. Image courtesy of RSNA.

Ischemic stroke CT scan showing color coded blood flow for early and later arterial and venous contrast phases and areas of blocked blood flow. Image courtesy of RSNA.
Ischemic stroke CT imaging. Images courtesy of RSNA.
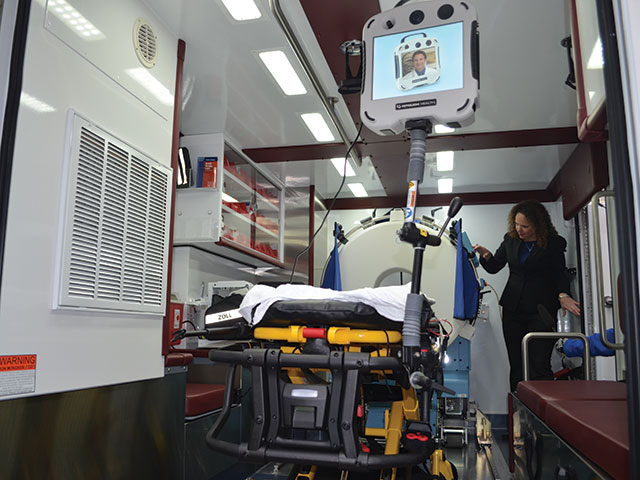
The University of Texas Health Science Center at Houston (UTHealth) Medical School and Memorial Hermann-Texas Medical Center (TMC) have developed an innovative ambulance-based mobile stroke unit. This specialized vehicle is equipped with a compact head CT scanner, allowing for immediate imaging to confirm stroke occurrence and type before patients reach the hospital. This capability facilitates faster door-to-reperfusion or door-to-tPA administration times. Additionally, the unit features a telemedicine system, enabling remote evaluation by neurologists. Read more
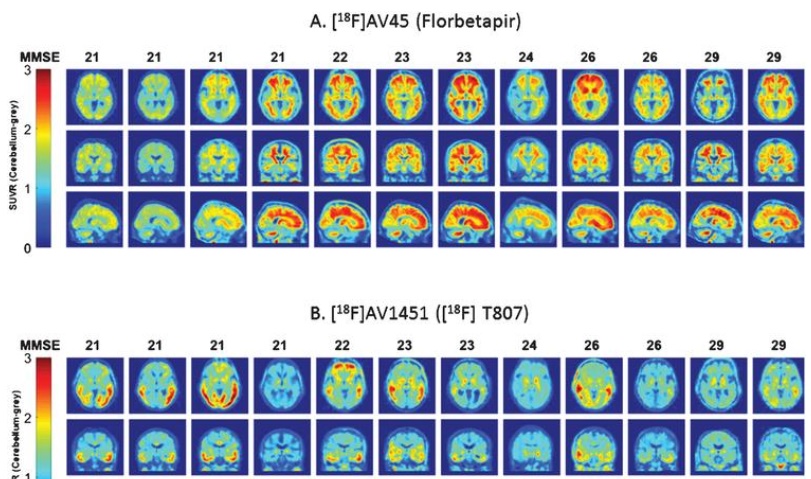
Alzheimer's disease and its cognitive decline are caused by protein deposits in the brain blocking pathways. This PET-CT imaging study conducted at the University of Oxford examines both amyloid beta and tau protein deposits within the brains of Alzheimer's patients. Researchers utilized F-18 florbetapir, marketed as Amyvid, to visualize amyloid beta, and F-18 av1451 to visualize tau. Specifically, entorhinal cortex tau and patient age significantly interacted in terms of cognitive change over six months. The authors suggest that older participants may deteriorate faster despite having lower levels of cortical tau. Cortical amyloid beta was associated with entorhinal cortex tau, while the cerebrospinal fluid tau/amyloid beta ratio correlated strongly with cortical tau but not with amyloid beta. Link to article.
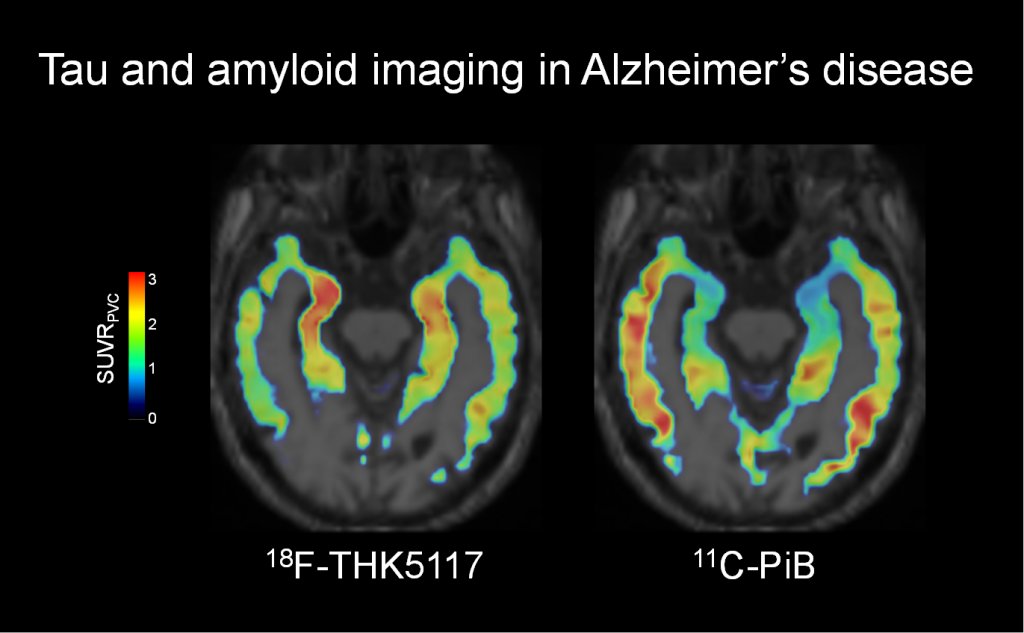
Visualization of the spatial distribution of neurofibrillary tangles in Alzheimer's disease in the brain using F-18 THK-5117 PET and C-11 PiB PET scans. Both radiotracers are highly selective for tau imaging. Alzheimers imaging is more common now than several years ago because drug treatments are now available. Before imaging techniques were developed, the only definitive diagnosis of Alzheimer's was from brain biopsies.
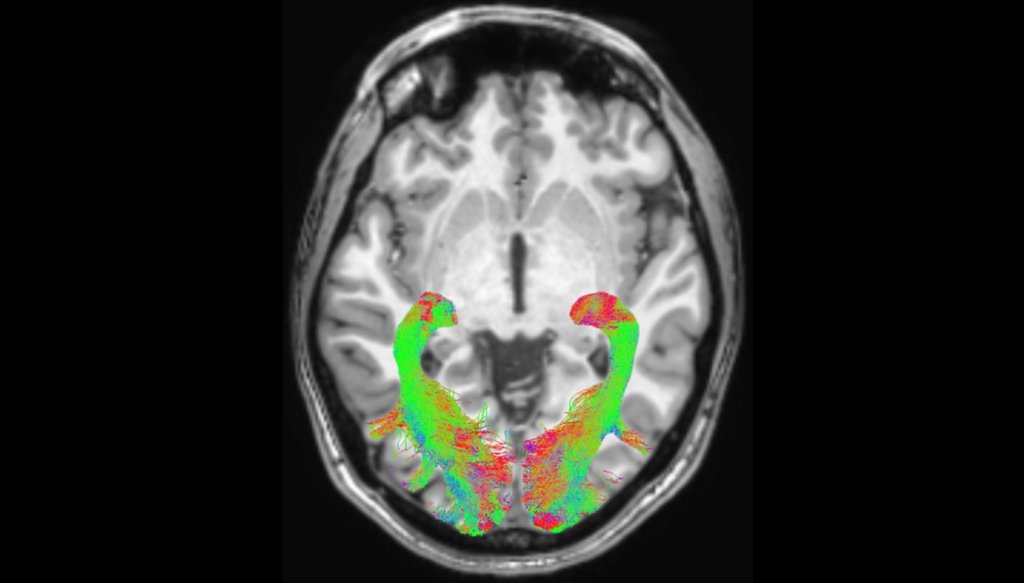
In patients diagnosed with Parkinson's disease, diffusion-weighted intensity magnetic resonance imaging (DWI-MRI) can be used to image to assess white matter changes and voxel-based morphometry (VBM) to investigate concentration changes of brain’s gray and white matter. This image is of MRI tractography, showing direction of signals in the brain. Researchers found significant abnormalities in these patterns within the visual system brain structures of Parkinson’s disease patients compared to normal patients. Image courtesy of the RSNA

Temporal lobe epilepsy, hippocampal sclerosis, and white matter abnormalities in anterior temporal lobe of a 21-year-old woman with temporal lobe epilepsy and anterior temporal lobe epilepsy and anterior temporal lobe white matter abnormalities. Coronal T2-weighted images show blurring at gray-white matter junction and white matter volume loss and increased signal intensity (arrow, C) in anterior left temporal lobe. Image courtesy of the American Journal of Roentgenology (AJR)

Example of Parkinson's disease progression in different portions of the brain over the course of time using serial 18F-FDG PET nuclear imaging scans. The images shows progressive metabolic reduction from the baseline (Year 0), through stages of mild cognitive impairment (Years 2 and 4), and clinical diagnosis of dementia (Year 5). Progressive metabolic reductions in cuneus and precuneus occur before less severe, but more widespread, cortical reductions. Image from SNMMI

Example of epilepsy MRI in a 21-year-old man with a cortical migrational abnormality. This axial, T1-weighted magnetization-prepared rapid acquisition GRE image shows symmetric band (arrows) of abnormal heterotopic subcortical gray matter signal intensity. Image courtesy of the American Journal of Roentgenology (AJR)

Epilepsy seen in MRI post-processing to show the epileptogenic zone (EZ) location. Focal epilepsy is a common and severe neurologic disorder and neuroimaging aims to identify the EZ. For about a third of patients with chronic drug-resistant focal epilepsy, the EZ cannot be precisely identified using standard 3.0-T MRI. Computational image processing can aid radiologic assessments and increase the success rate of uncovering suspicious regions by enhancing their visual conspicuity. Image courtesy of RSNA
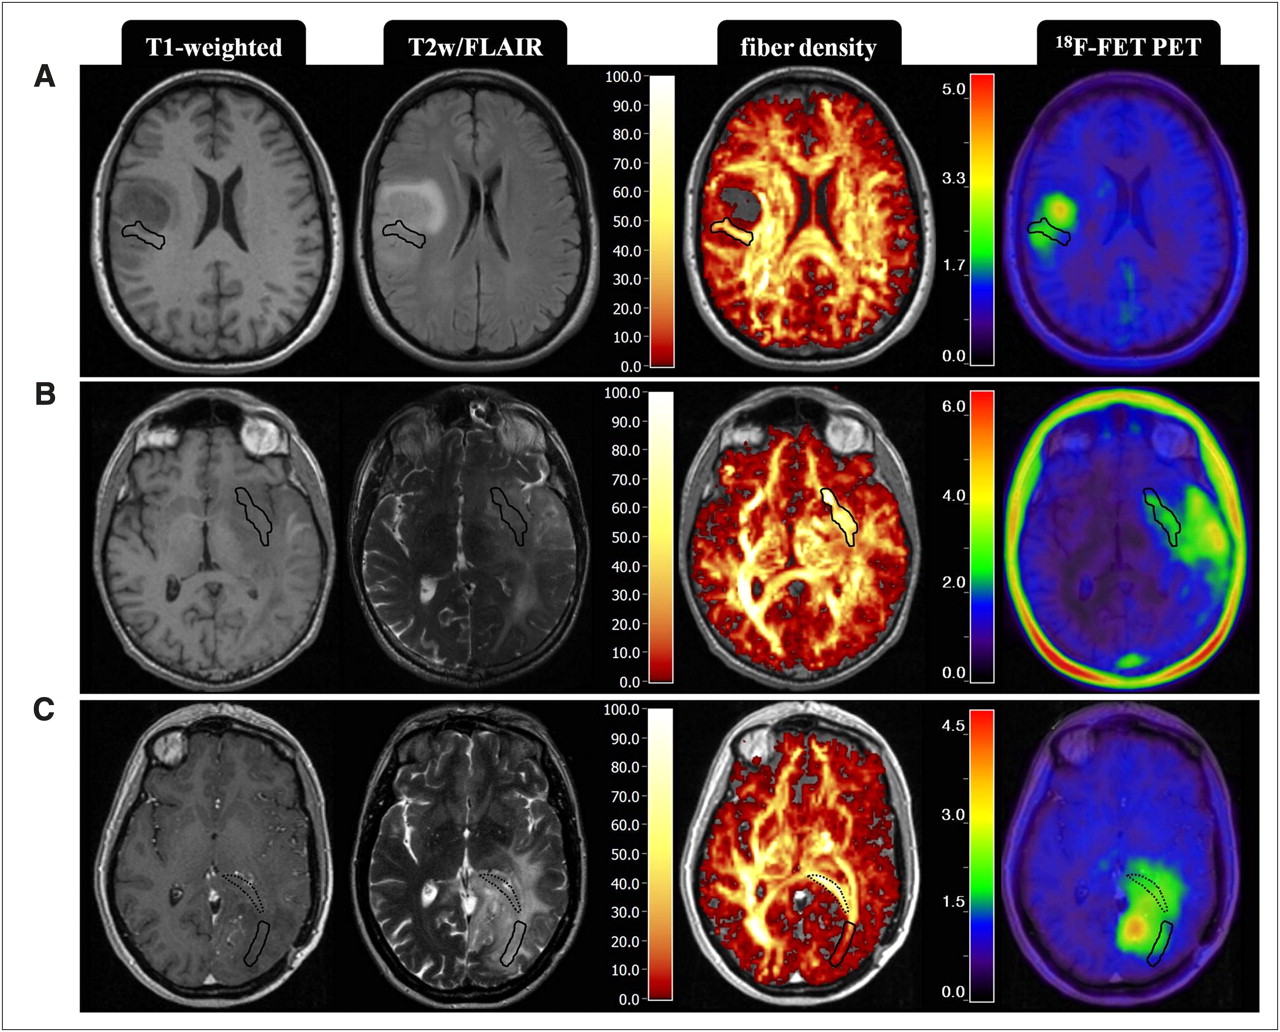
Example brain cancer visualized on a PET-MRI imaging. Magnetic resonance imaging offers excellent soft tissue detail and resolution, which the positron emission tomography (PET) nuclear imaging scan shows the high metabolic activity of the cancer in bright color. These features make it easier to differentiate benign tumors from cancer and to have detailed information on position and size of a tumor and if there are any metastases. Image from SNMMI.

The postnatal CT image obtained in the 22-day-old neonate with zika virus showing punctate calcifications at the gray matter–white matter junction and asymmetrical ventriculomegaly. Ventriculomegaly is a condition where a fetus's ventricles (fluid-filled spaced in the brain) are larger than usual. This can to hydrocephalus, an abnormal buildup of cerebrospinal fluid in the ventricles, causing them to widen and putting harmful pressure on the brain tissue. Image courtesy of RSNA
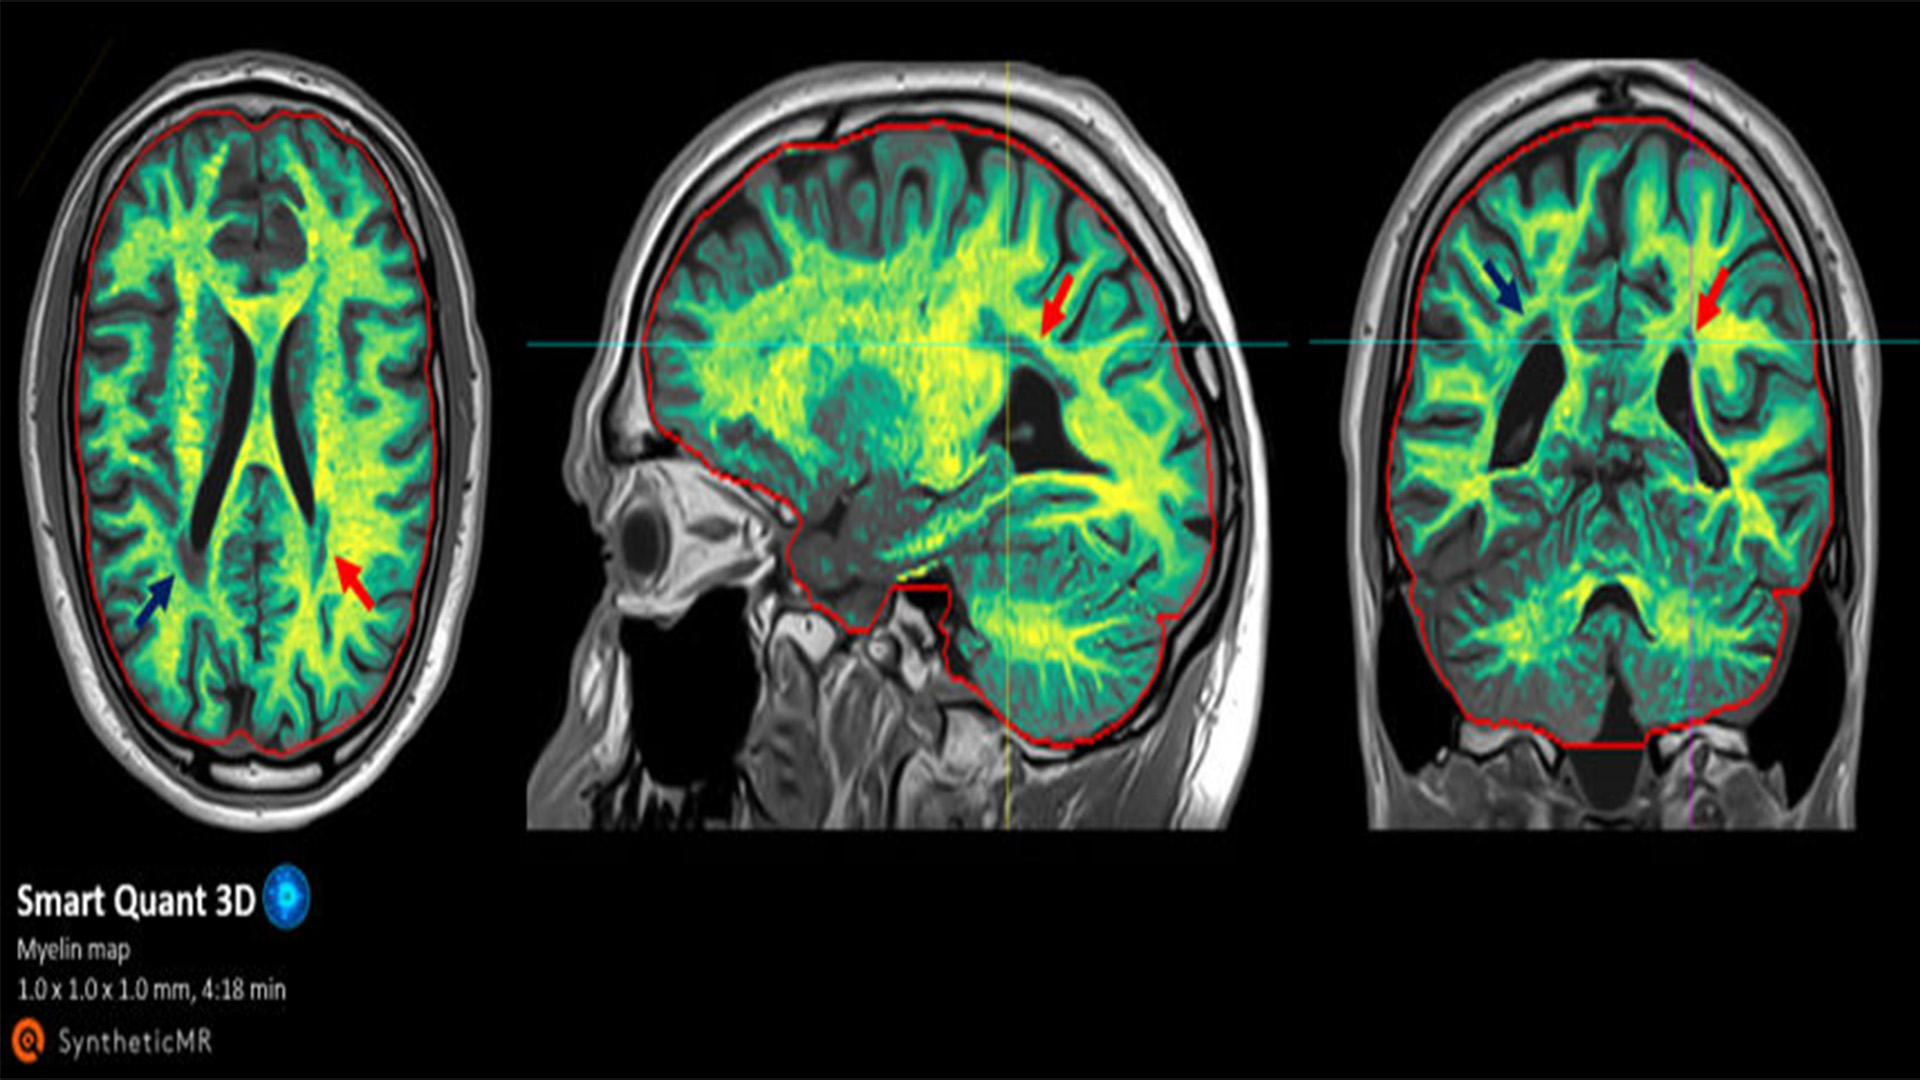
Example of Philips Smart Quant Neuro 3D quantitative tissue assessment software. It reconstructs the MRI image to provide automatic and precise 3D segmentation and volume measurement of brain tissue, a breakdown of white matter, gray matter, cerebrospinal fluid, and myelin to give providers more information to make a more accurate diagnosis. This image shows the myelin sheath of nerves in a patient's brain, and a reduction caused by demyelinating diseases like Guillain–Barré syndrome, leukodystrophy, Charcot–Marie–Tooth disease, and several other types of myelinosis, which results in nerve damage. Philips image from ECR 2024.
Related MRI Content:

Dave Fornell has covered healthcare for more than 17 years, with a focus in cardiology and radiology. Fornell is a 5-time winner of a Jesse H. Neal Award, the most prestigious editorial honors in the field of specialized journalism. The wins included best technical content, best use of social media and best COVID-19 coverage. Fornell was also a three-time Neal finalist for best range of work by a single author. He produces more than 100 editorial videos each year, most of them interviews with key opinion leaders in medicine. He also writes technical articles, covers key trends, conducts video hospital site visits, and is very involved with social media. E-mail: dfornell@innovatehealthcare.com