
PHOTO GALLERY: What does breast cancer look like on mammography
This image gallery shows examples of what various breast imaging modalities look like and some of the typical findings on mammograms. The breast imaging photos includes examples of 2D mammography, 3D mammography tomosynthesis, breast MRI, breast ultrasound, molecular breast imaging, breast density, microcalcifications, architectural distortion and COVID-19 vaccine lymphadenopathy. For patients, this gallery can offer information on what doctors look for on mammograms and what breast cancer can look like on imaging.
Hover over images to see the captions. You also can click on images to enlarge them.
Sagittal breast MRI showing computer-aided volumetry images of a 31-year-old woman with an invasive ductal carcinoma. The two images show a partial response to chemotherapy. Pre-chemotherapy maximal intensity projection (MIP) image from contrast-enhanced MRI shows a 4.9-cm round mass. Post-chemotherapy MIP image from contrast-enhanced MRI shows a 1.7 cm irregular mass, a reduction from the initial tumor diameter. The colored computer-aided volumetry images show 94% volume reduction, from 26.5 cm3 to 1.6 cm3. Read more. RSNA image.
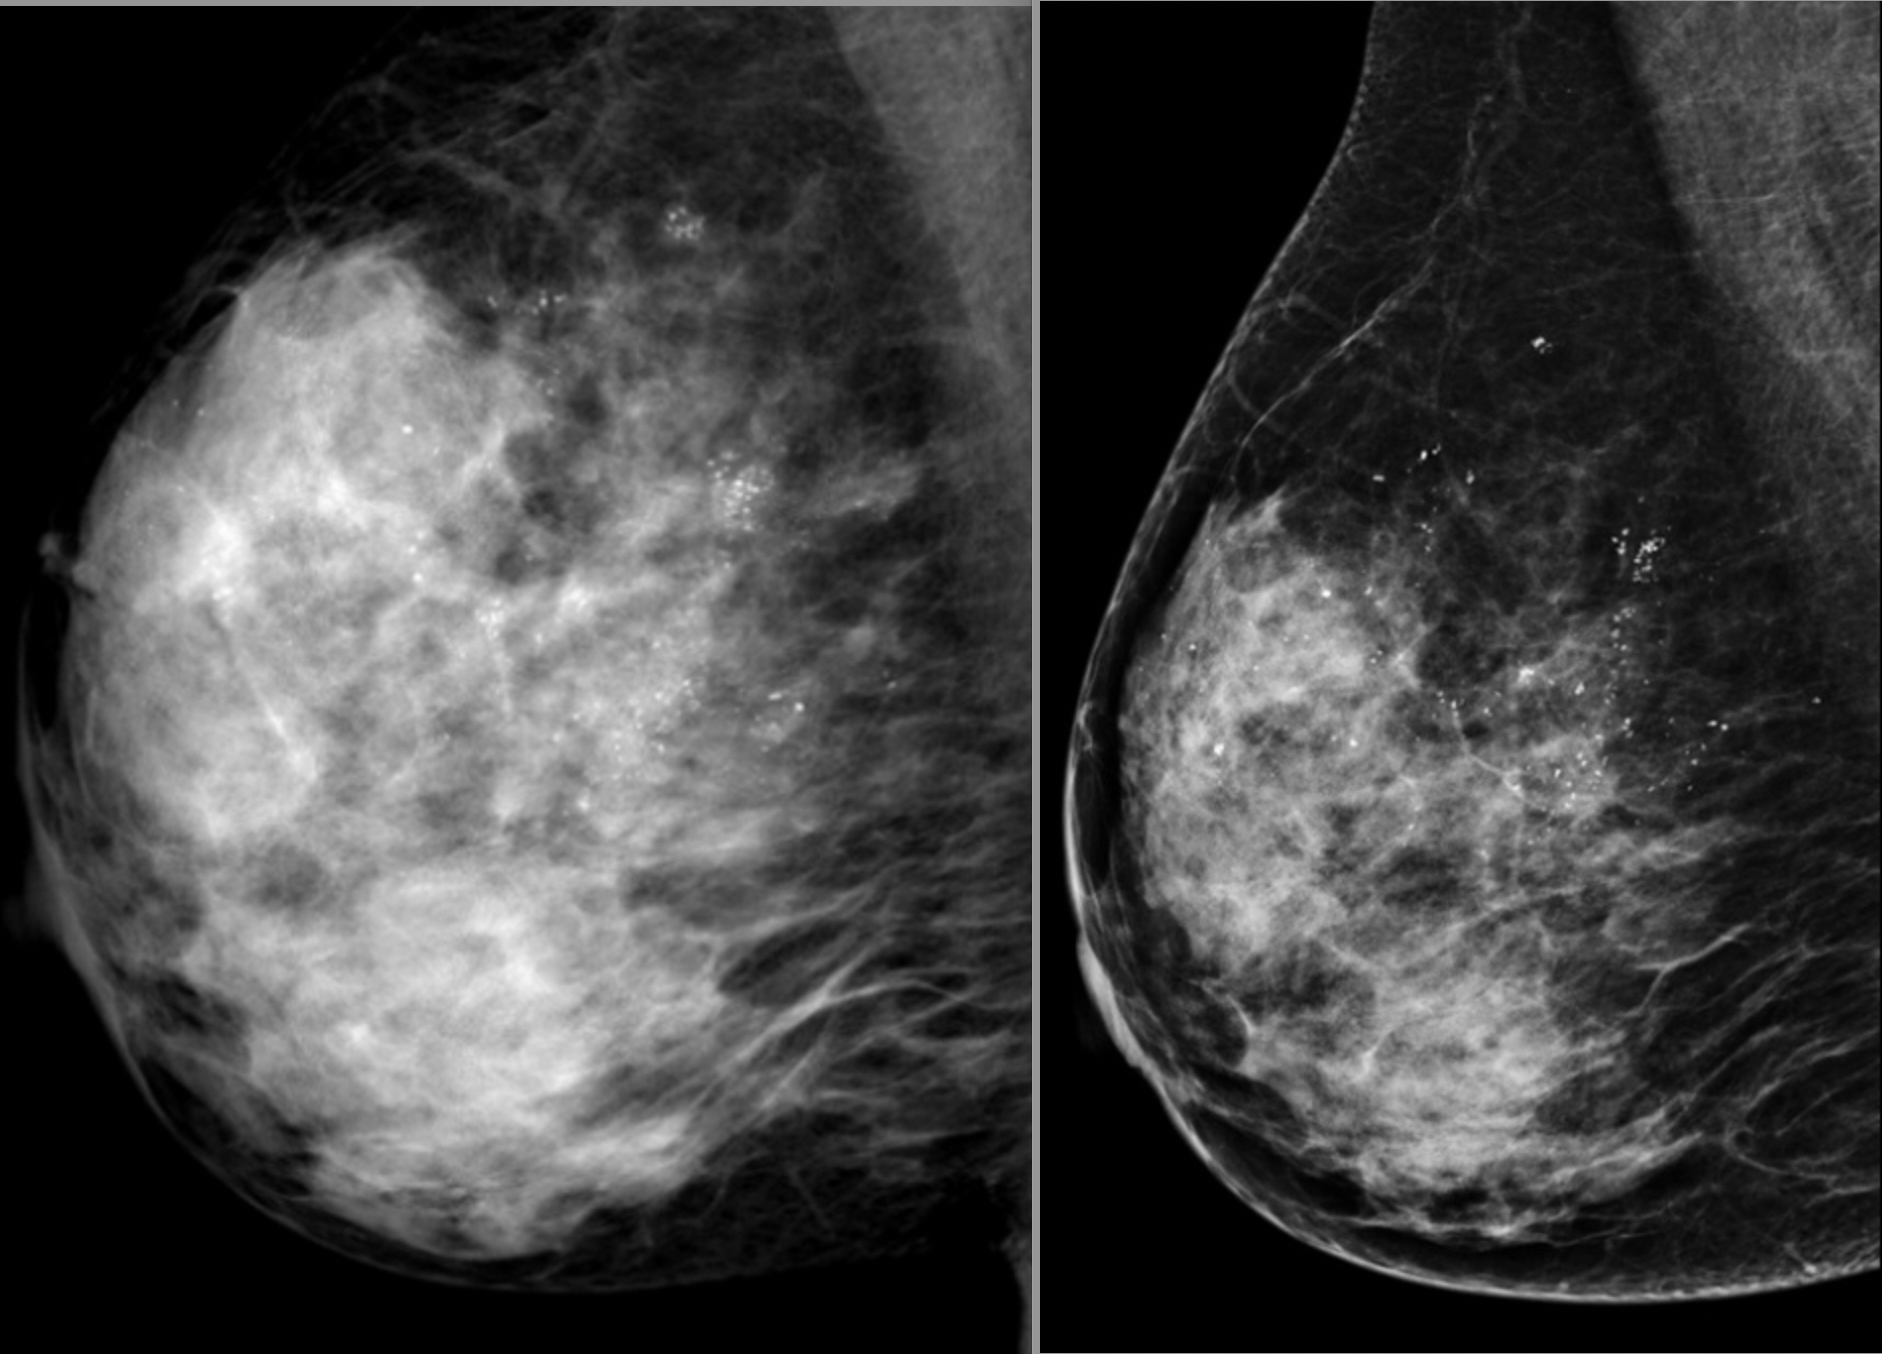
A comparison of standard 2D mammography (right) and digital breast tomosynthesis (DBT), or 3D mammography (left). The DBT creates a data set of 1 mm slices that the radiologist can look through to see more detail in suspect areas and determine if dense breast tissue is masking a tumor. Image from UCSF.
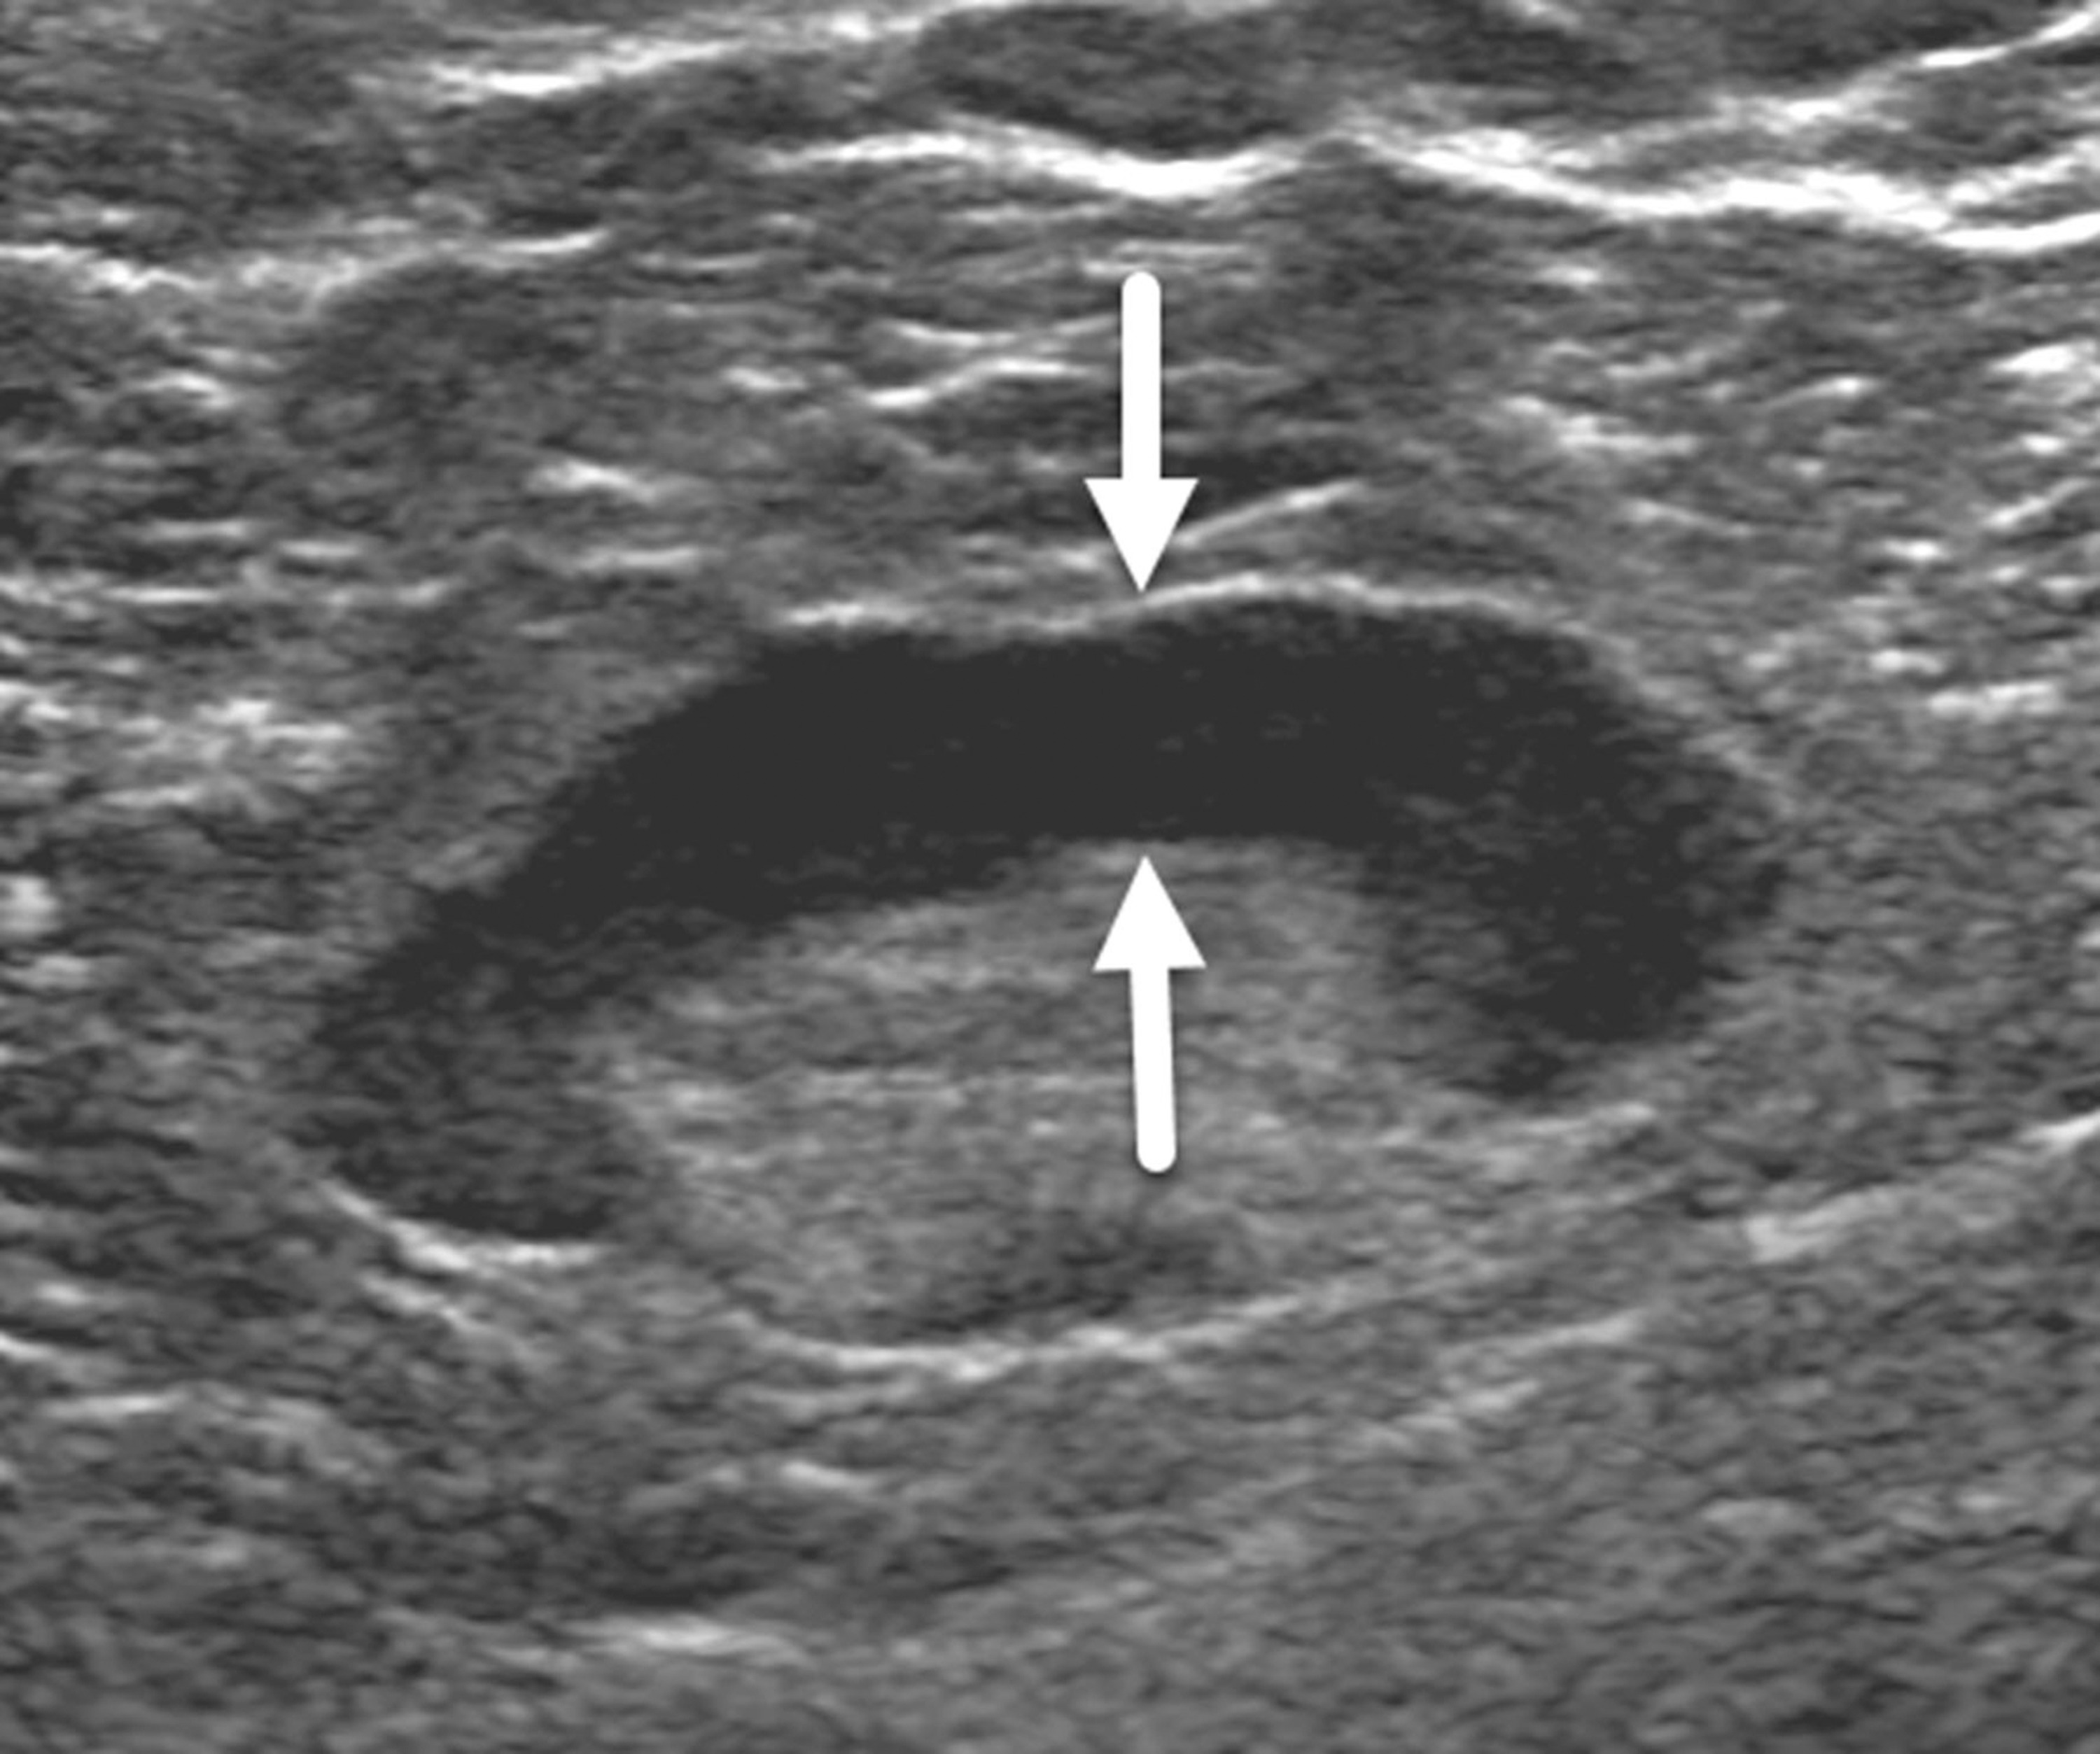
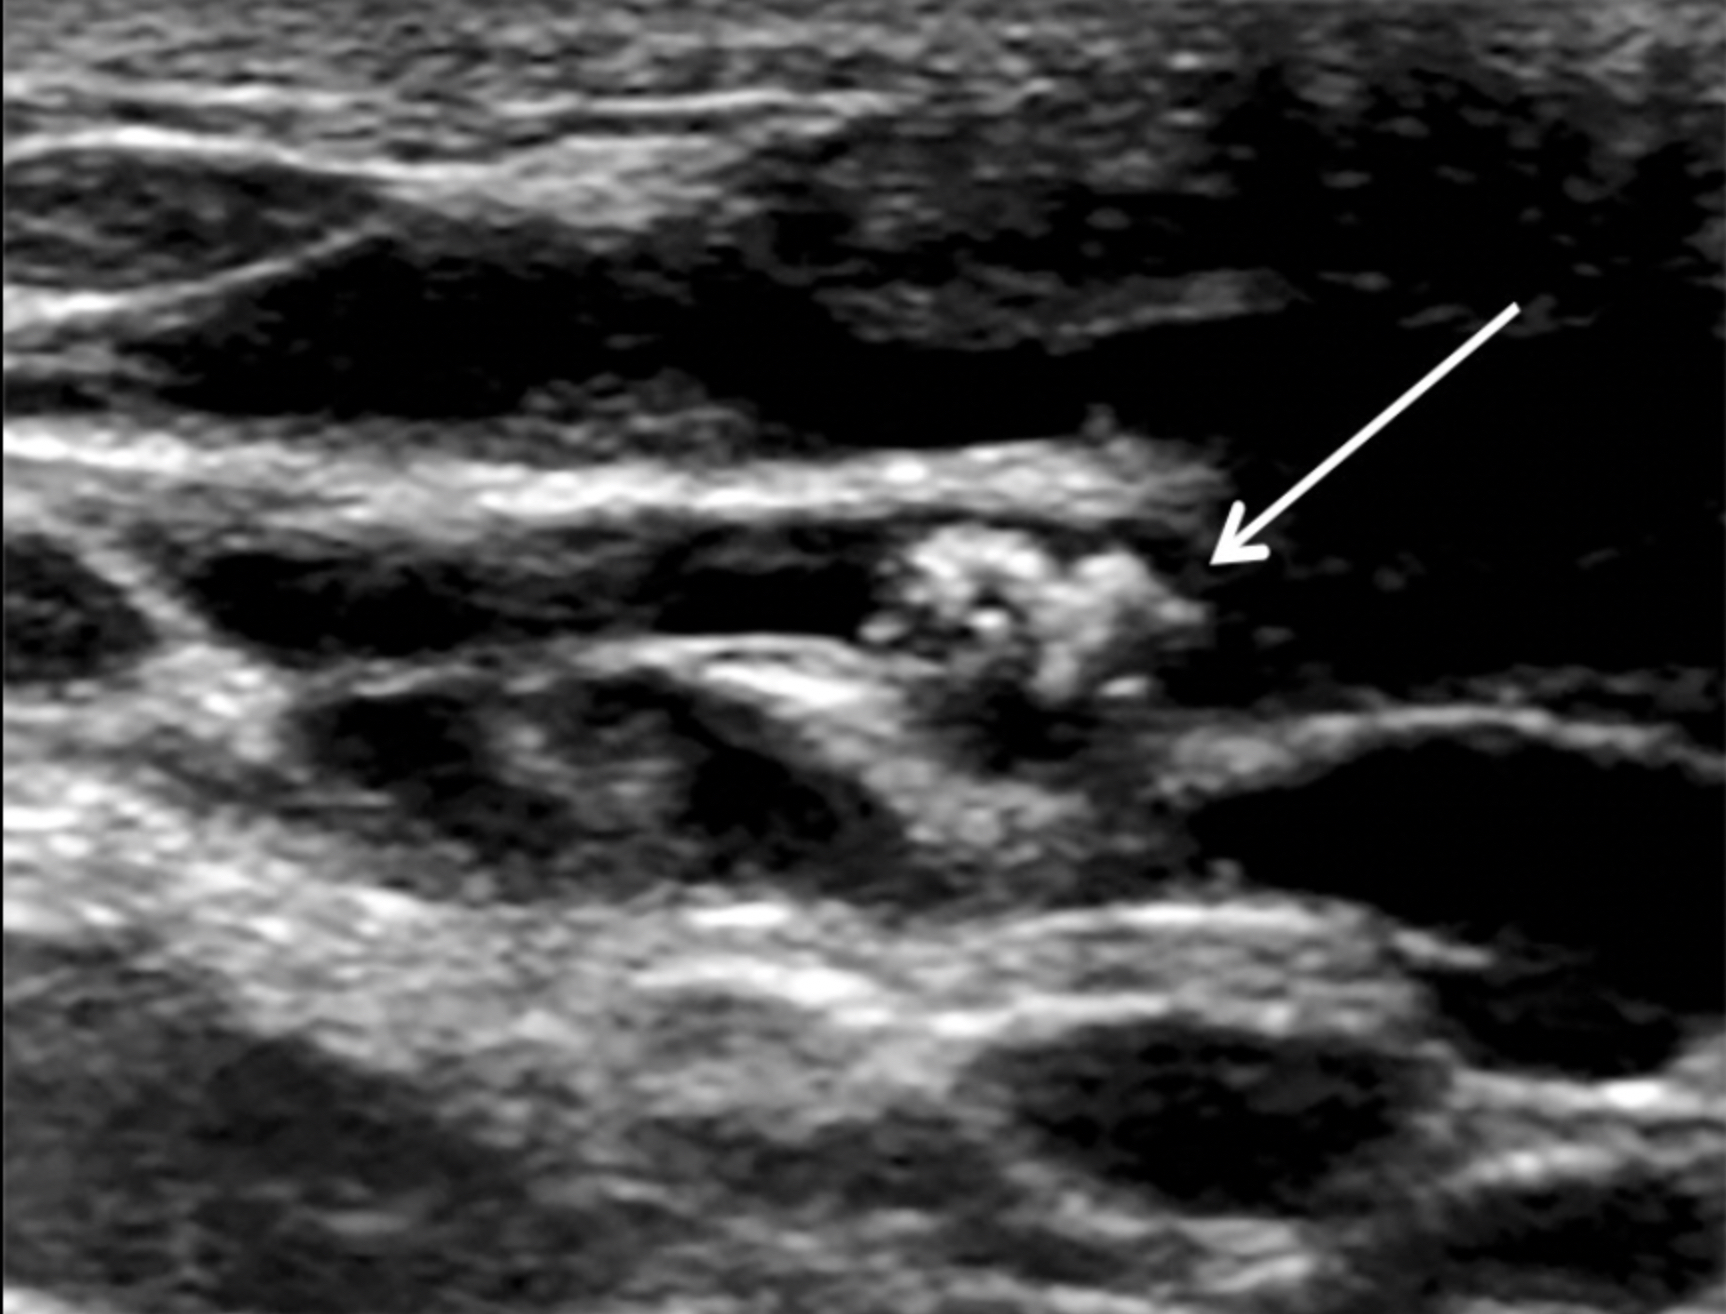
Breast ultrasound of a 62-year-old woman with benign reactive adenopathy after COVID-19 vaccination. The vaccine can cause a natural immune response reaction in the lymph nodes near the injection site that can last on average 1-10 weeks but is benign. However, it can mimic a breast cancer response and may raise alarm on the exams of recently vaccinated or boosted patients. Image from Academic Radiology.
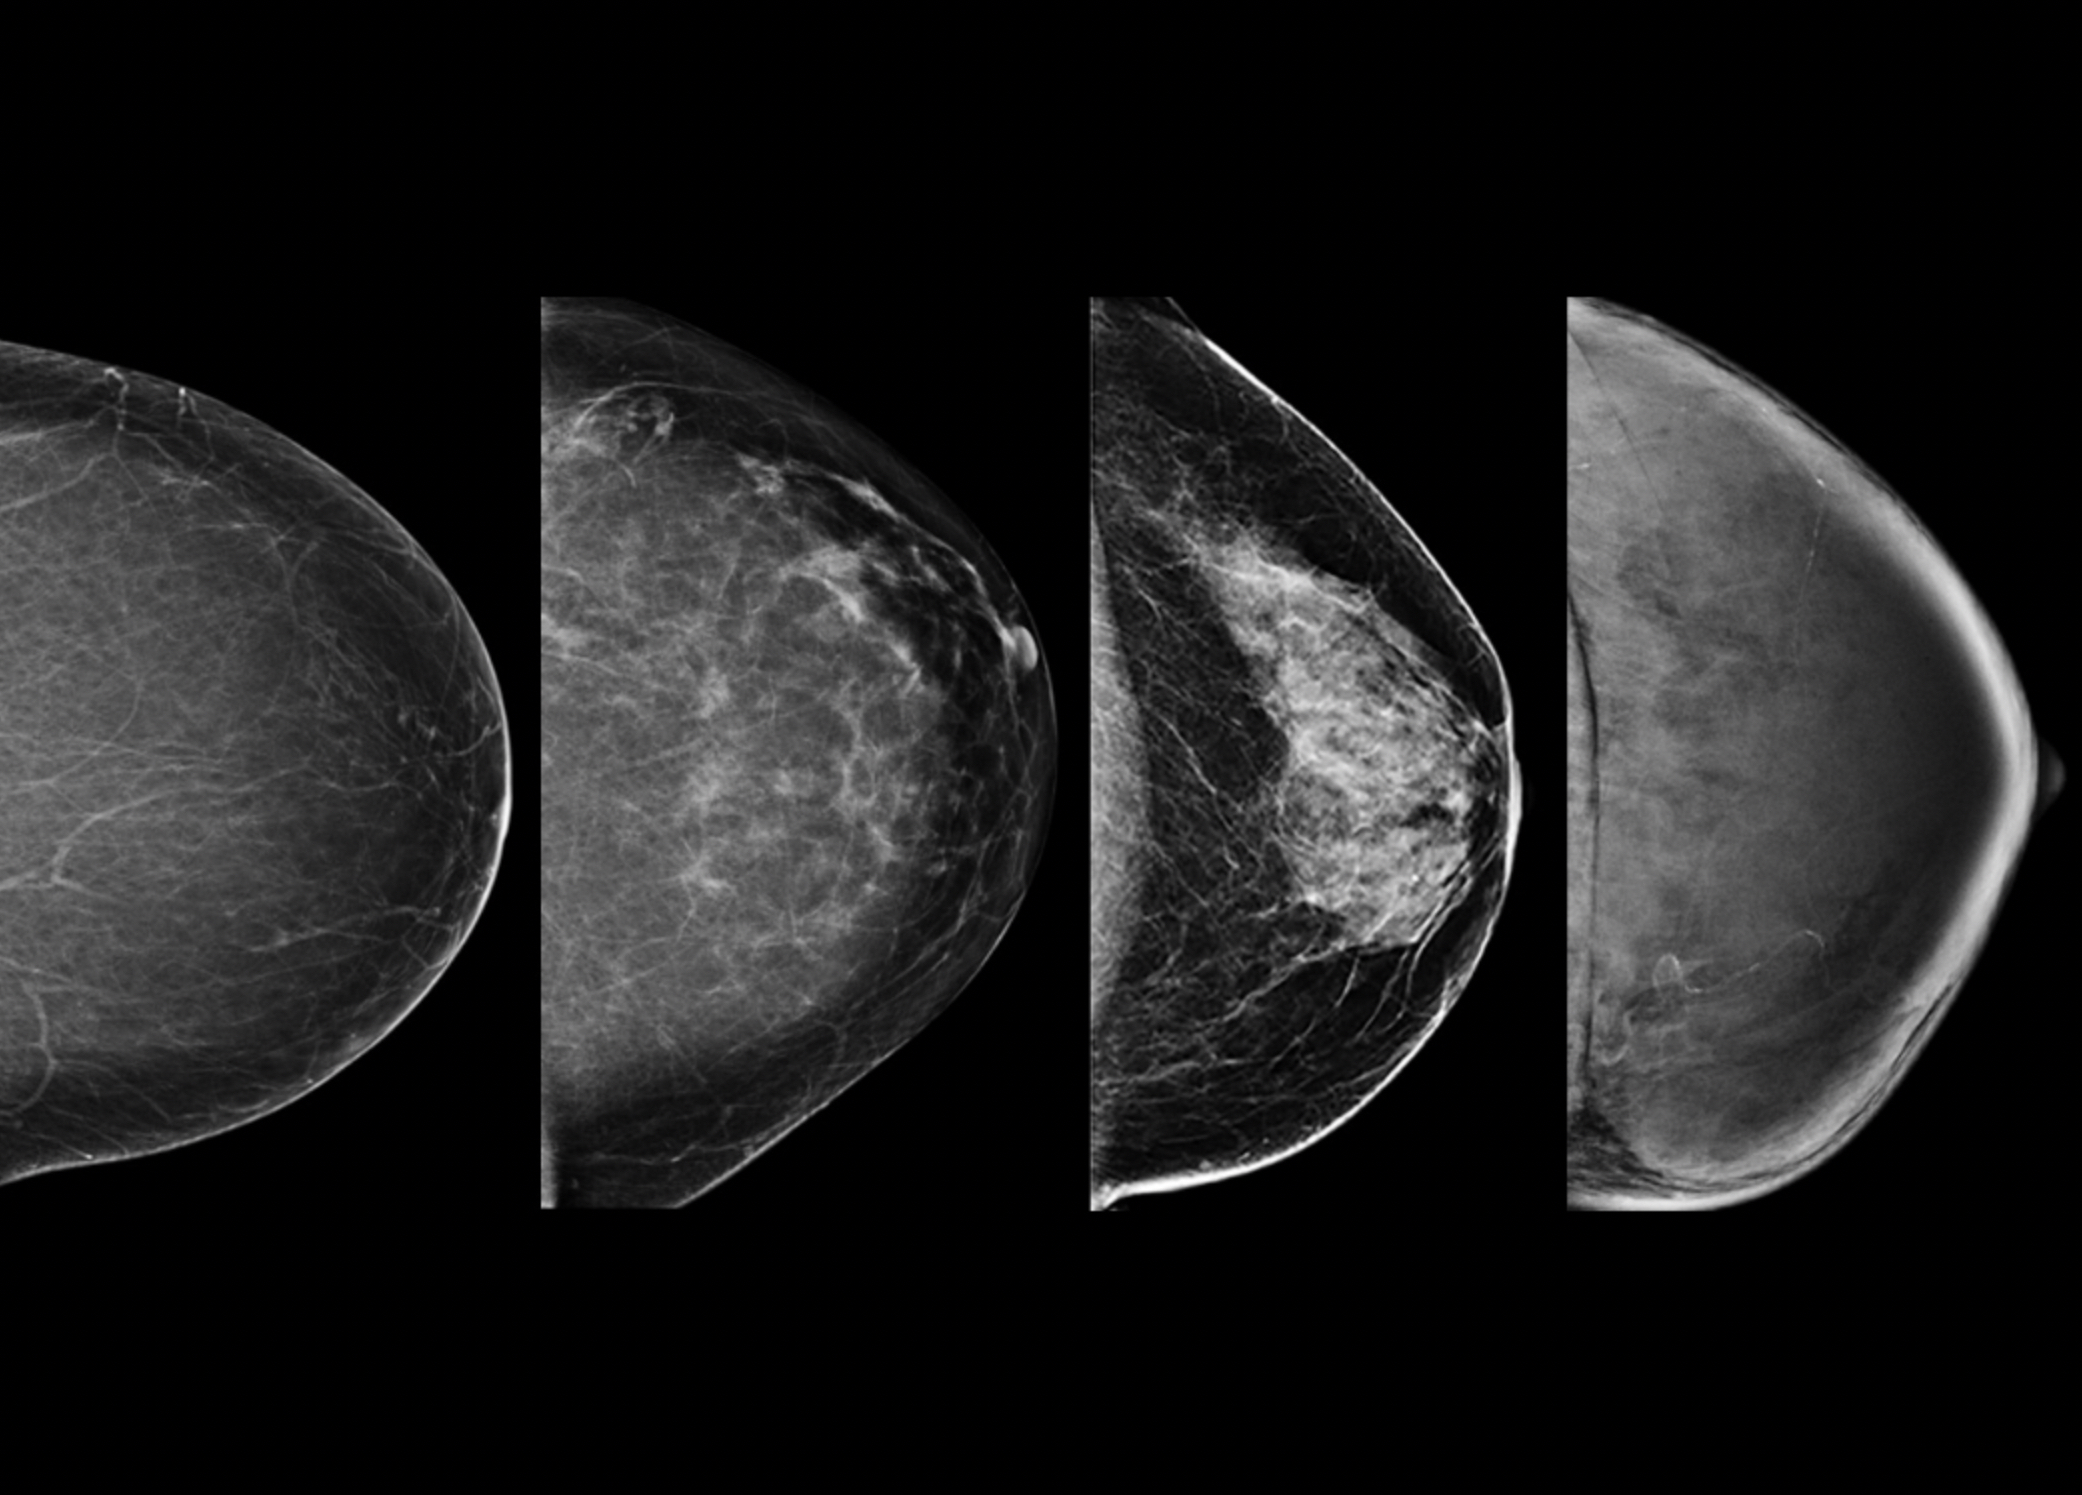
Example of the four types of breast tissue density. The density of fibroglandular tissue inside the breast impacts the ability to easily see cancers. On 2D mammography, cancer and dense breast tissue both appear as white and can hide smaller cancers. Dense breasts are also a risk factor for cancer. Cancers are very easy to spot in fatty breasts, but are almost impossible to find in extremely dense breasts. These examples show craniocaudal mammogram findings characterized as almost entirely fatty (far left), scattered areas of fibroglandular density (second from left), heterogeneously dense (second from right), and extremely dense (far right). Read more. Image courtesy of RSNA.
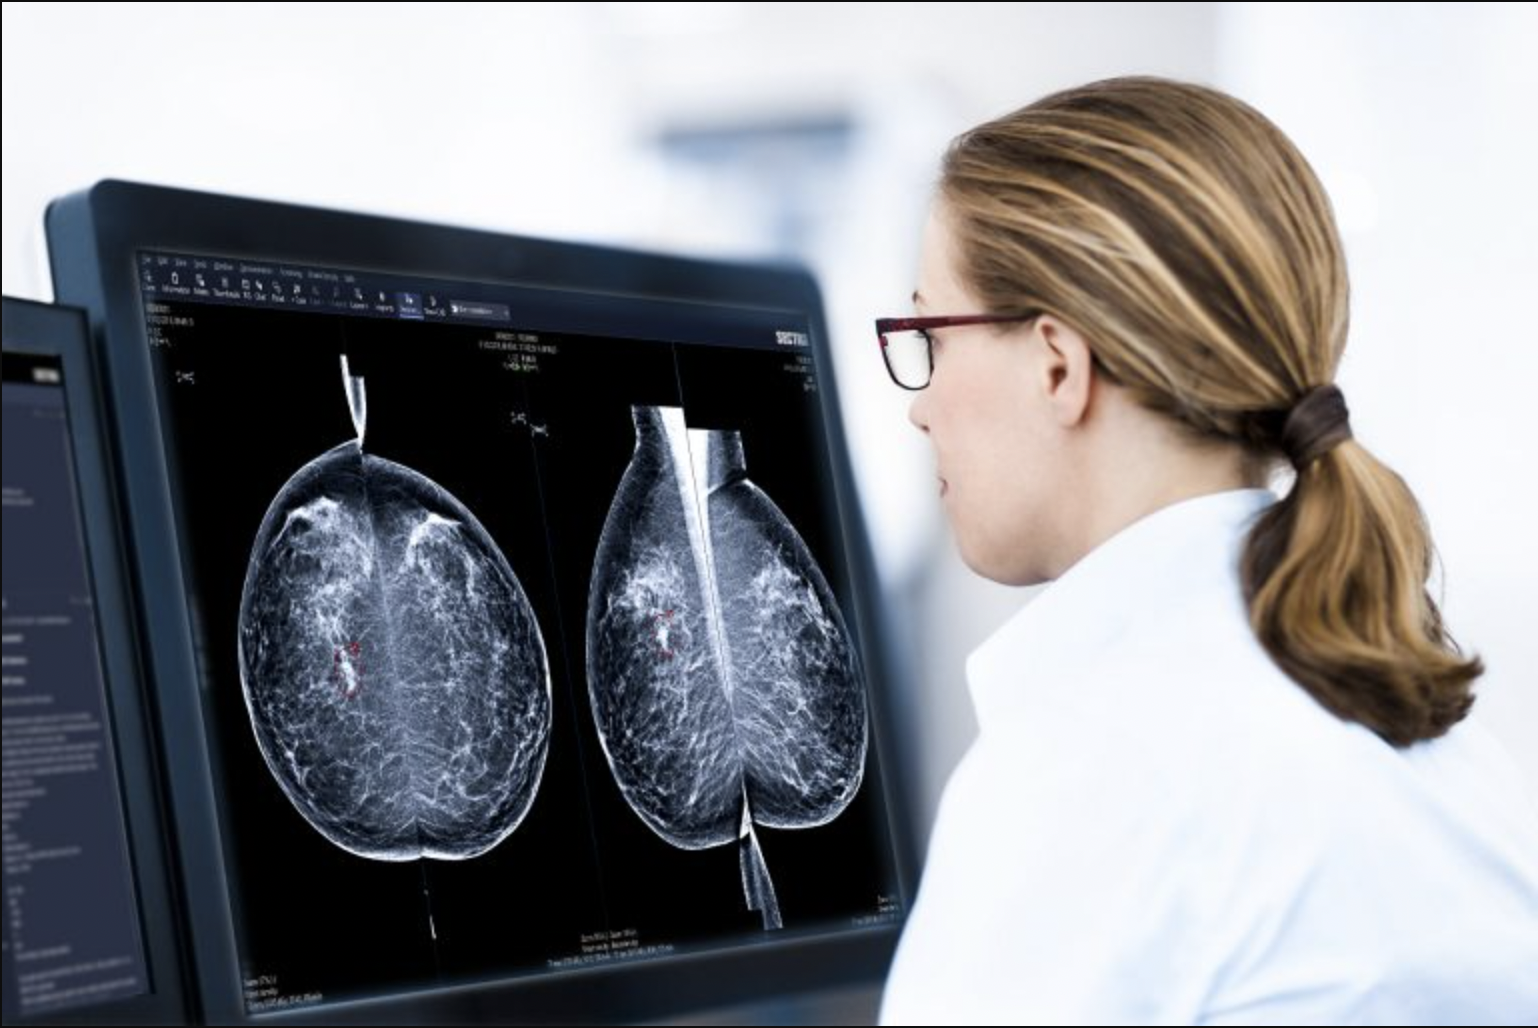
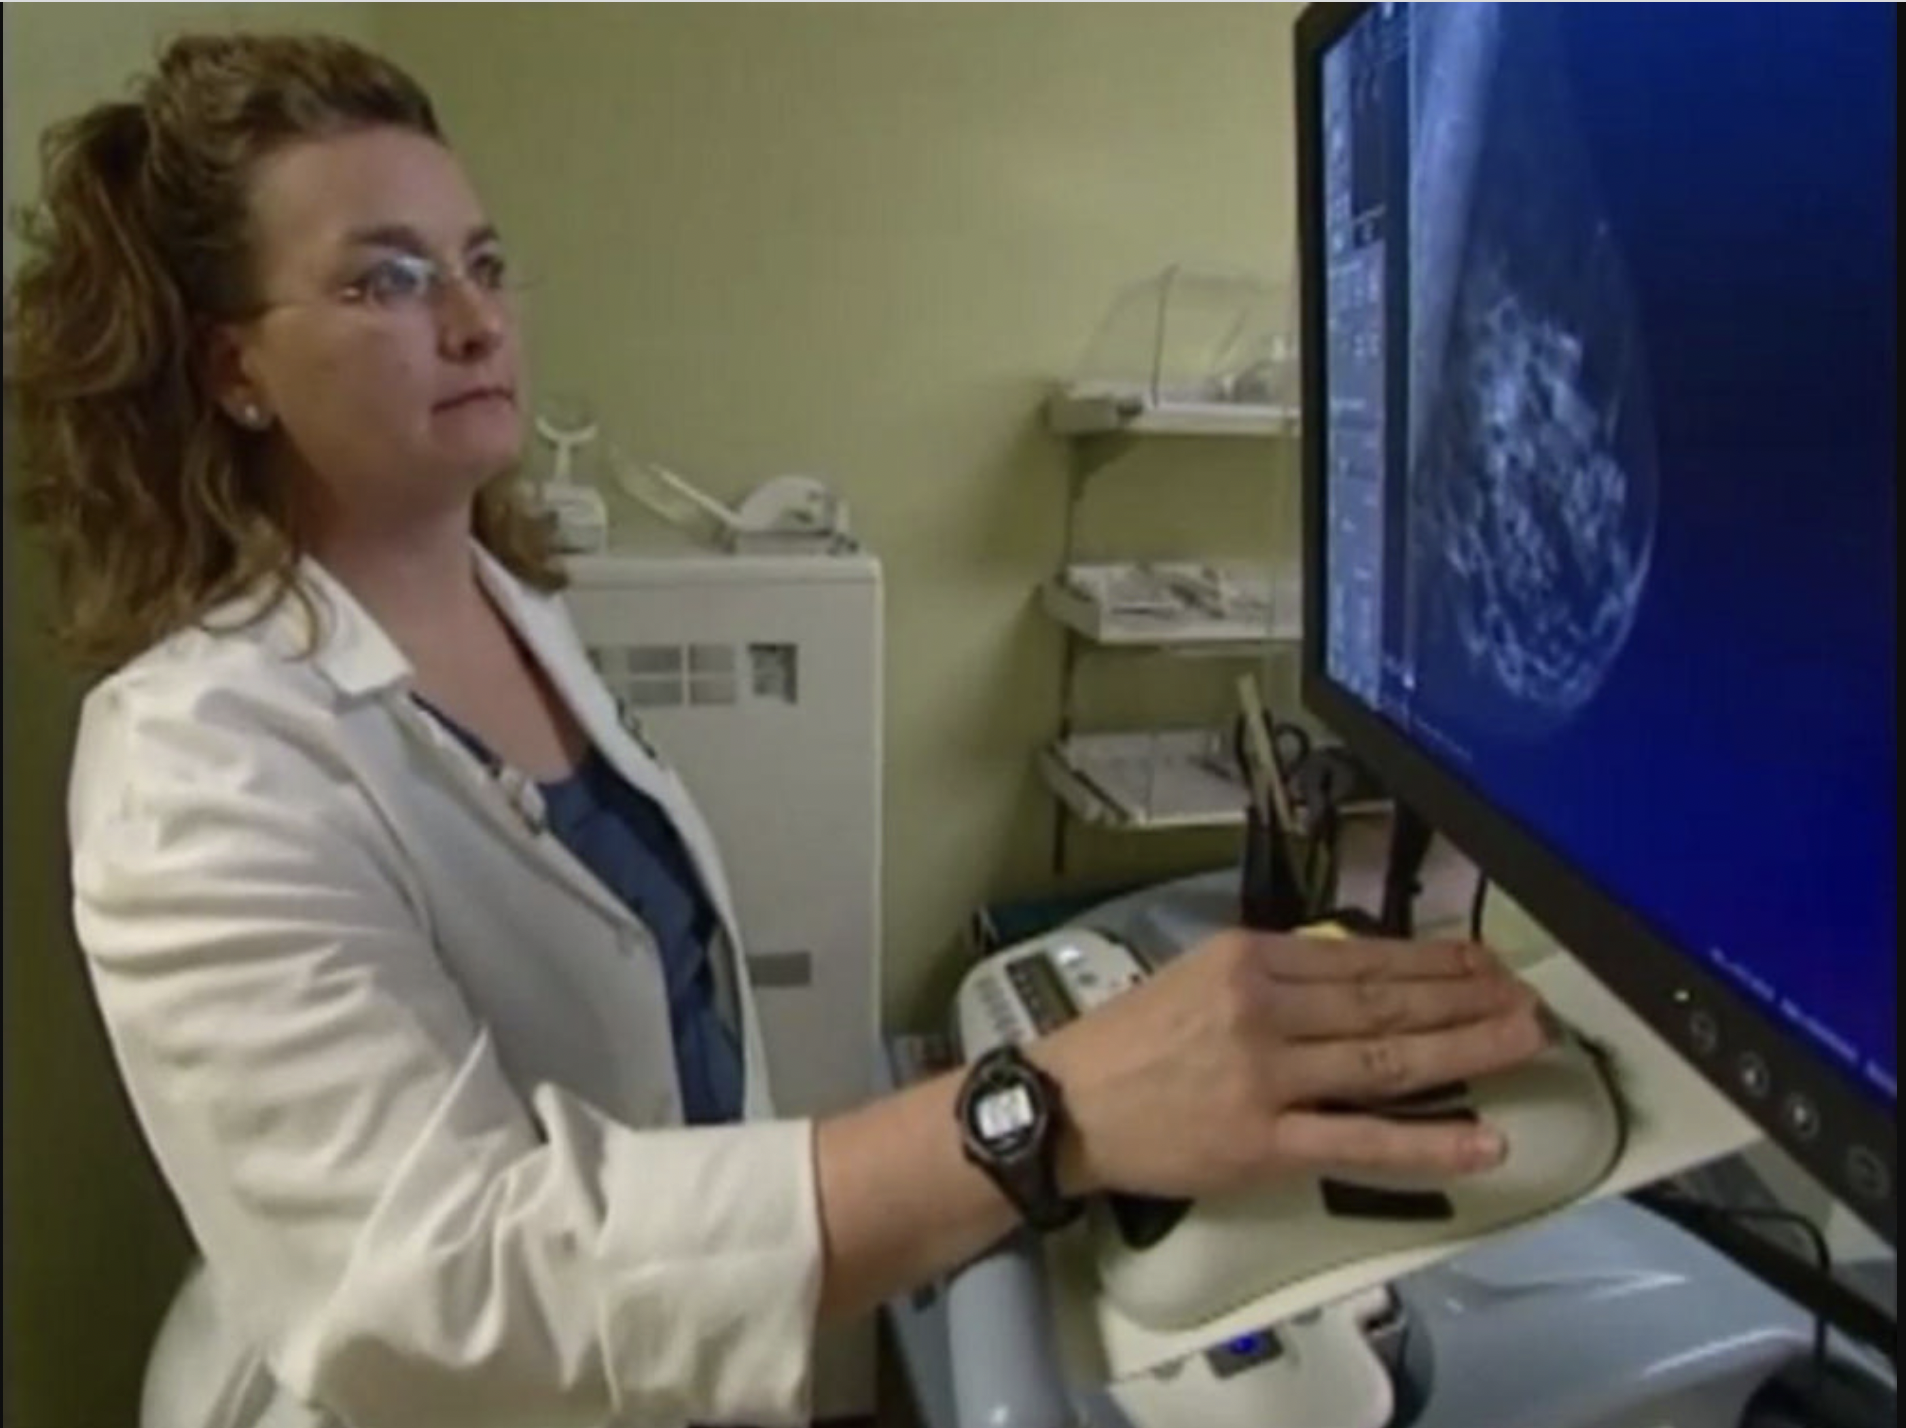
Radiologist reading a mammogram exam. Two different views of of the breast are taken and the images of the left and right breast are placed side by side for comparison. A woman's breasts are generally symmetrical, so the side-by-side comparison helps with a quick comparison to pick out anomalies that might be cancer. Image courtesy of Sectra.
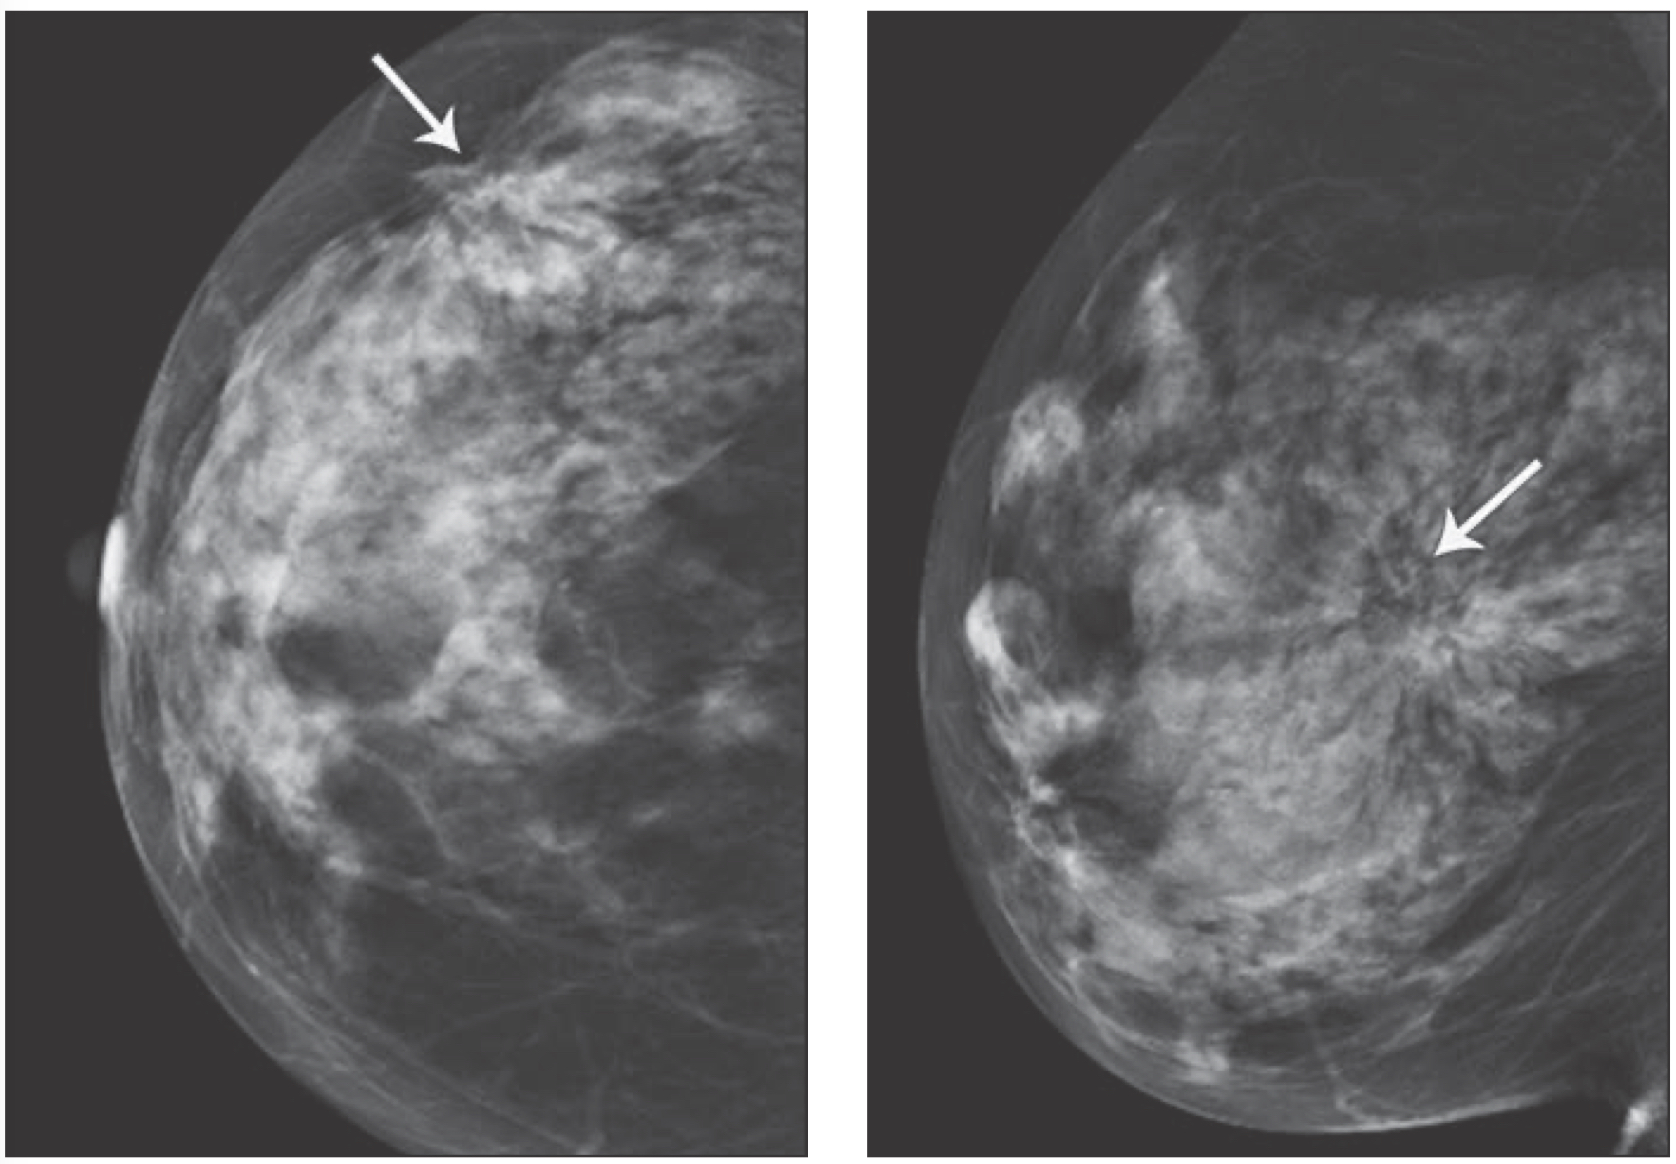
Example of breast architectural distortion seen in a 67-year-old woman who presented for screening mammography. Surgical pathology revealed invasive ductal adenocarcinoma. Image from AJR. Read more in the article When does worrisome architectural distortion signal malignancy on mammography?
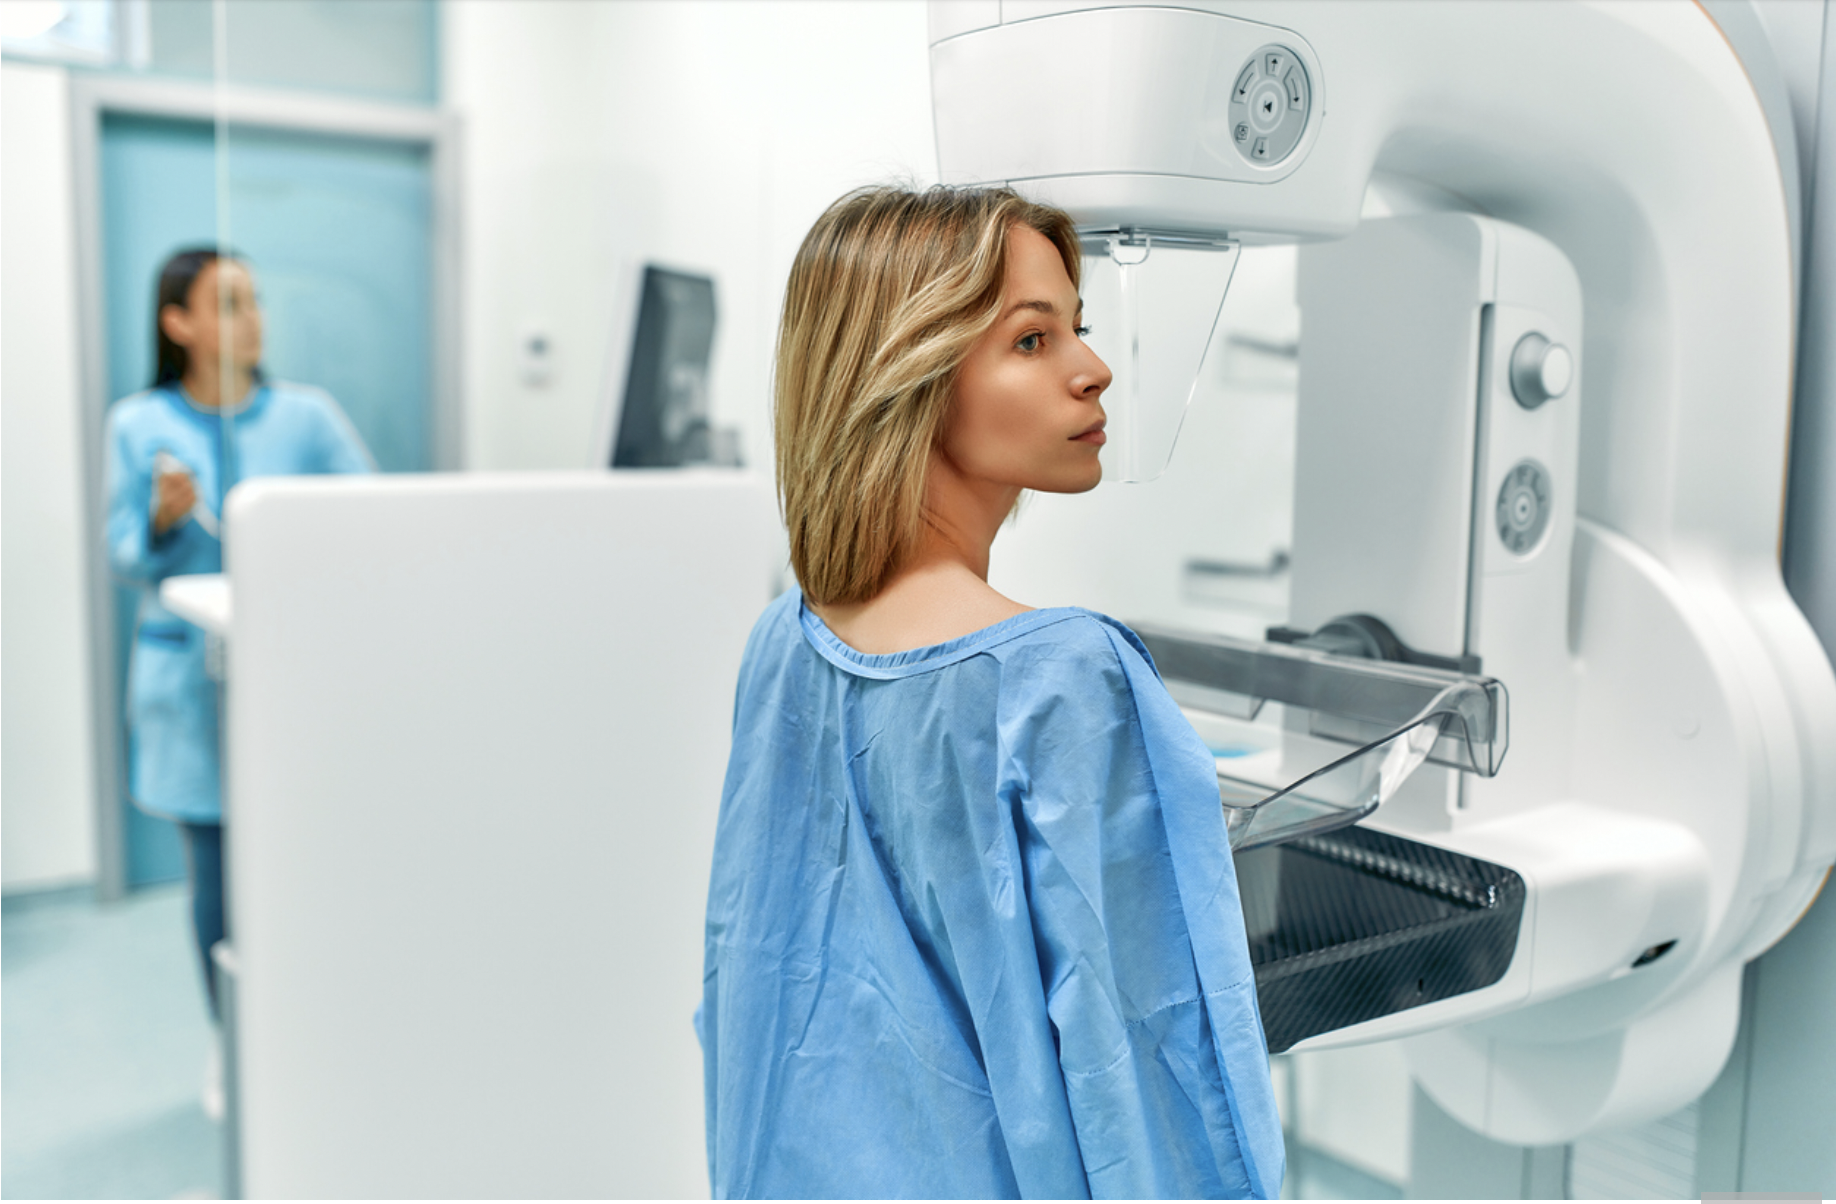
Example of a typical mammography imaging suite during a breast screening exam. The patient has their breast compressed by the clear plastic part of the mammography system. The compression is necessary to get diagnostic grade images. It also helps with getting consistent images, which is important because new exams are compared to prior exams to help identify any changes in the breast that may be due to cancer. The black base below the breast is the X-ray detector. The head mounted on an arm above the patient is the X-ray source. It rotates to get different views of the breast. The technologist is at the control console for the mammography system across the room and is protected from the X-rays by a leaded glass shield.
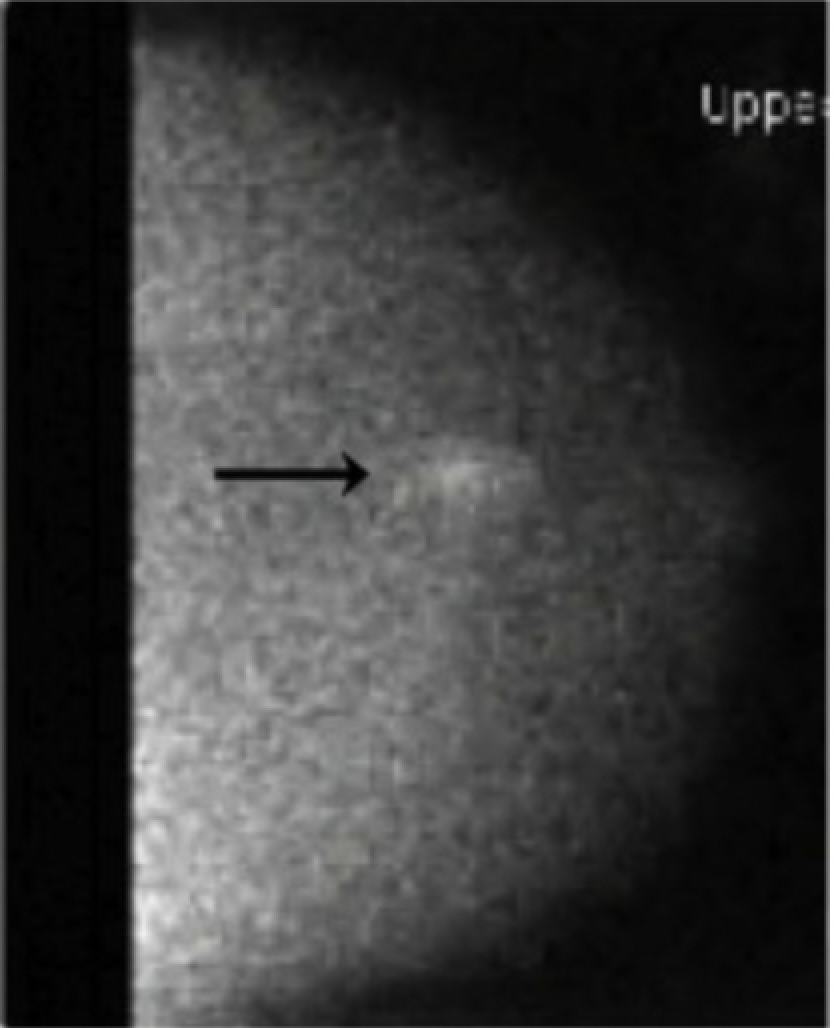
An example of a molecular breast imaging (MBI) exam showing radiotracer uptake in the breast forming a bright spot. Cancer cells have a higher metabolism than healthy tissue, so there is more uptake of the tracer. The advantage of the technology is it can see through dense breast tissue and determine if a mass is cancerous or benign. Image from Mayo Clinic
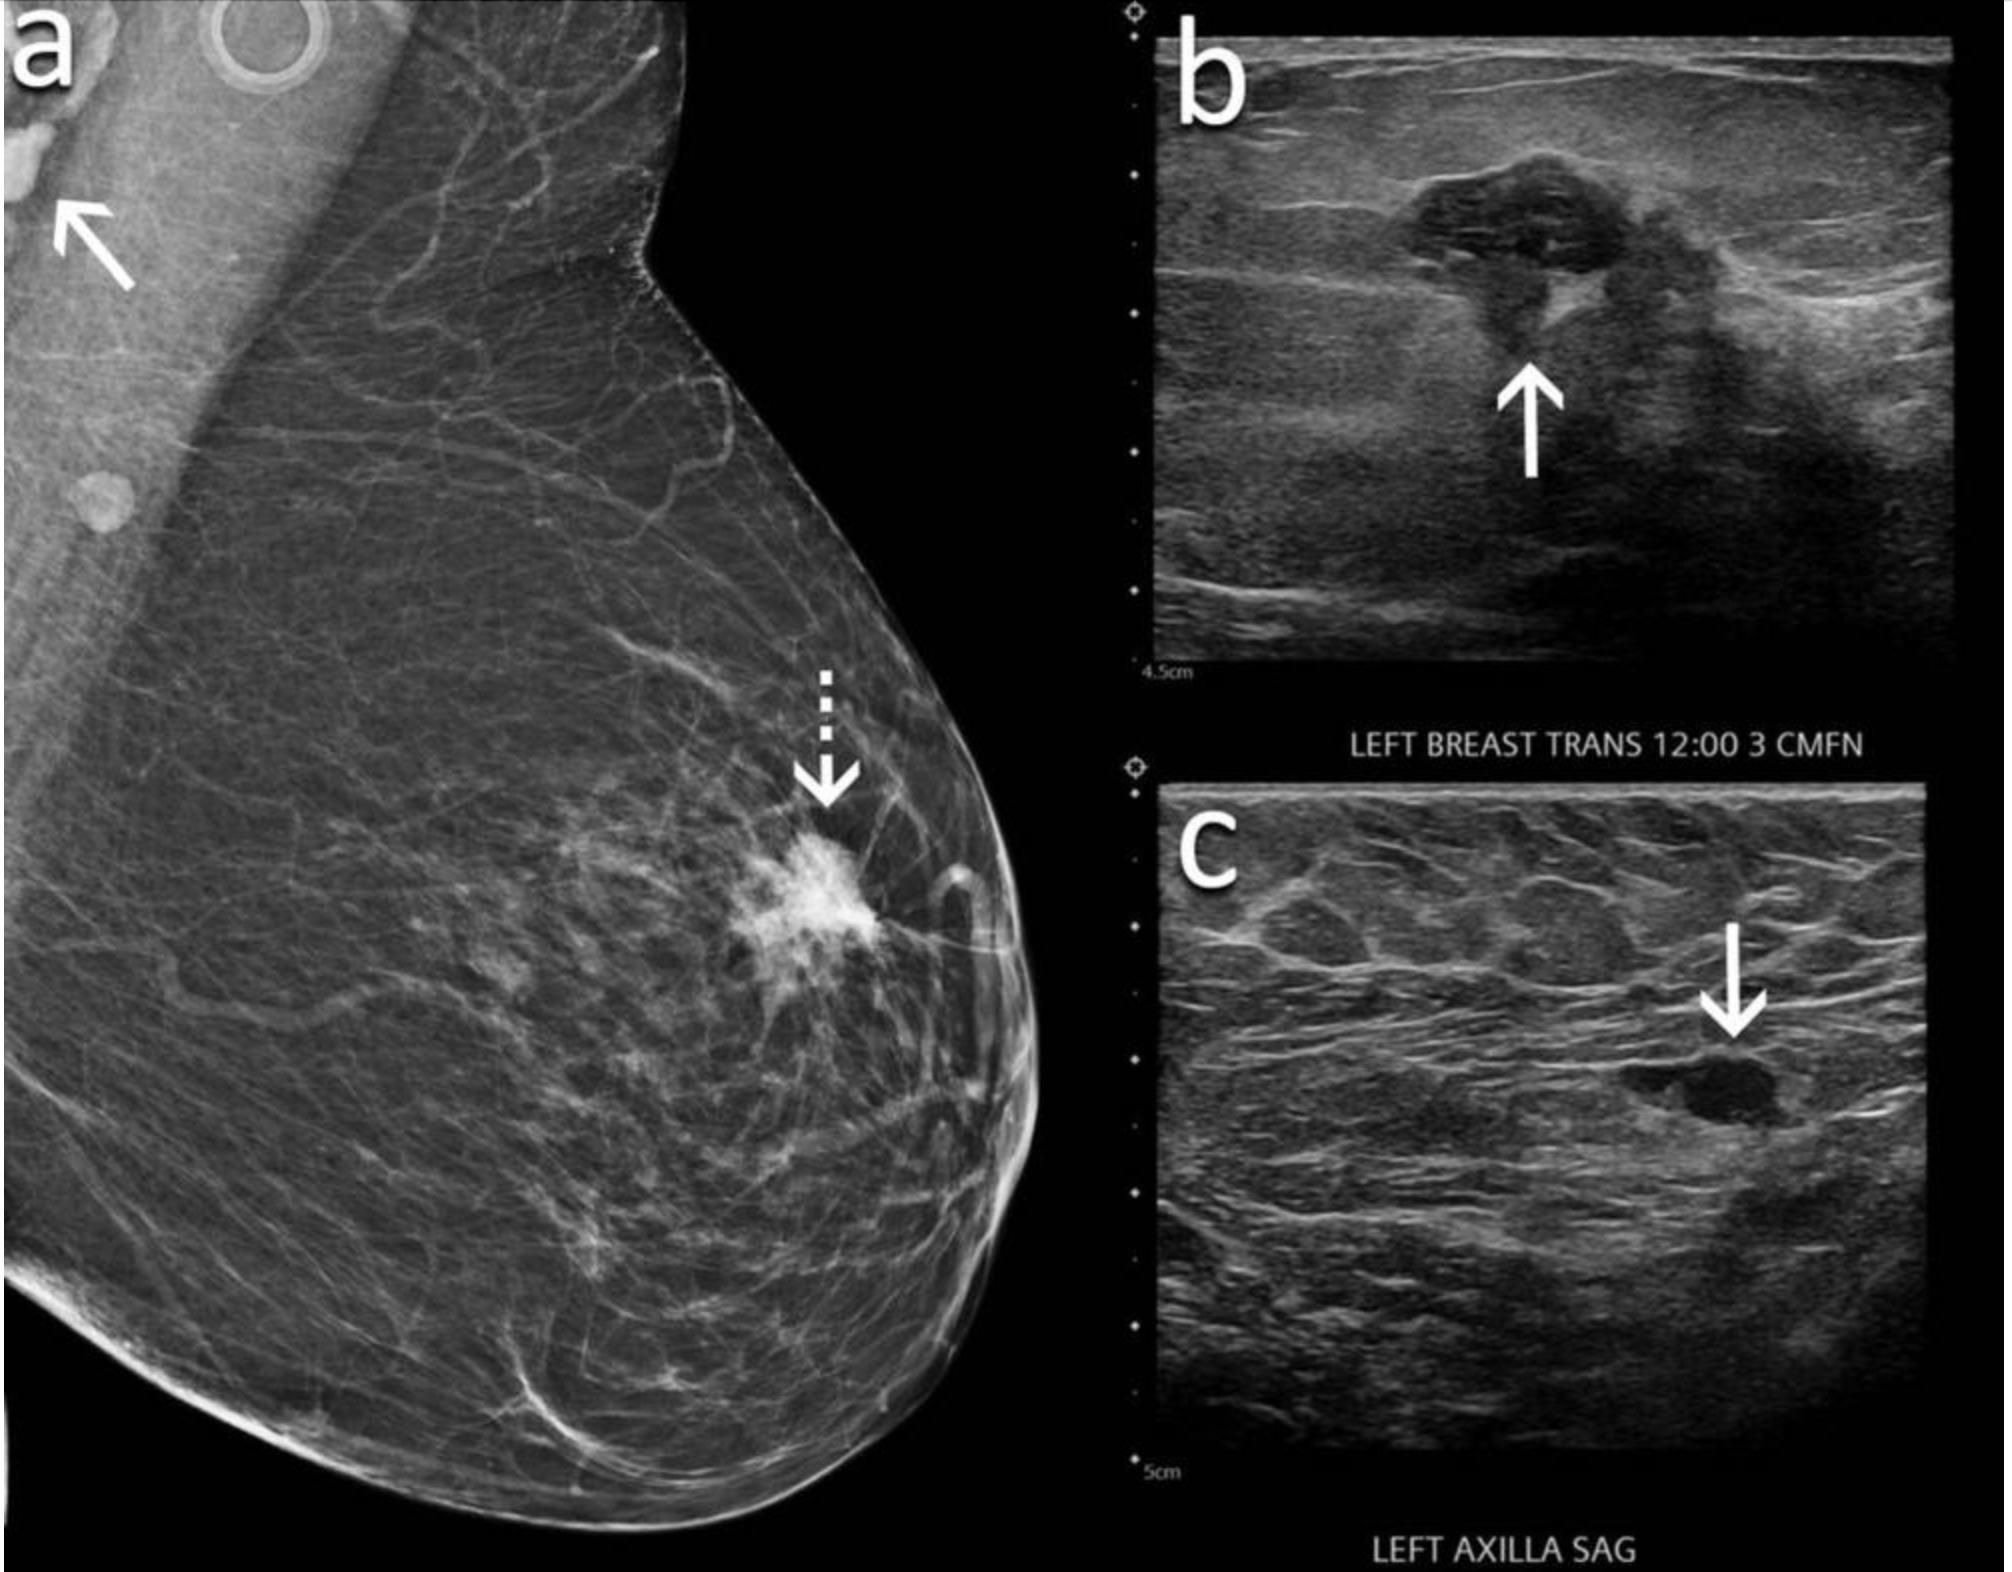
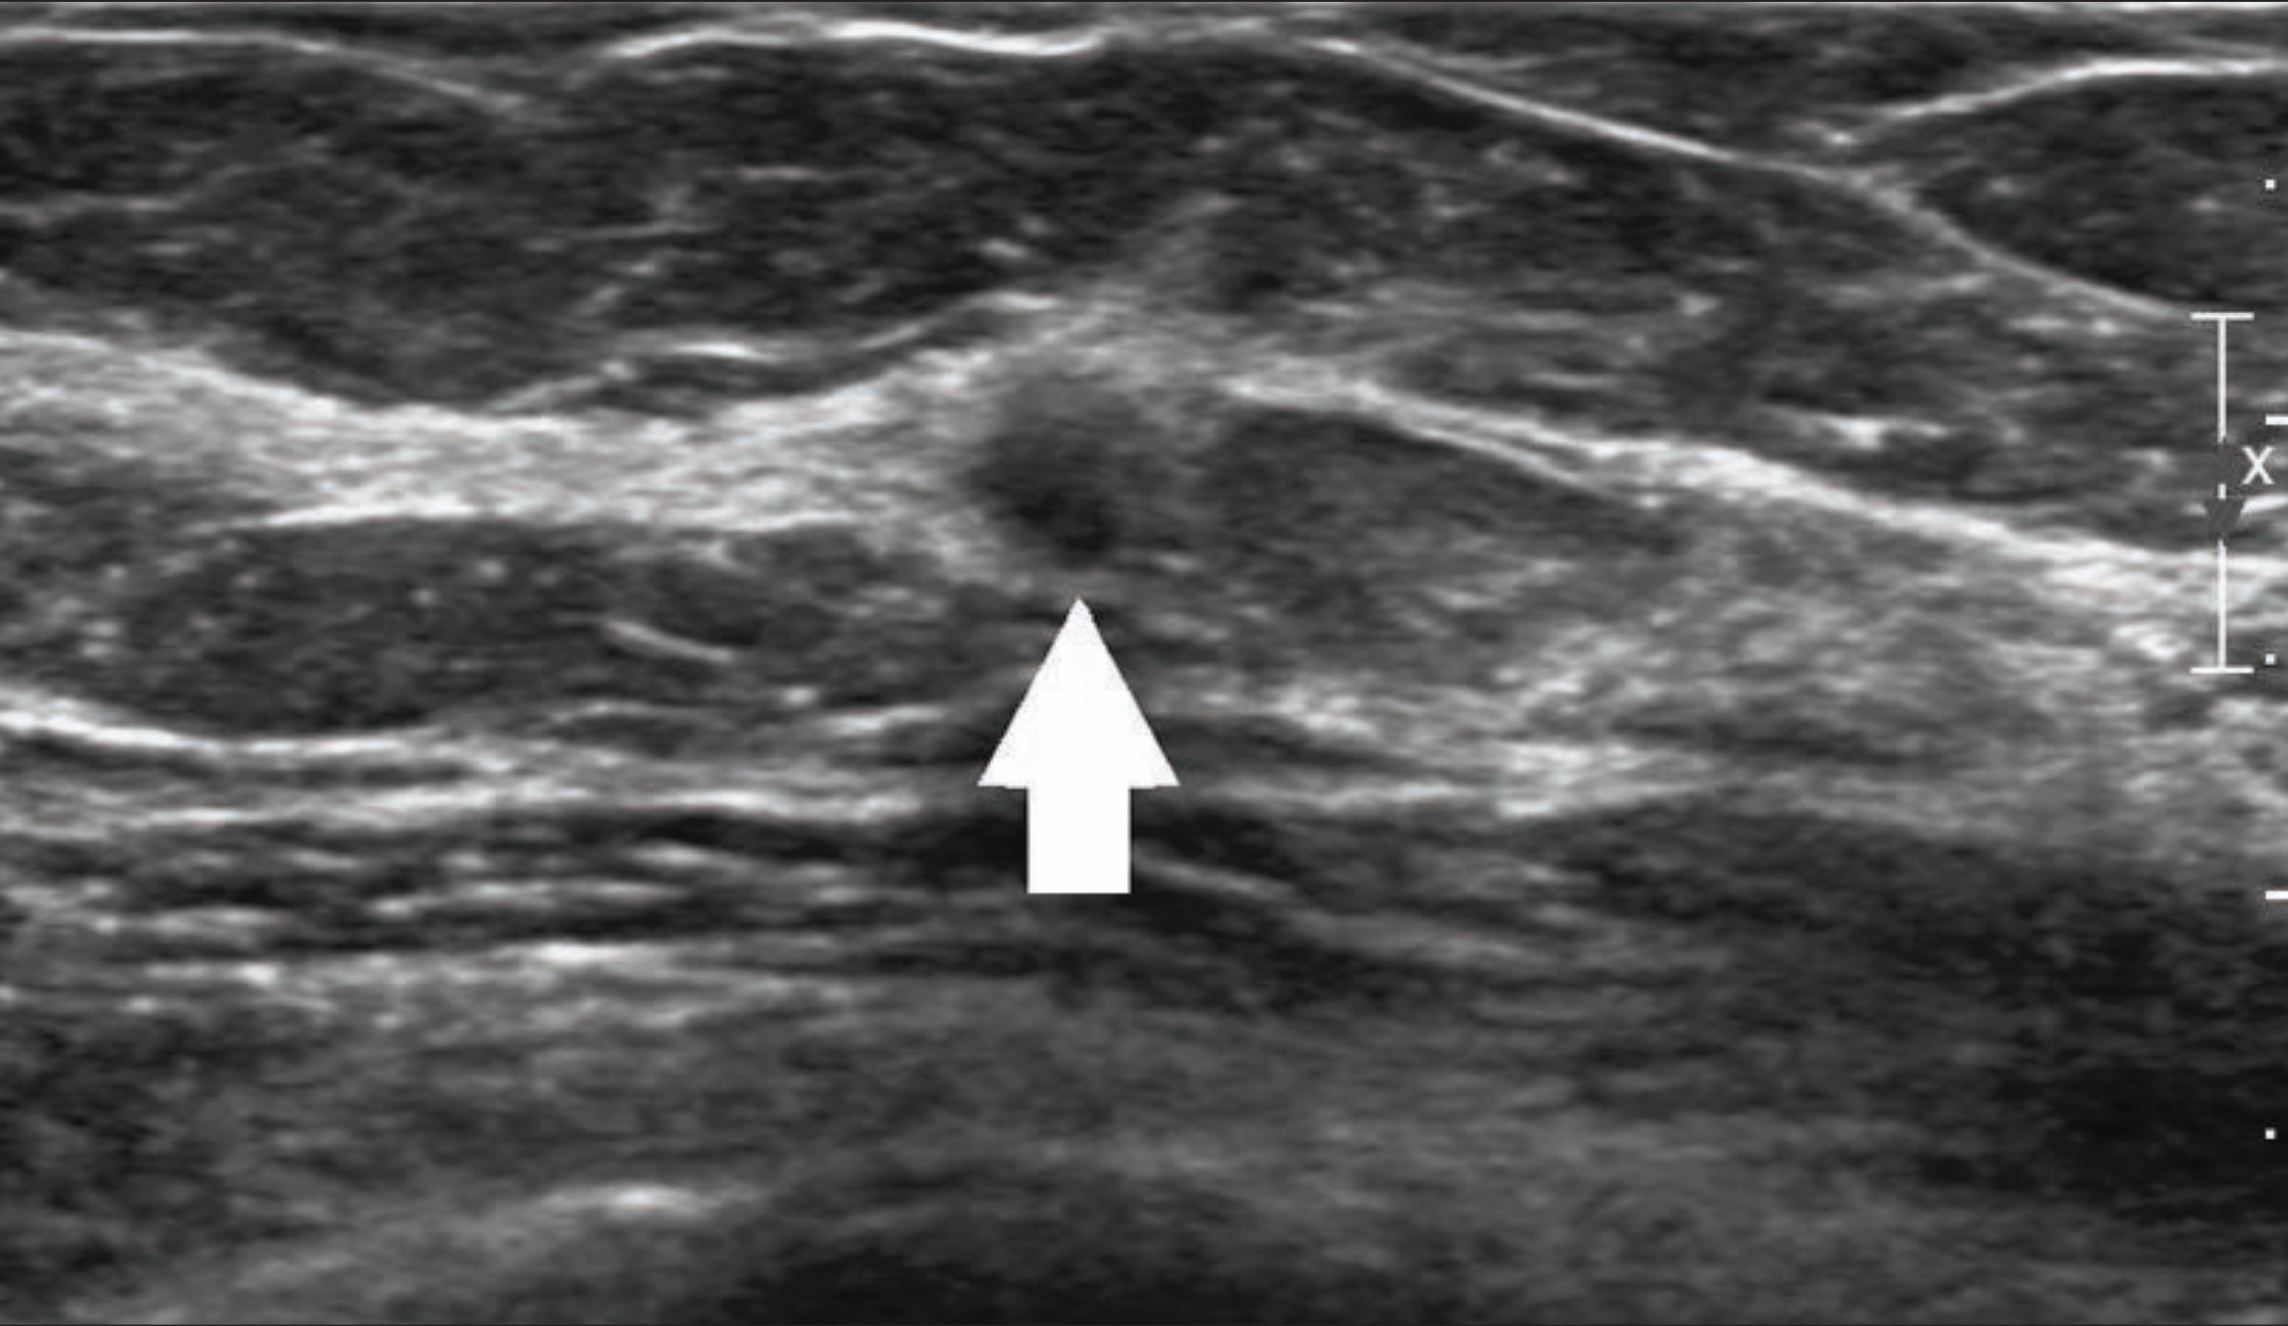
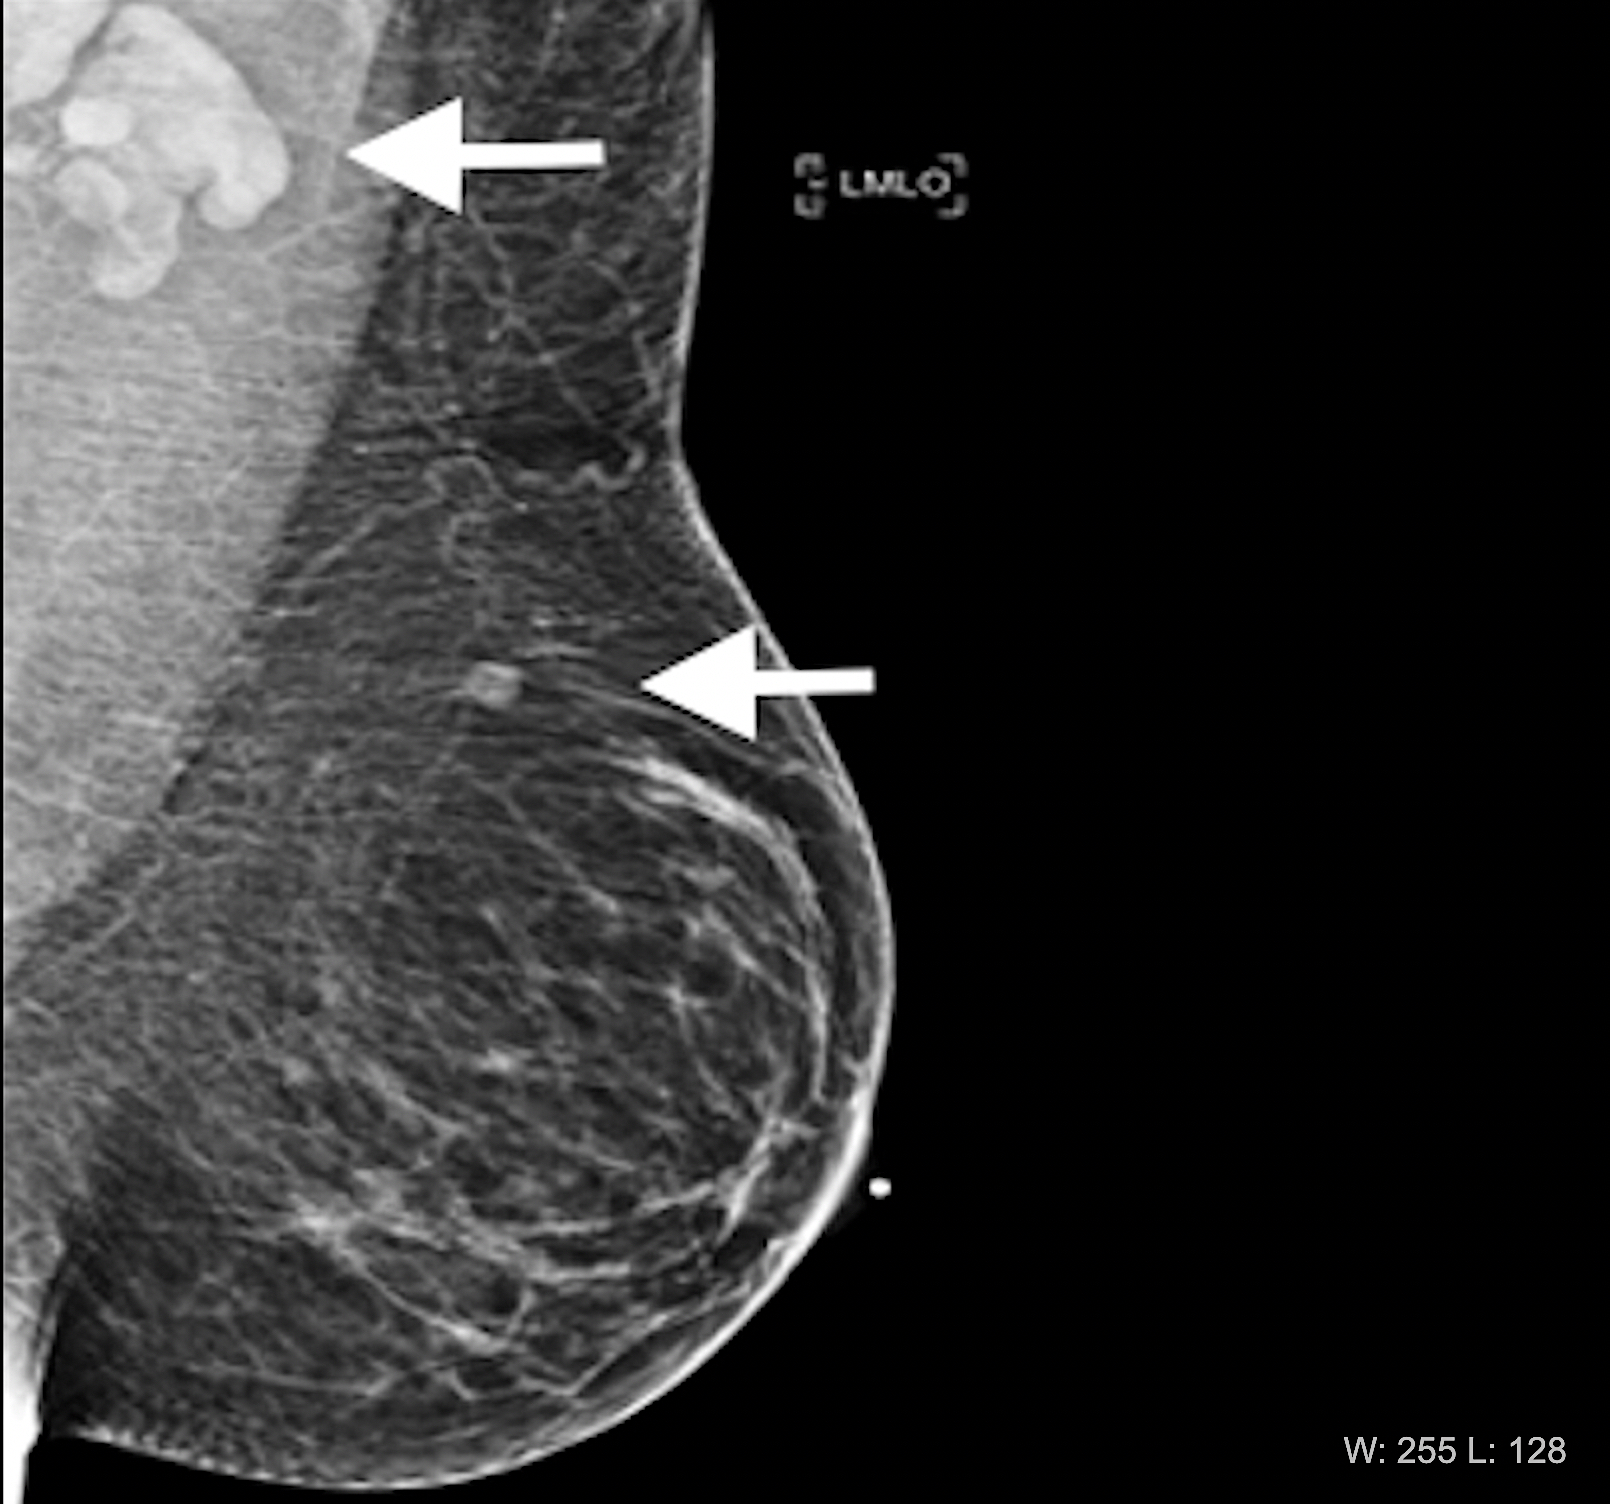
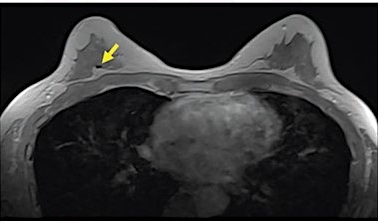
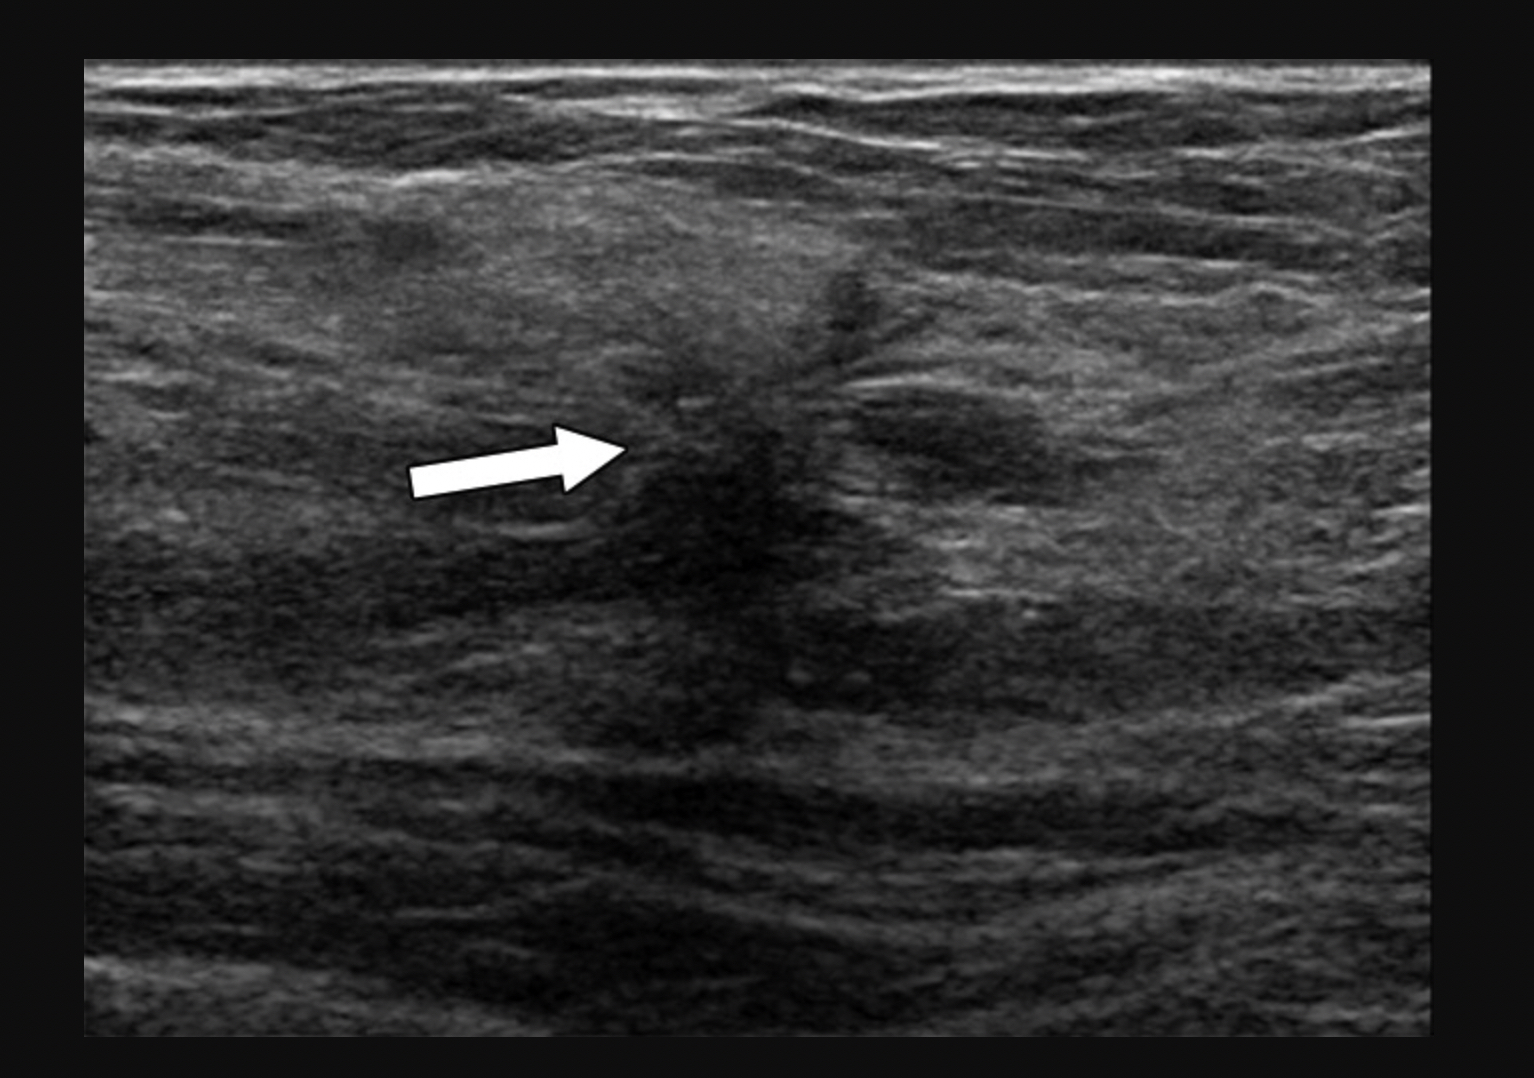
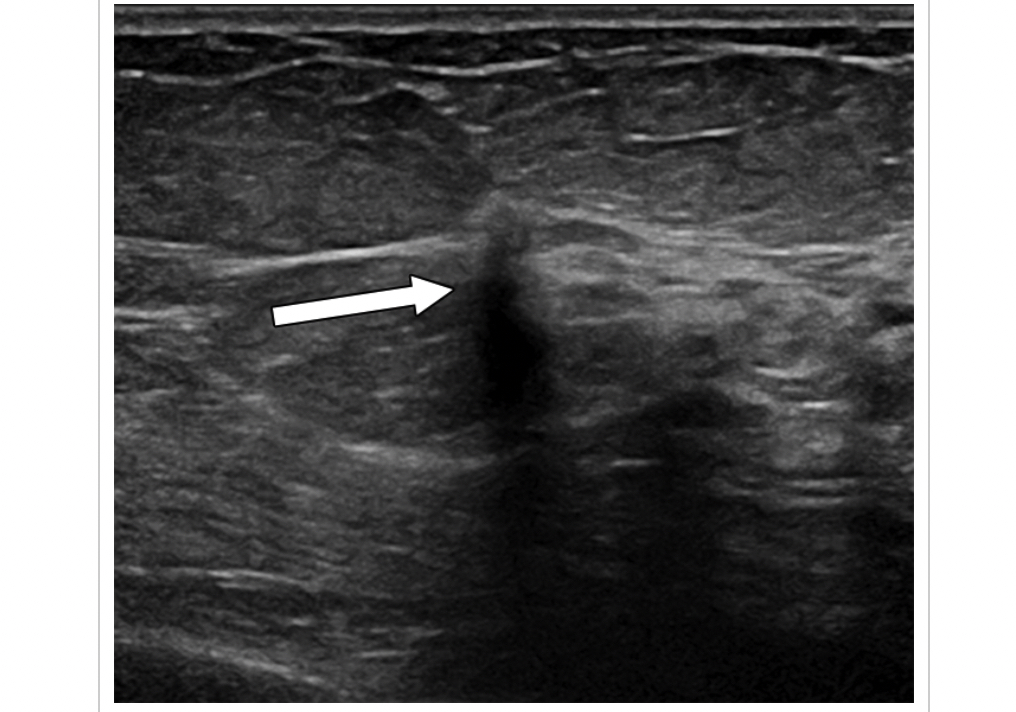
An example from the study of a 60-year-old woman who presented for screening mammography nine weeks after receiving her second dose of the Moderna COVID-19 vaccine. (A) Mediolateral oblique view of the left breast demonstrates an irregular mass in the superior left breast (dash arrow) and a dense lymph node in the left axilla that is incompletely visualized (arrow). Sonography demonstrates (B) an irregular hypoechoic mass in the breast (arrow) that corresponded to the mammographic finding and (C) a lymph node with eccentric cortical thickening measuring 6 mm (arrow) in the axilla. Biopsy of the mass yielded invasive ductal carcinoma and biopsy of the lymph node yielded metastatic carcinoma. Image courtesy of RSNA
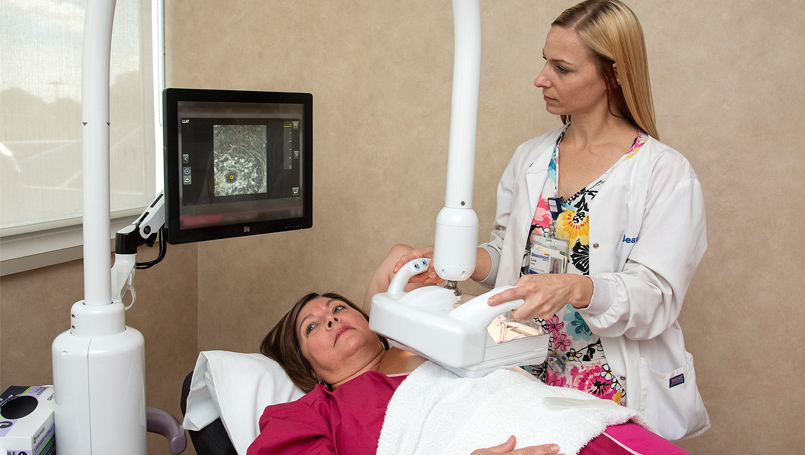
An example of an automated breast ultrasound (ABUS) system in use. This is a GE Healthcare Invenia 2.0 installed at the Beaumont Breast Care Center in Dearborn, Michigan. ABUS offers a comfortable, nonionizing alternative to other supplemental screening options for women with dense breast tissue. ABUS also helps increase the consistancy and diagnostic quality of breast ultrasound by eliminating the variability between different sonographers. Photo courtesy of Beaumont Health.
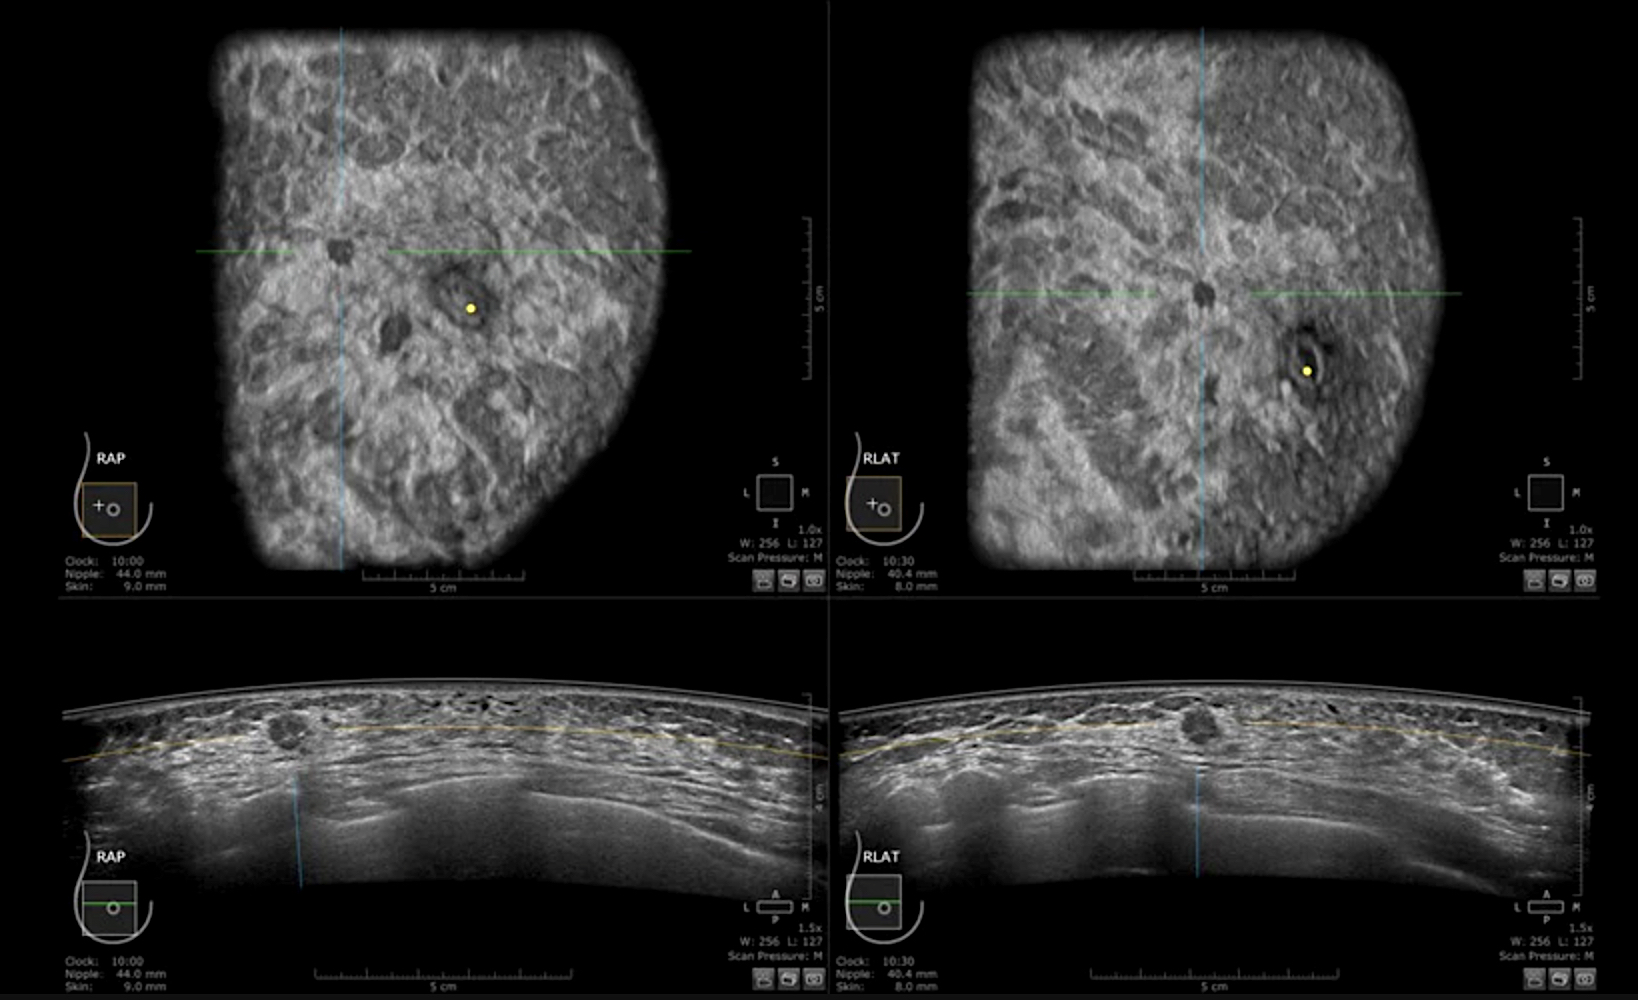
Example of an automated breast ultrasound (ABUS) exam showing ductal carcinoma. ABUS systems enable consistent, high quality breast ultrasound scans that help eliminate the variability in image quality and imaging technique between various sonographers. ABUS also helps in clinics where they might not have a highly experienced sonographer. Consistent scans are needed to track tumor size and landmarks in imaging for serial screenings and during cancer therapy. Image from GE Healthcare.
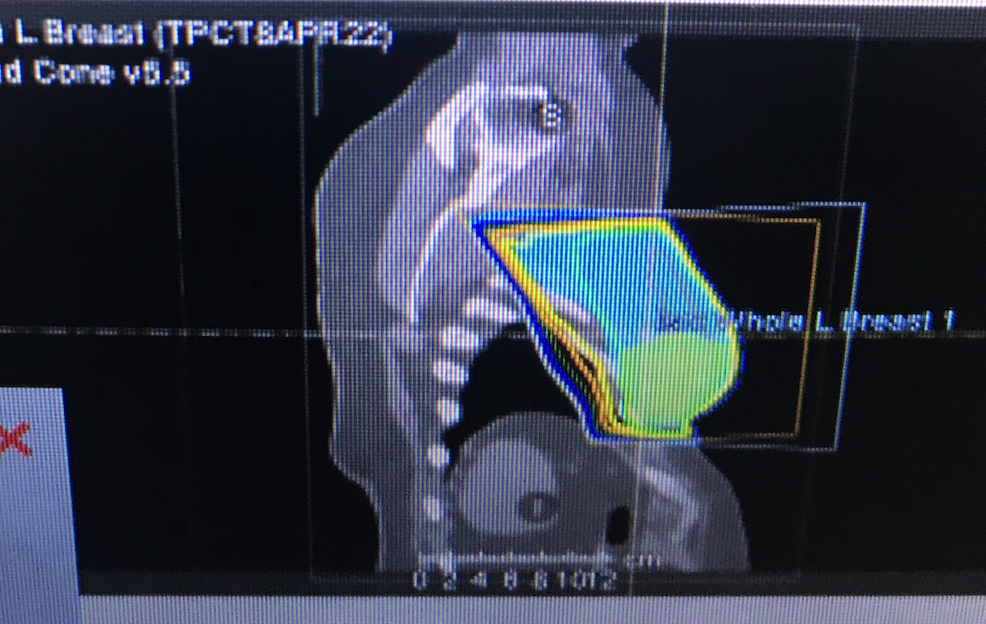
Example of an external radiation therapy treatment plan for a 73-year-old woman who had a small ductal carcinoma in situ (DCIS) surgically removed. The post-operative LINAC radiotherapy is to eliminate any cancer cells that may have been left behind from the surgery. Image courtesy of the patient.
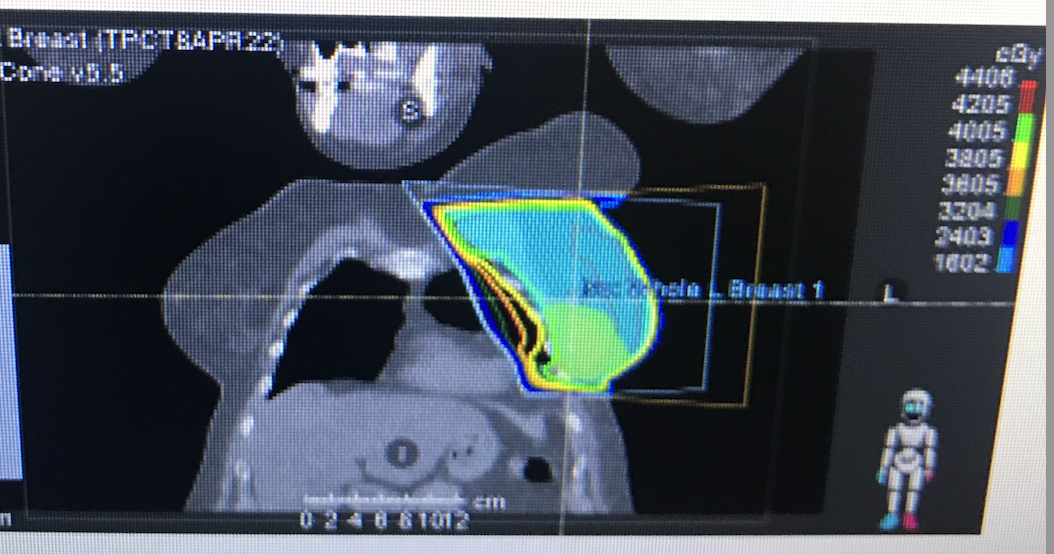
Example of an external radiation therapy treatment plan for a 73-year-old woman who had a small ductal carcinoma in situ (DCIS) surgically removed. The post-operative LINAC radiotherapy is to eliminate any cancer cells that may have been left behind from the surgery. Image courtesy of the patient.
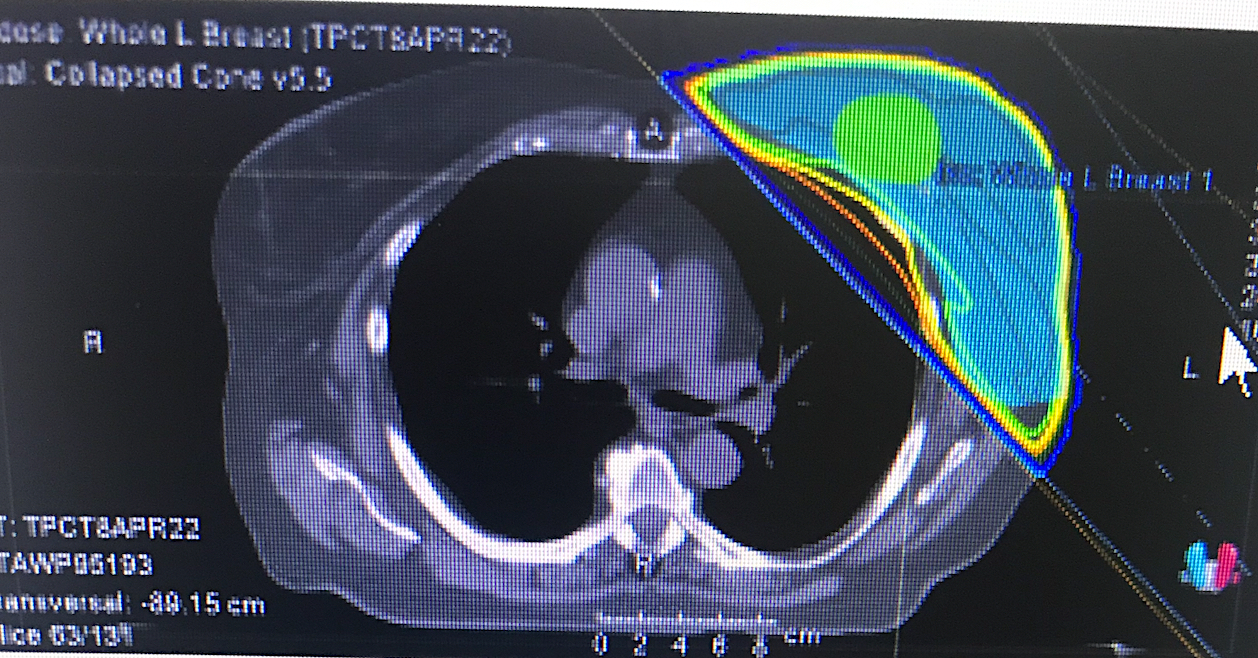
Example of an external radiation therapy treatment plan for a 73-year-old woman who had a small ductal carcinoma in situ (DCIS) surgically removed. The post-operative LINAC radiotherapy is to eliminate any cancer cells that may have been left behind from the surgery. Image courtesy of the patient.
An example of a mammogram with some dense breast tissue that was deemed to not have cancer, and a molecular breast imaging (MBI) study of the same women showing increased metabolic activity in the dense area, revealing a cancer. Image from Mayo Clinic.
Mammography images (left) compared to molecular breast imaging (MBI) monitoring of tumor response to chemotherapy. Image from SNMMI
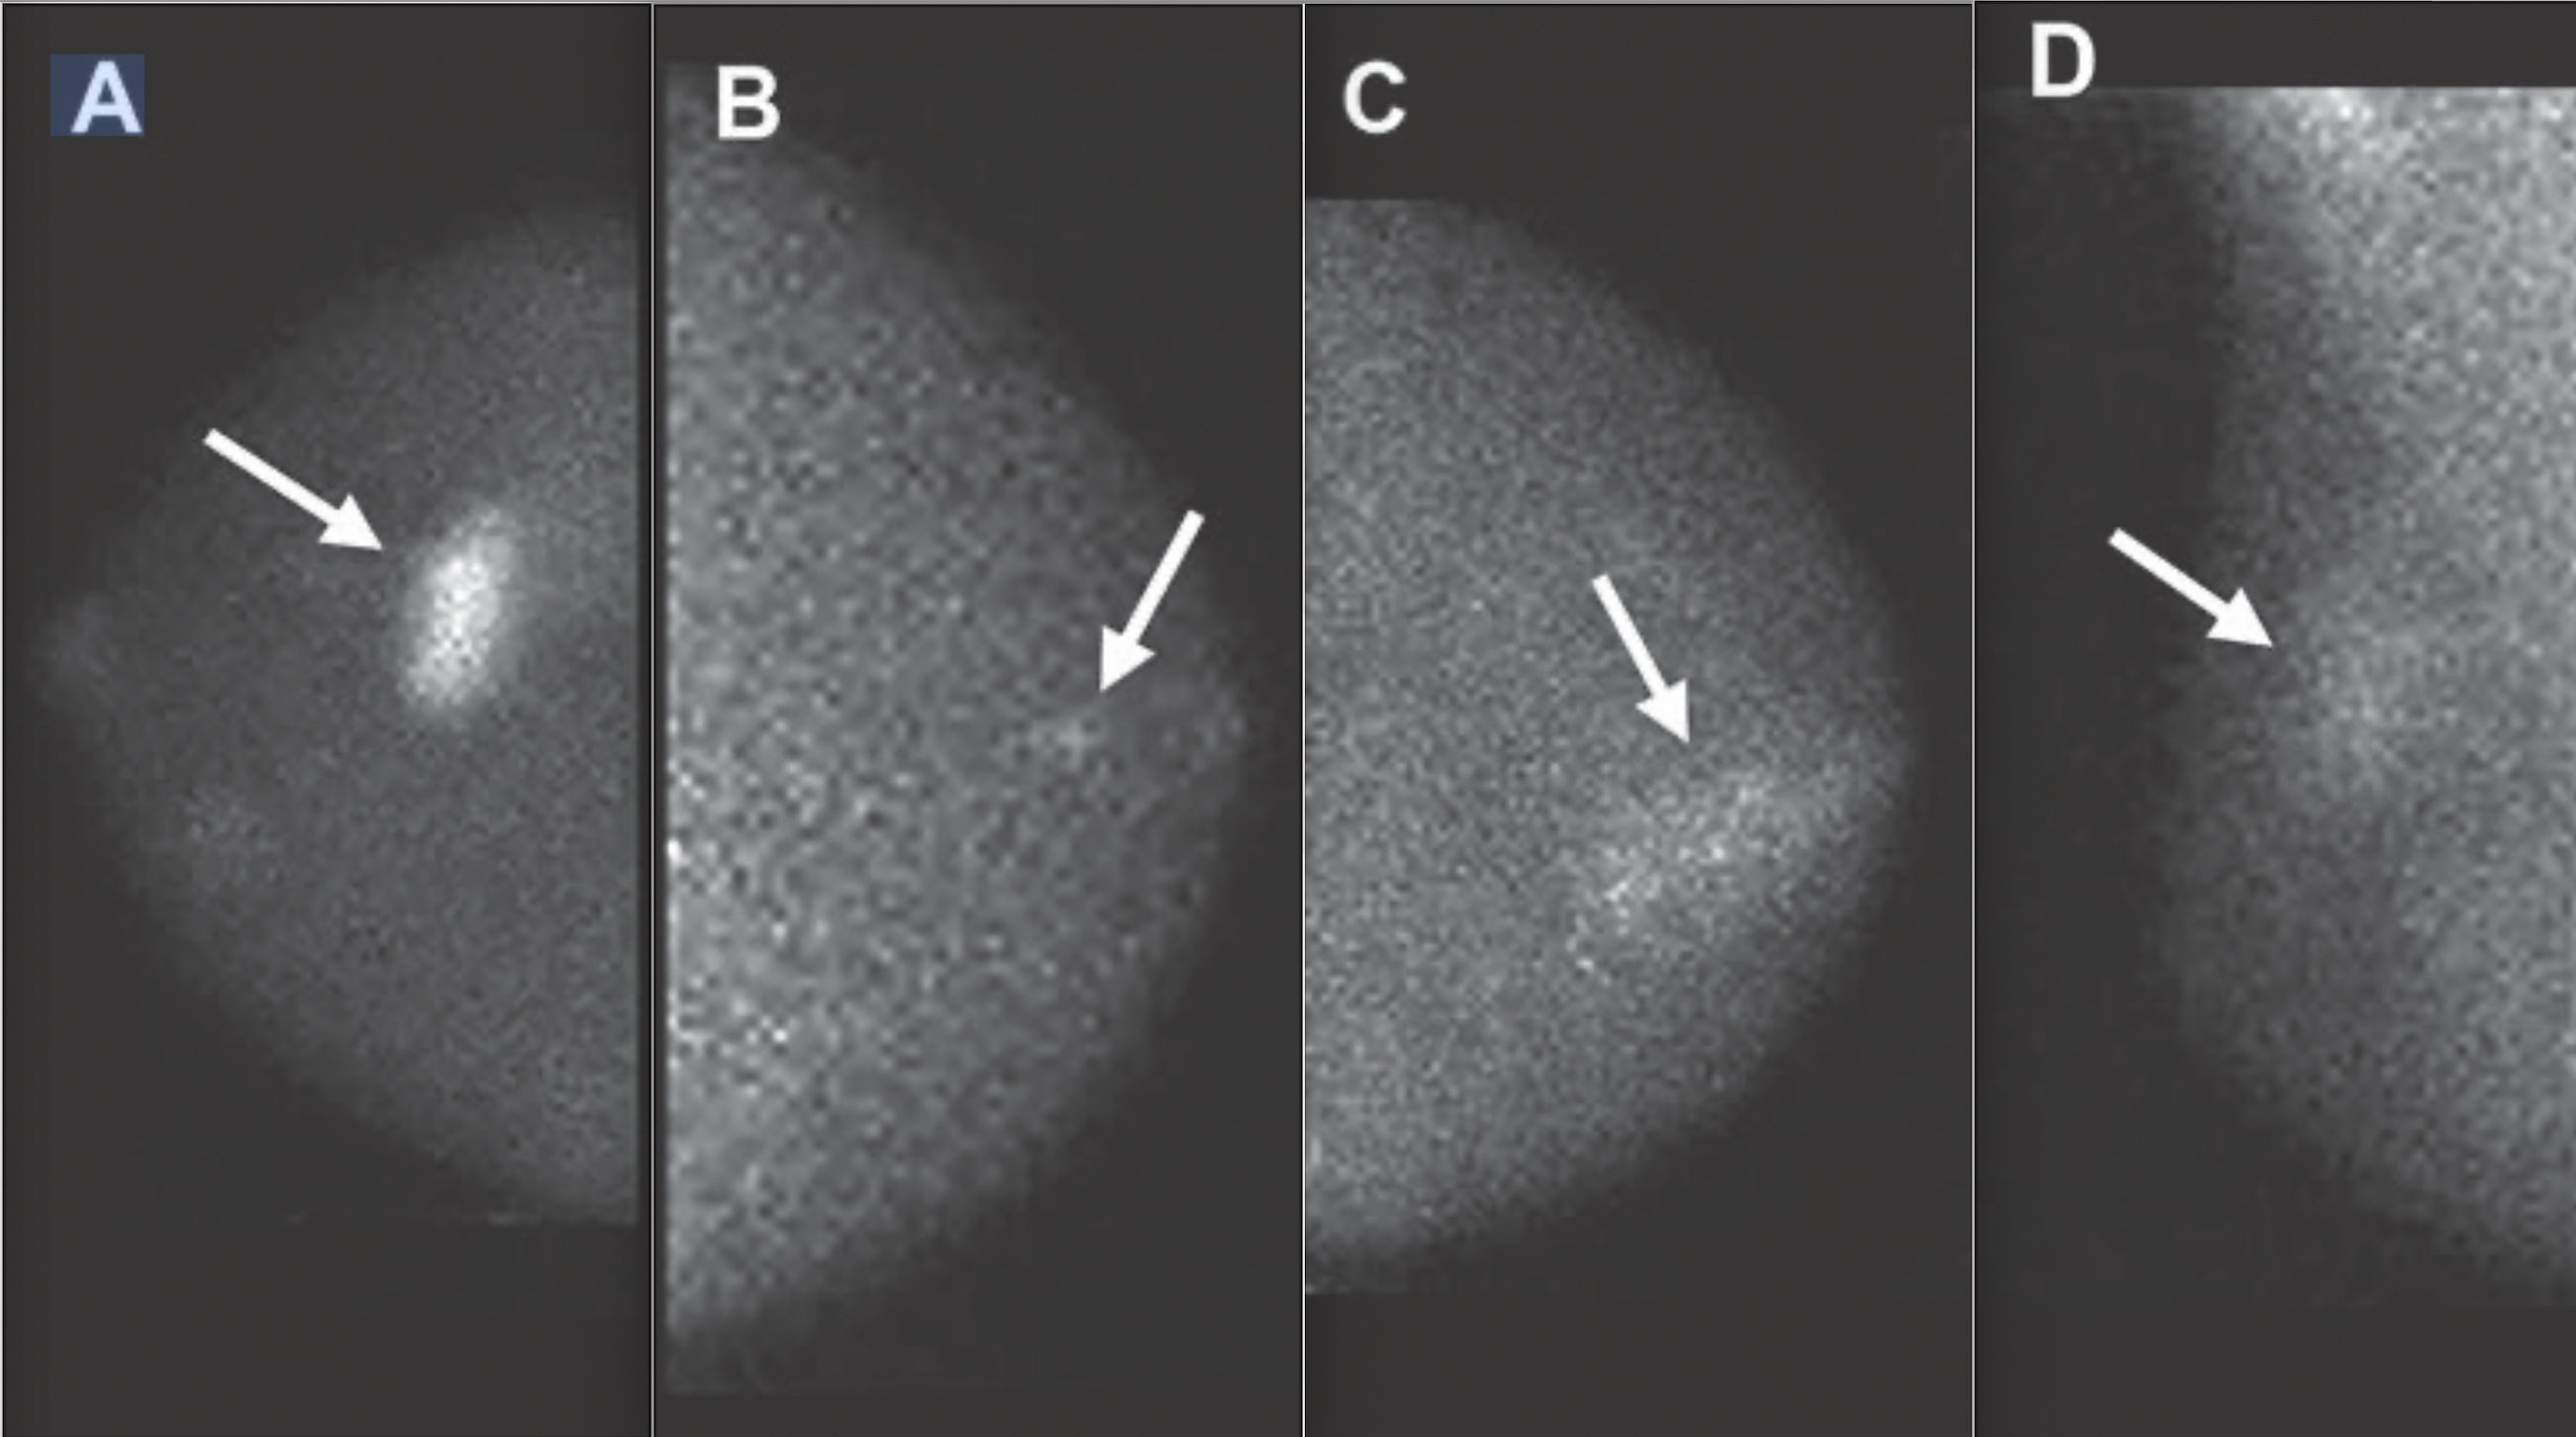
Images from molecular breast imaging (MBI) examinations demonstrating MBI lexicon descriptors. A, Mass (arrow) with marked intensity of uptake. B, Nonmass uptake (arrow) with focal distribution and mild intensity of uptake. C, Nonmass uptake (arrow) with segmental distribution and moderate intensity of uptake. D, Nonmass uptake (arrow) with regional distribution and mild intensity of uptake. Images courtesy of AJR. https://doi.org/10.2214/AJR.21.27047
Images from molecular breast imaging (MBI) examinations demonstrating MBI lexicon descriptors. A, Mass (arrow) with marked intensity of uptake. B, Nonmass uptake (arrow) with focal distribution and mild intensity of uptake. C, Nonmass uptake (arrow) with segmental distribution and moderate intensity of uptake. D, Nonmass uptake (arrow) with regional distribution and mild intensity of uptake. Images courtesy of AJR.

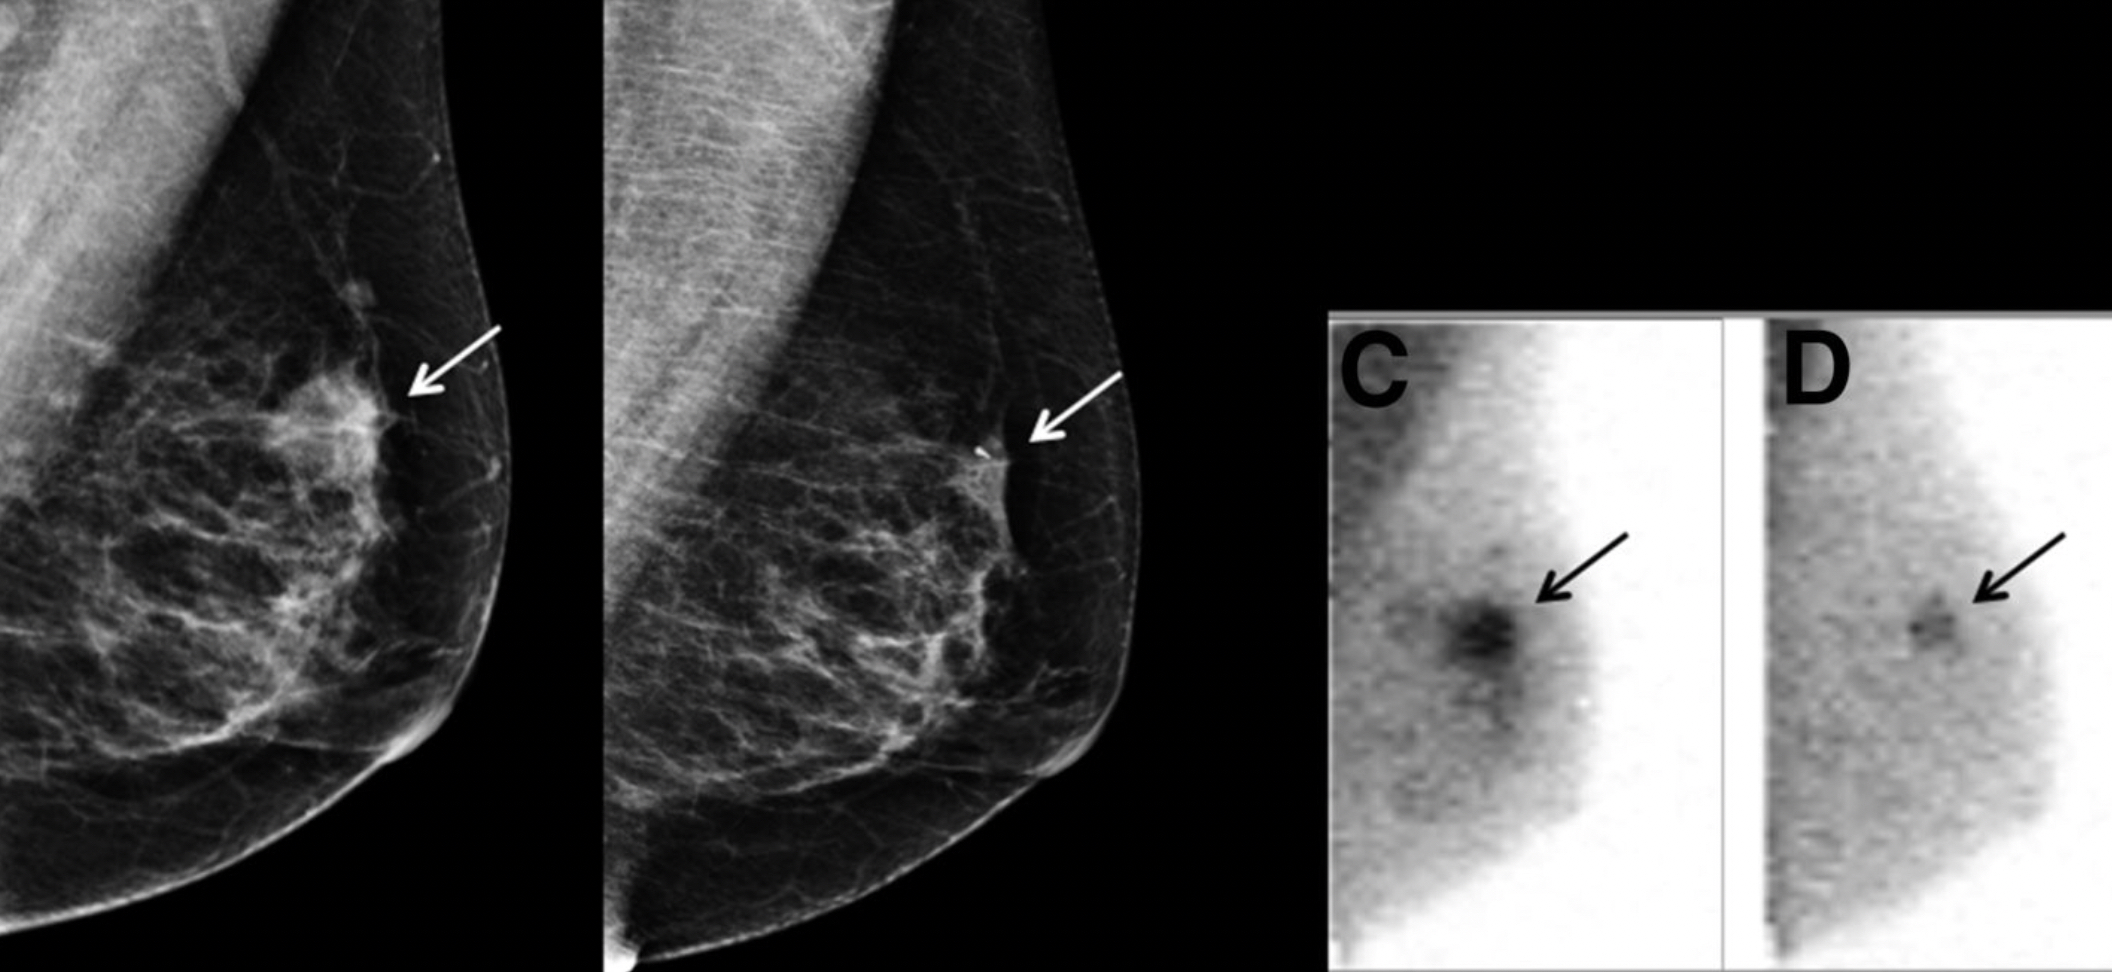
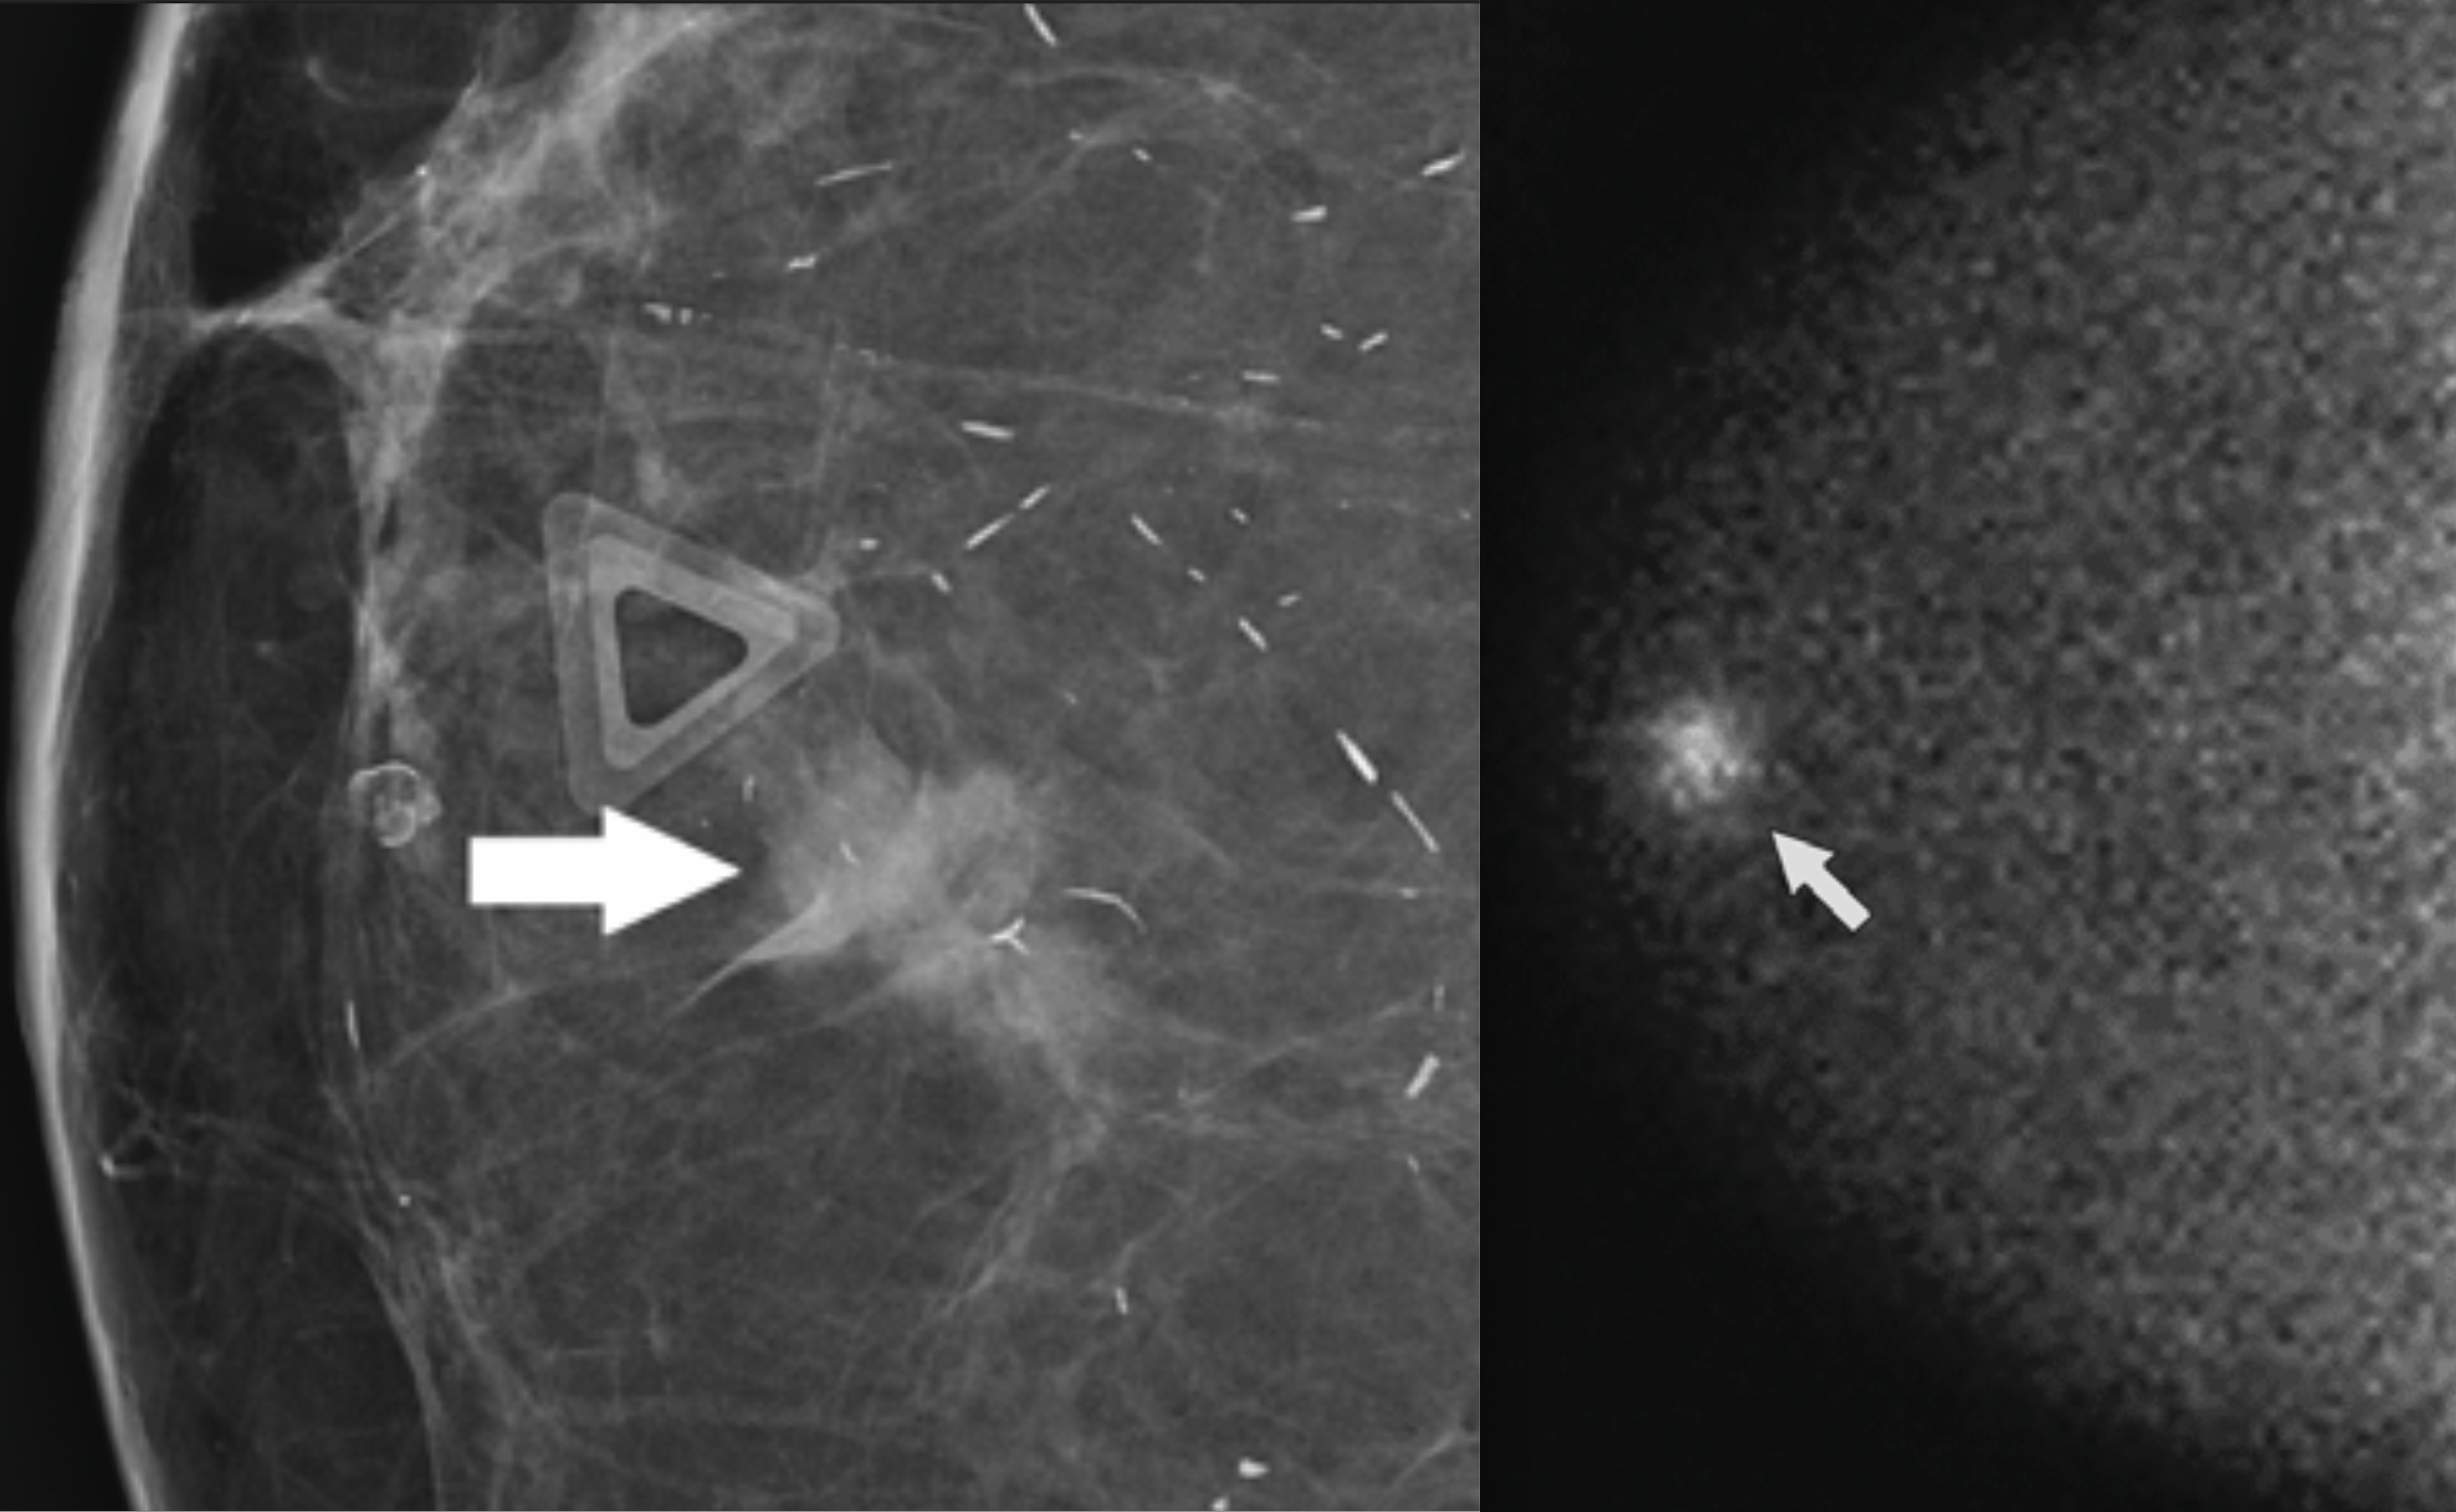
75-year-old woman with a palpable abnormality in the right breast and an abnormal diagnostic mammogram and ultrasound. Molecular breast imaging (MBI) was performed before biopsy. Left, right breast CC magnification view from a diagnostic mammogram shows an irregular spiculated mass corresponding to the MBI finding (arrow). Left, right craniocaudal (CC) image from a dual-detector MBI examination shows a mass with marked intensity of uptake in the right breast at 12 o’clock, anterior depth (arrow). Images courtesy of AJR.
75-year-old woman with a palpable abnormality in the right breast and an abnormal diagnostic mammography and ultrasound. Molecular breast imaging (MBI) was performed before biopsy. Left, right craniocaudal (CC) image from a dual-detector MBI examination shows a mass with marked intensity of uptake in the right breast at 12 o’clock, anterior depth (arrow), clinically assessed as suspicious for malignancy (category 4). Right, breast ultrasound shows an irregular hypo-echoic mass with spiculated margins. An ultrasound-guided biopsy demonstrated invasive ductal carcinoma, Nottingham grade II (of III). Images courtesy of AJR.
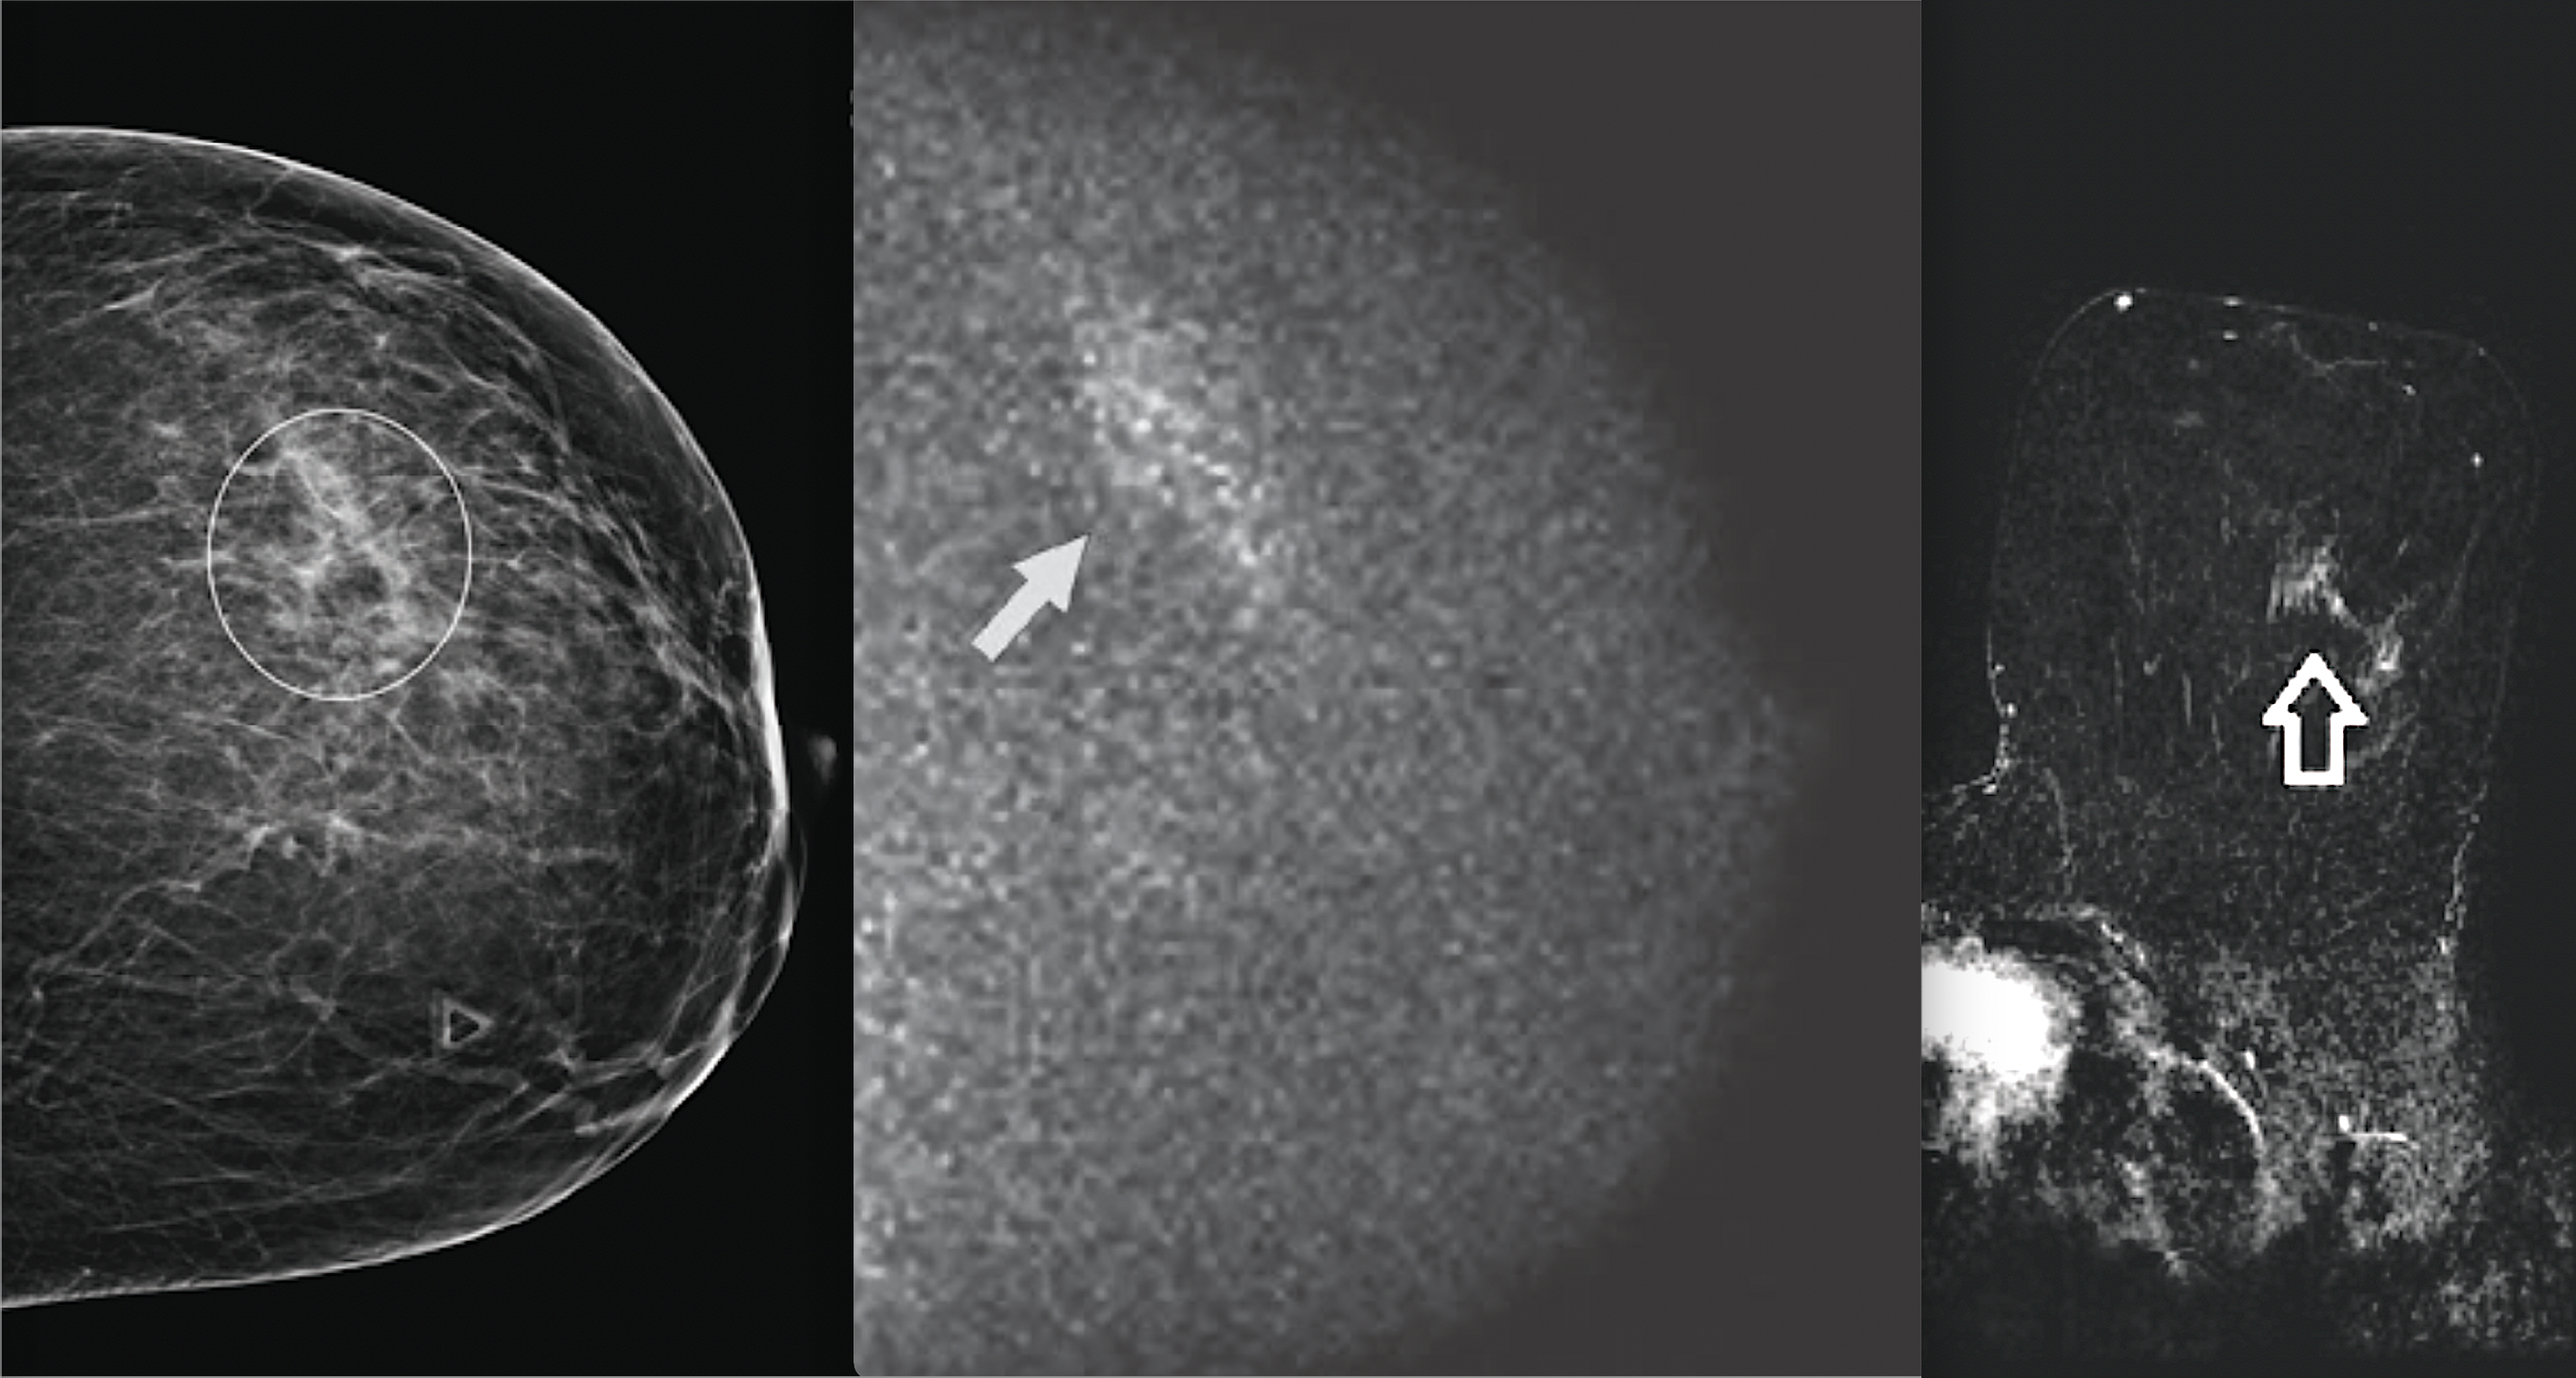
39-year-old woman with an abnormal baseline screening mammography result. Molecular breast imaging (MBI) was performed for problem-solving. Left, left craniocaudal (CC) view from diagnostic mammography shows asymmetry in the outer left breast, middle depth (circle). Middle, left CC view from molecular breast imaging (MBI) shows a segmental area of nonmass uptake with mild intensity in the outer left breast, middle depth (arrow), that corresponds with the mammographic asymmetry and was clinically assessed as suspicious for malignancy (category 4). Right, axial subtraction image from breast MRI shows a corresponding area of linear nonmass enhancement in the lateral left breast (arrow). MRI-guided biopsy demonstrated pseudoangiomatous stromal hyperplasia, which was concordant with the imaging findings. Images courtesy of AJR.
Targeted ultrasound of the left breast confirmed a 5 mm irregular hypo-echoic mass (arrow). Ultrasound-guided biopsy showed invasive lobular carcinoma, Nottingham grade I (of III). Images courtesy of AJR.
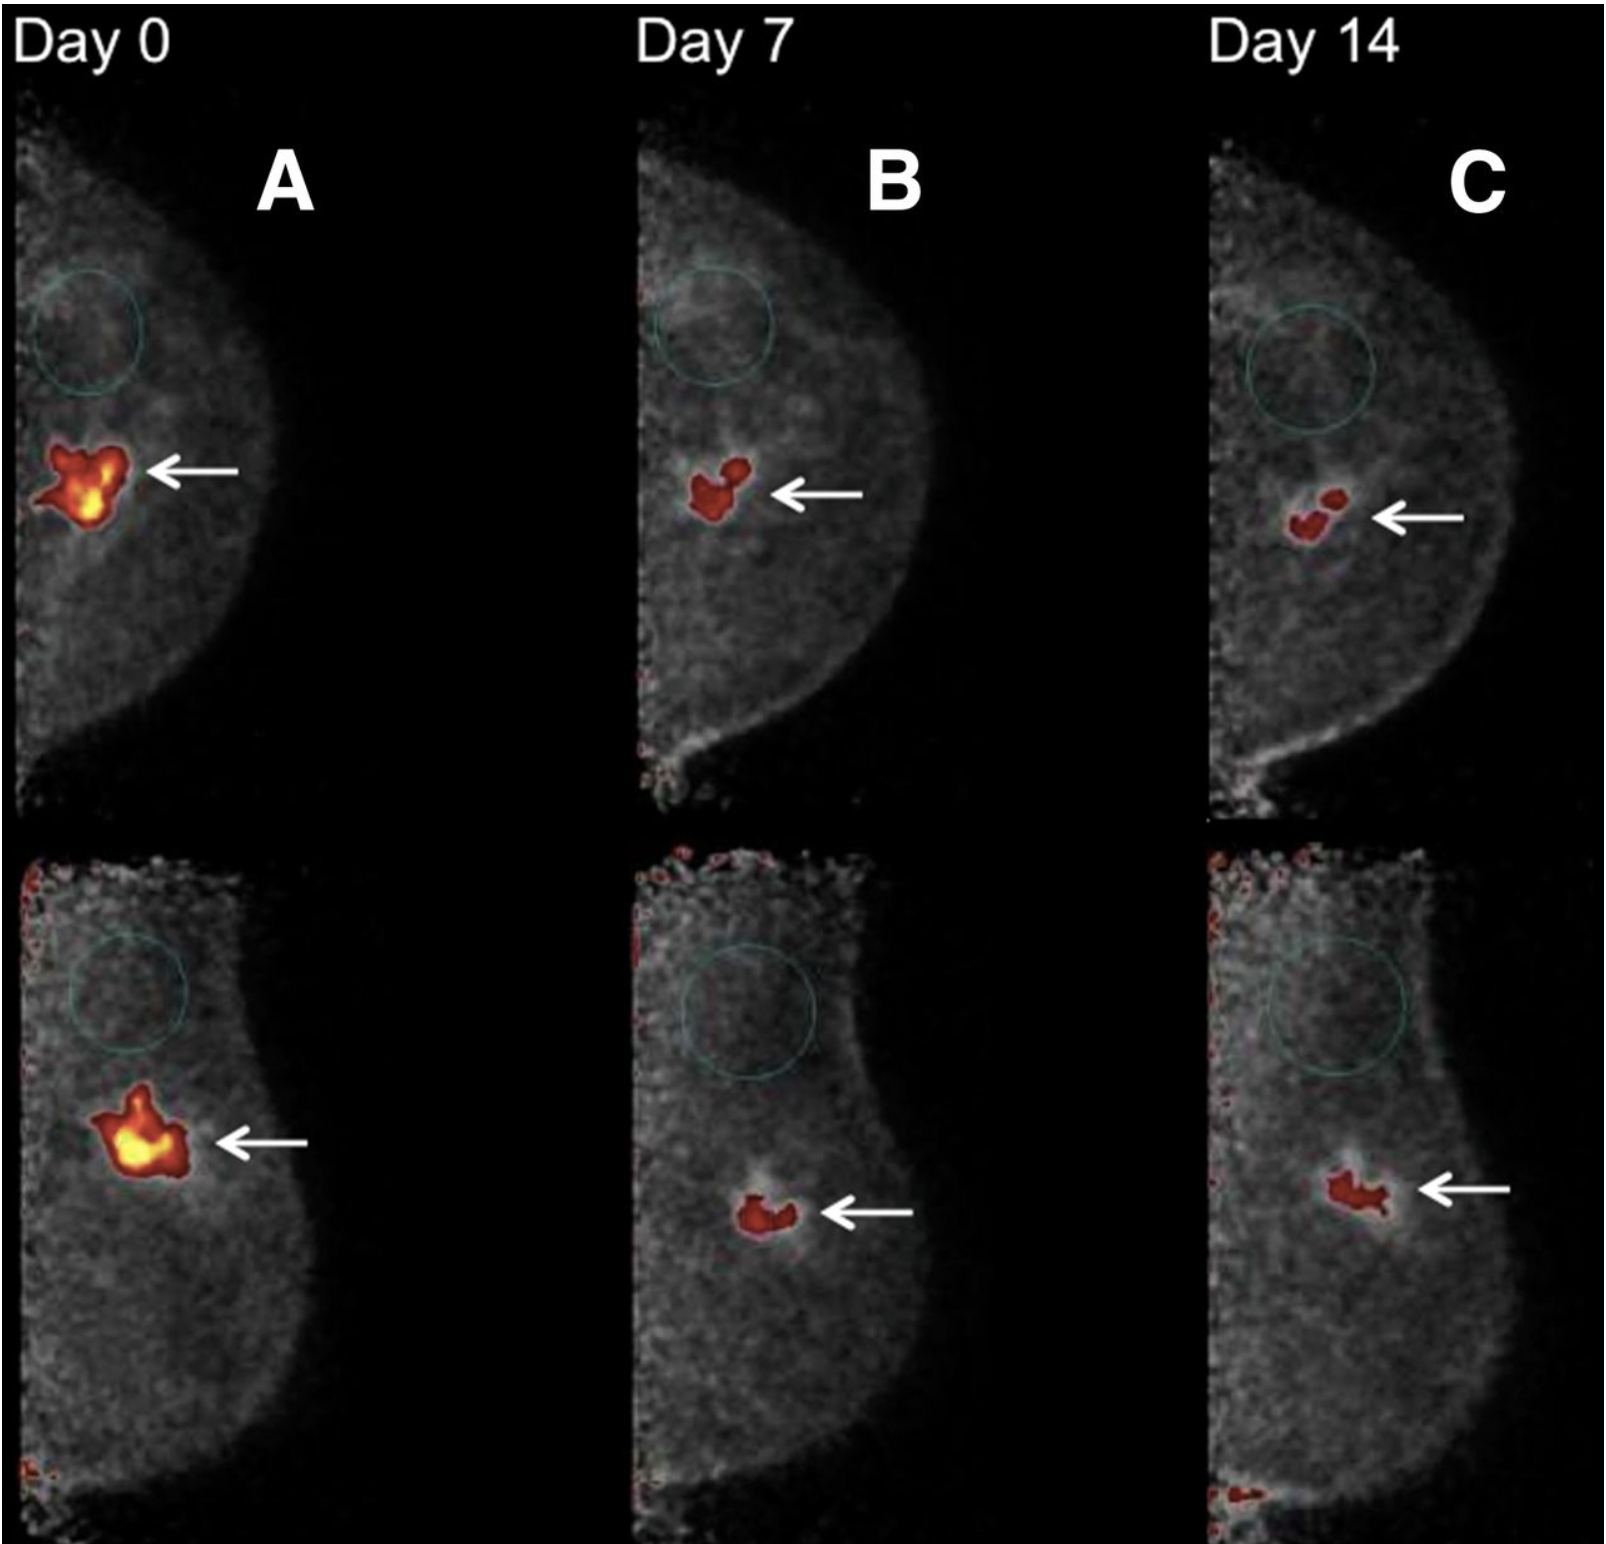
Positron emission mammography (PEM) showing response to chemotherapy. This 53-year-old woman presented with lump in left breast, corresponding to 4.3 cm irregular mass on mammography. Ultrasound-guided core biopsy showed grade 3 IDC that was weakly estrogen receptor–positive (<4%), progesterone receptor–negative, and HER2-positive, with axillary node metastasis. (A) Initial PEM craniocaudal (upper) and MLO (lower) 10-min images (day 0) obtained 1 hour after intravenous injection of 370 MBq (10 mCi) of 18F-FDG show intense uptake in irregular mass corresponding to known cancer (arrows), with tumor-to-normal tissue ratio of 13.8. (B) Seven days after first chemotherapy treatment with docetaxel, carboplatin, and trastuzumab, PEM study was repeated, showing smaller mass (arrows) with less intense uptake and tumor-to-normal tissue ratio of 5.9. (C) 14 days after first chemo treatment, PEM repeated, showing further reduction in size of tumor mass (arrows) and in intensity of uptake and tumor-to-normal tissue ratio of 4.5. At completion of treatment, lumpectomy showed residual 0.8 cm cancer and 1 of 10 axillary nodes were metastatic, consistent with partial treatment response. Response to treatment within 7 days shown on PEM is predictive of overall response. SNMMI photo. Read more.

In a 57-year-old woman, A, axial contrast-enhanced fat-saturated T1 sequence of MRI from a year earlier shows subcentimeter benign lymph nodes in left axilla. B, Most recent contrast-enhanced axial fat-saturated T1 sequence at approximately same level shows multiple new enlarged lymph nodes (arrows) in left axilla. There were no other suspicious findings to suggest primary breast cancer. Image courtesy of RSNA. Read more on this case.
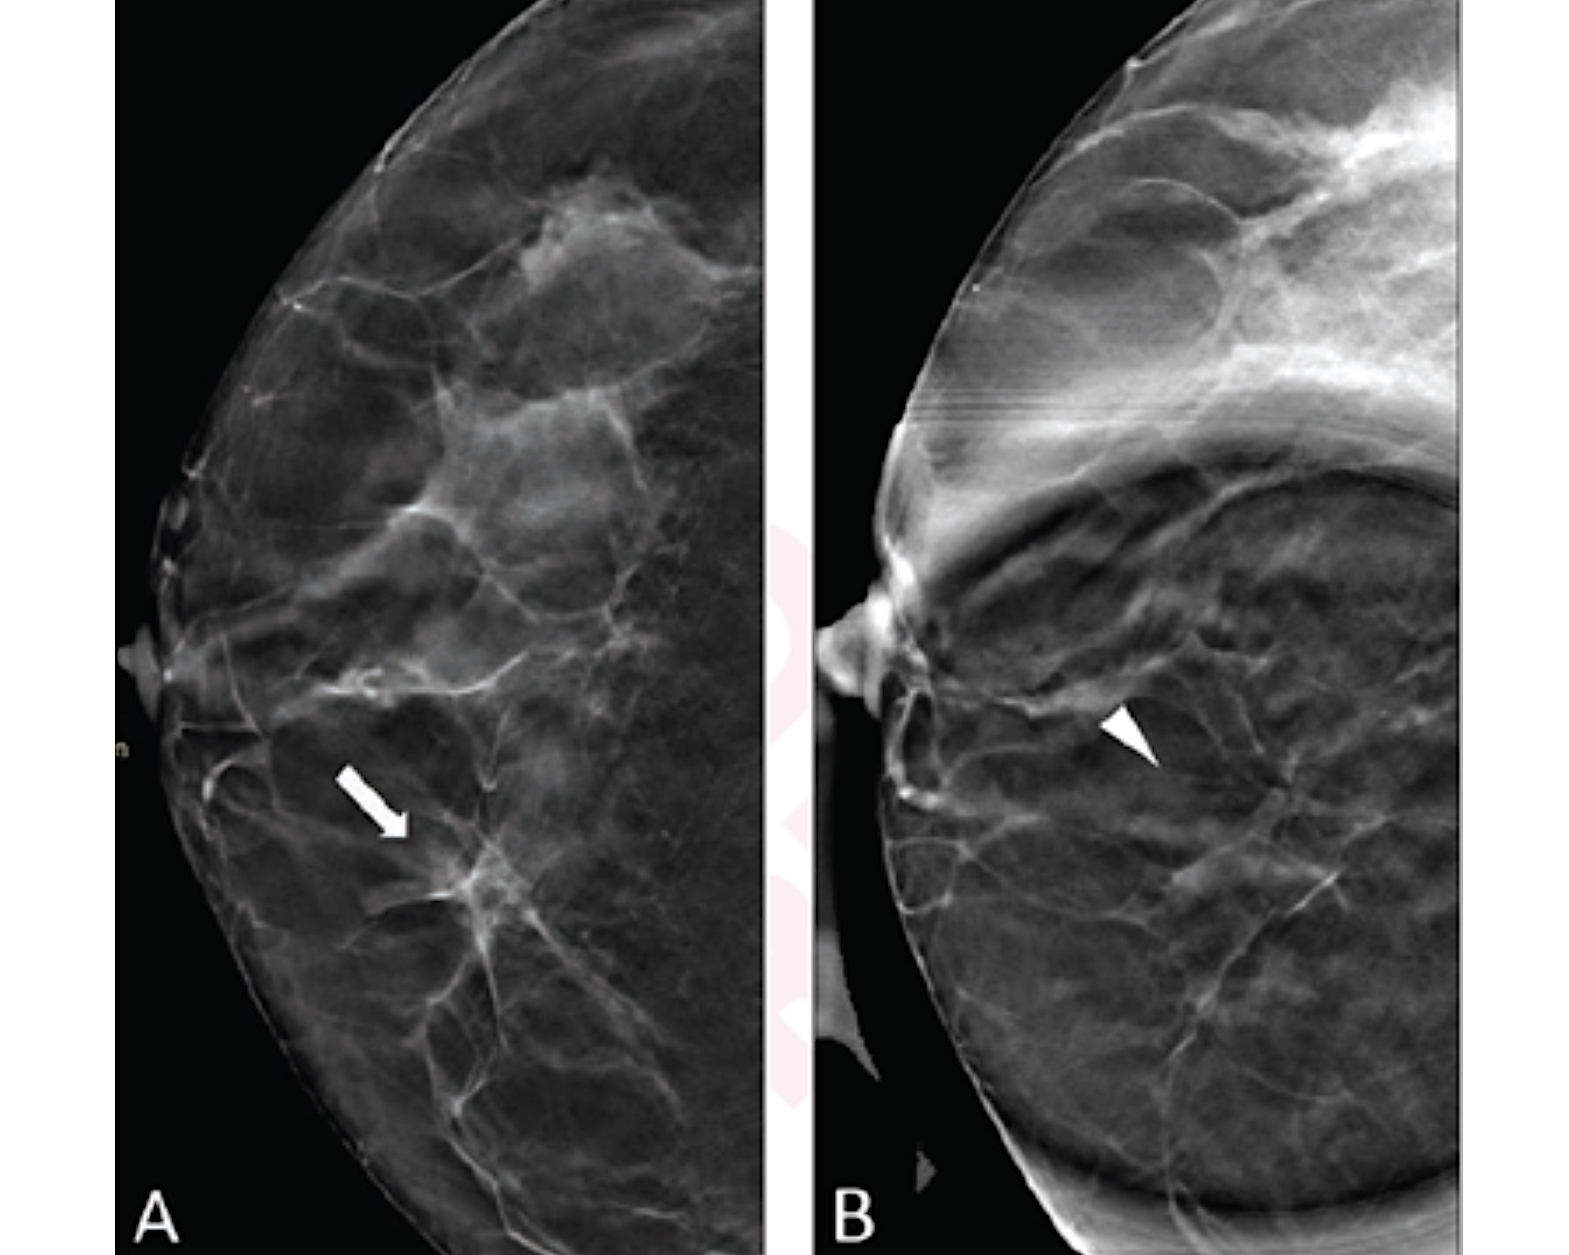
A 52-year-old woman presenting for asymmetry of right breast showing how spot compression can help. (A) Digital breast tomosynthesis (DBT) craniocaudal view shows asymmetry (arrow) in medial right breast. (B) DBT spot compression view shows asymmetry does not persist (arrowhead). Lesion classified on DBT without, and DBT with, DBT spot compression view as BI-RADS category 4a and 2 by reader 1, category 4a and 2 by reader 2, and category 4b and 2 by reader 3. Follow-up imaging at one year demonstrated stability of finding, consistent with benignity in present analysis. AJR image. Read more.
Technologist checking a mammogram she had just acquired during a breast screening exam. Technologists scan the patients and radiologists read the exams and create a report for their findings. Image courtesy of Massachusetts General Hospital (MGH).
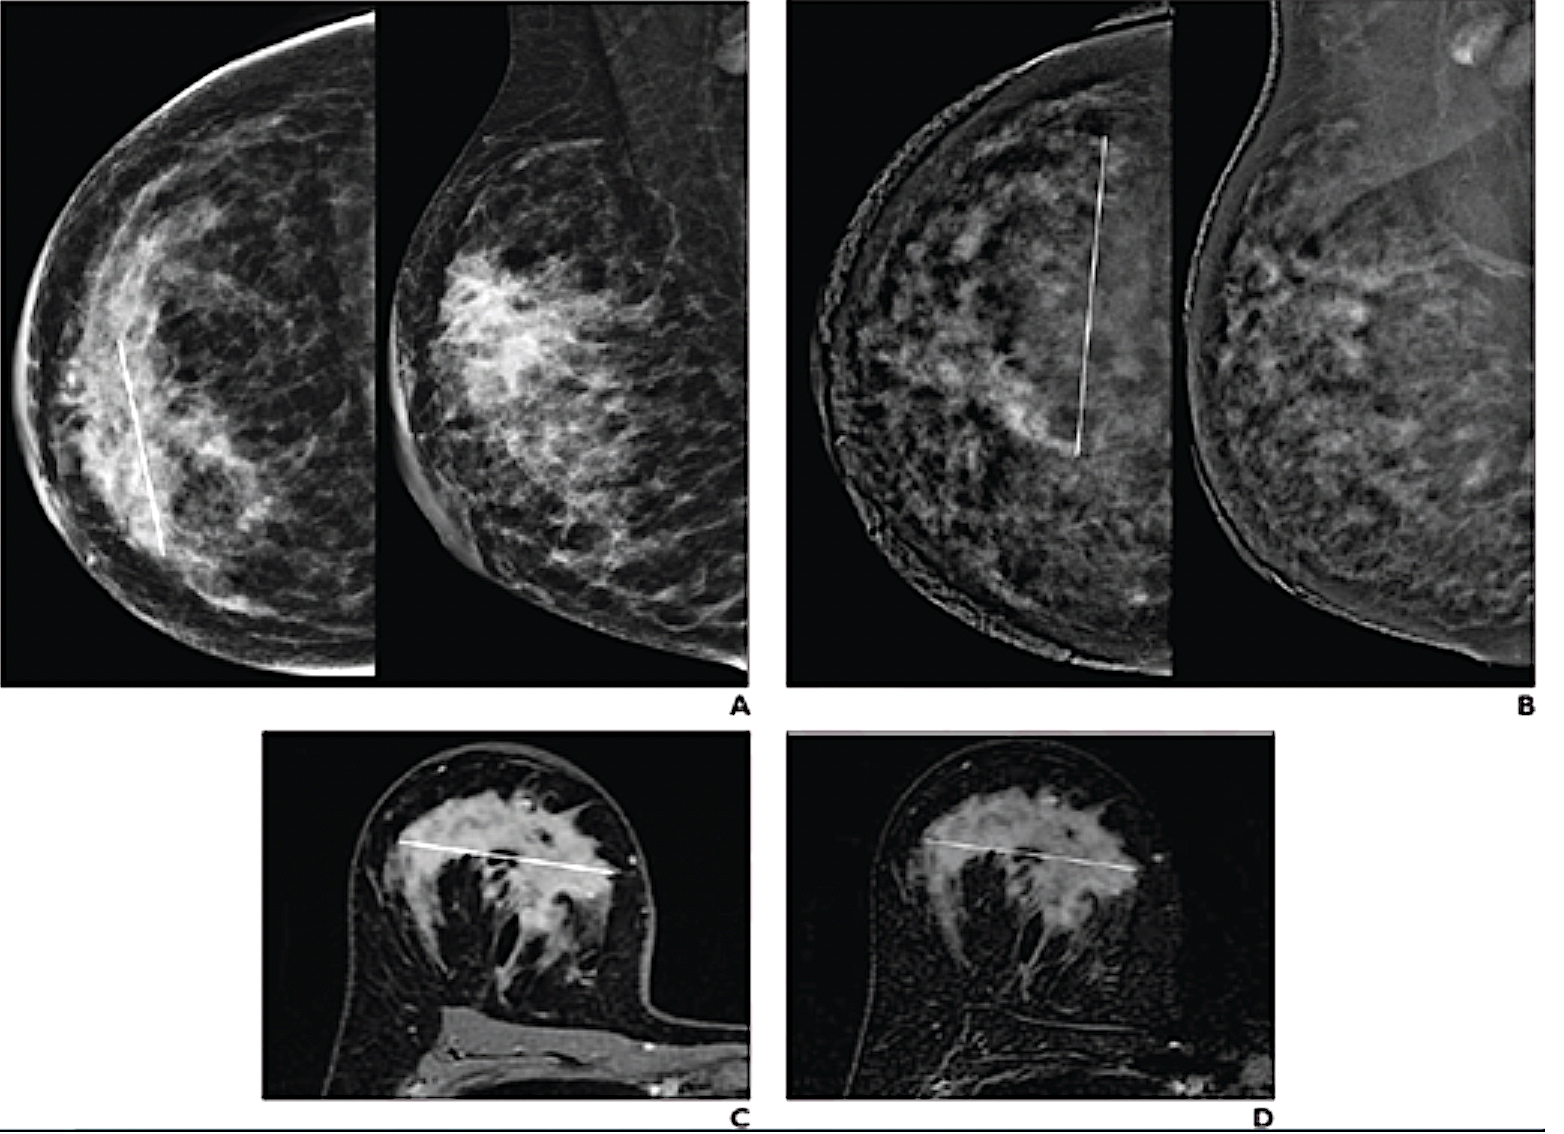
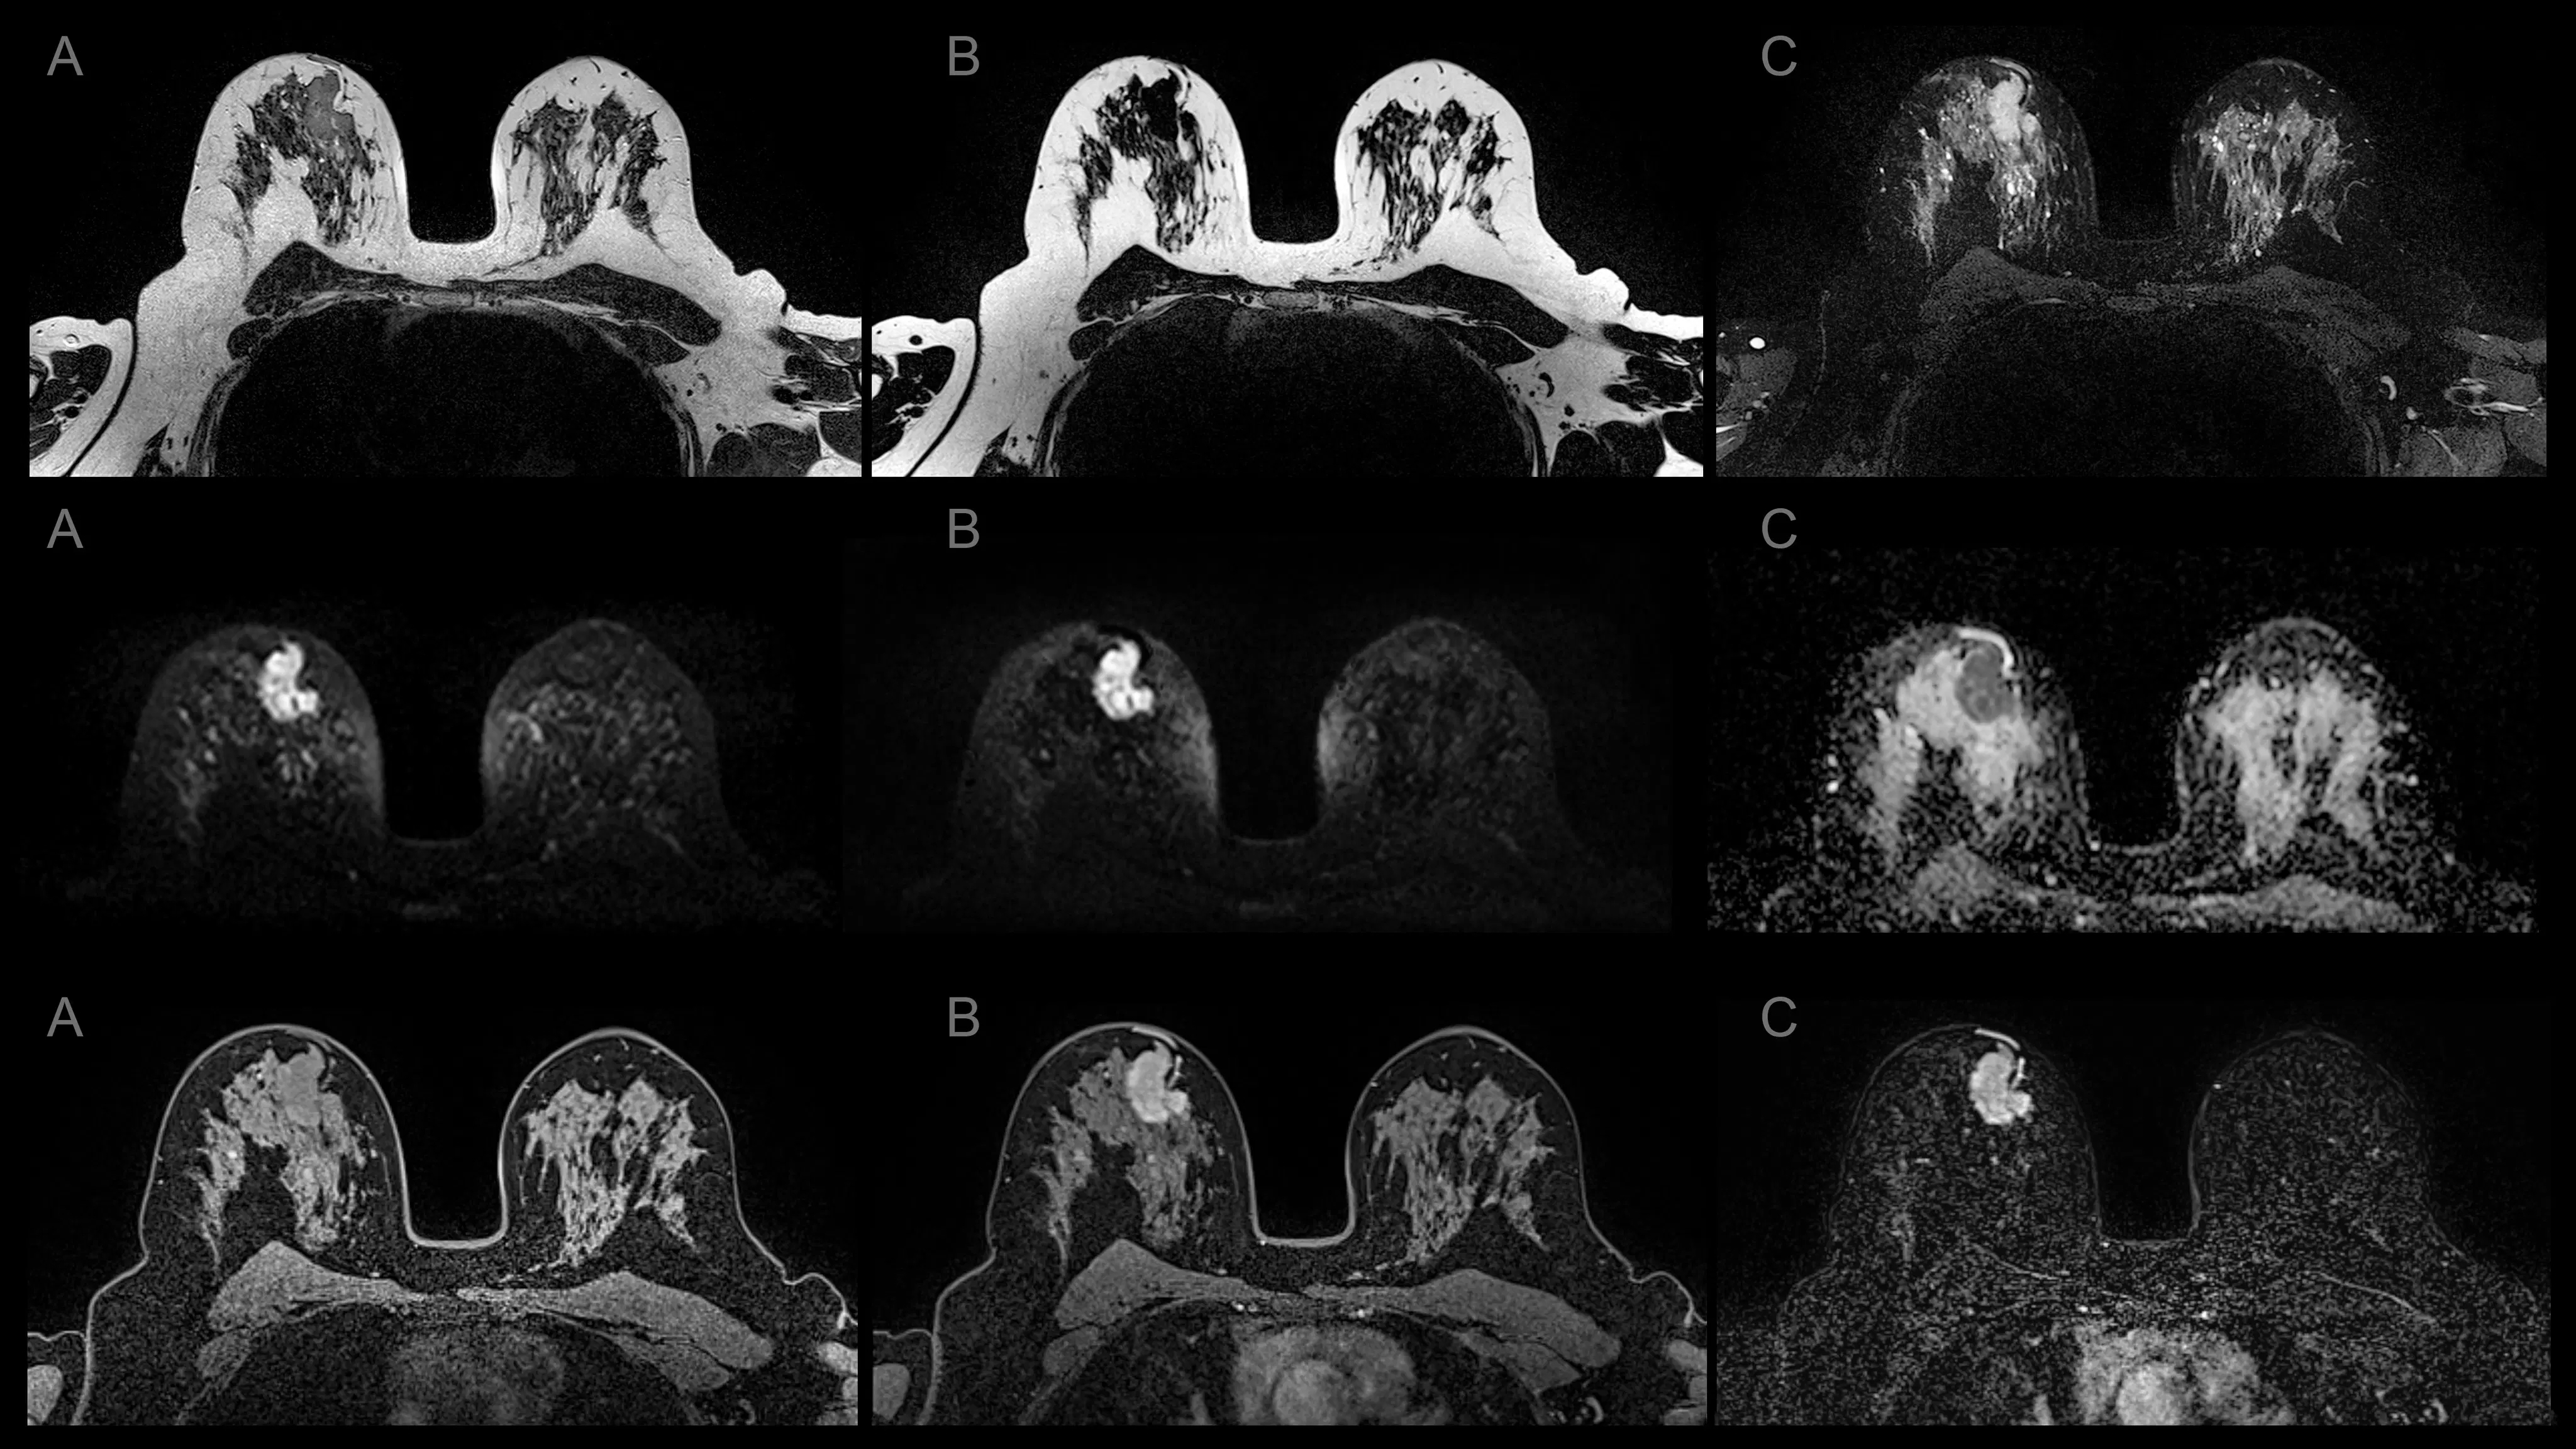
Mammography vs. breast MRI from a 41-year-old woman with invasive ductal carcinoma (G2, luminal B) of right breast. (A) CC (left) and MLO (right) low-energy images from pre-NAT CEM performed on 25th day of luteal phase show a 60 mm architectural distortion (line on CC) in the central portion of the right breast. (B) CC (left) and MLO (right) recombined images from pre-NAT CEM show marked background parenchymal enhancement, hindering lesion evaluation; 90 mm non-mass regional enhancement (line) was described. (C) Axial fat-saturated T1-weighted unenhanced MRI shows a 70 mm hypointense irregular mass (line) with non circumscribed margins in the central portion of right breast. D, Axial fat-saturated T1-weighted post-contrast MR images show corresponding fast initial enhancement (line) with delayed plateau. Image courtesy of AJR. Read more.
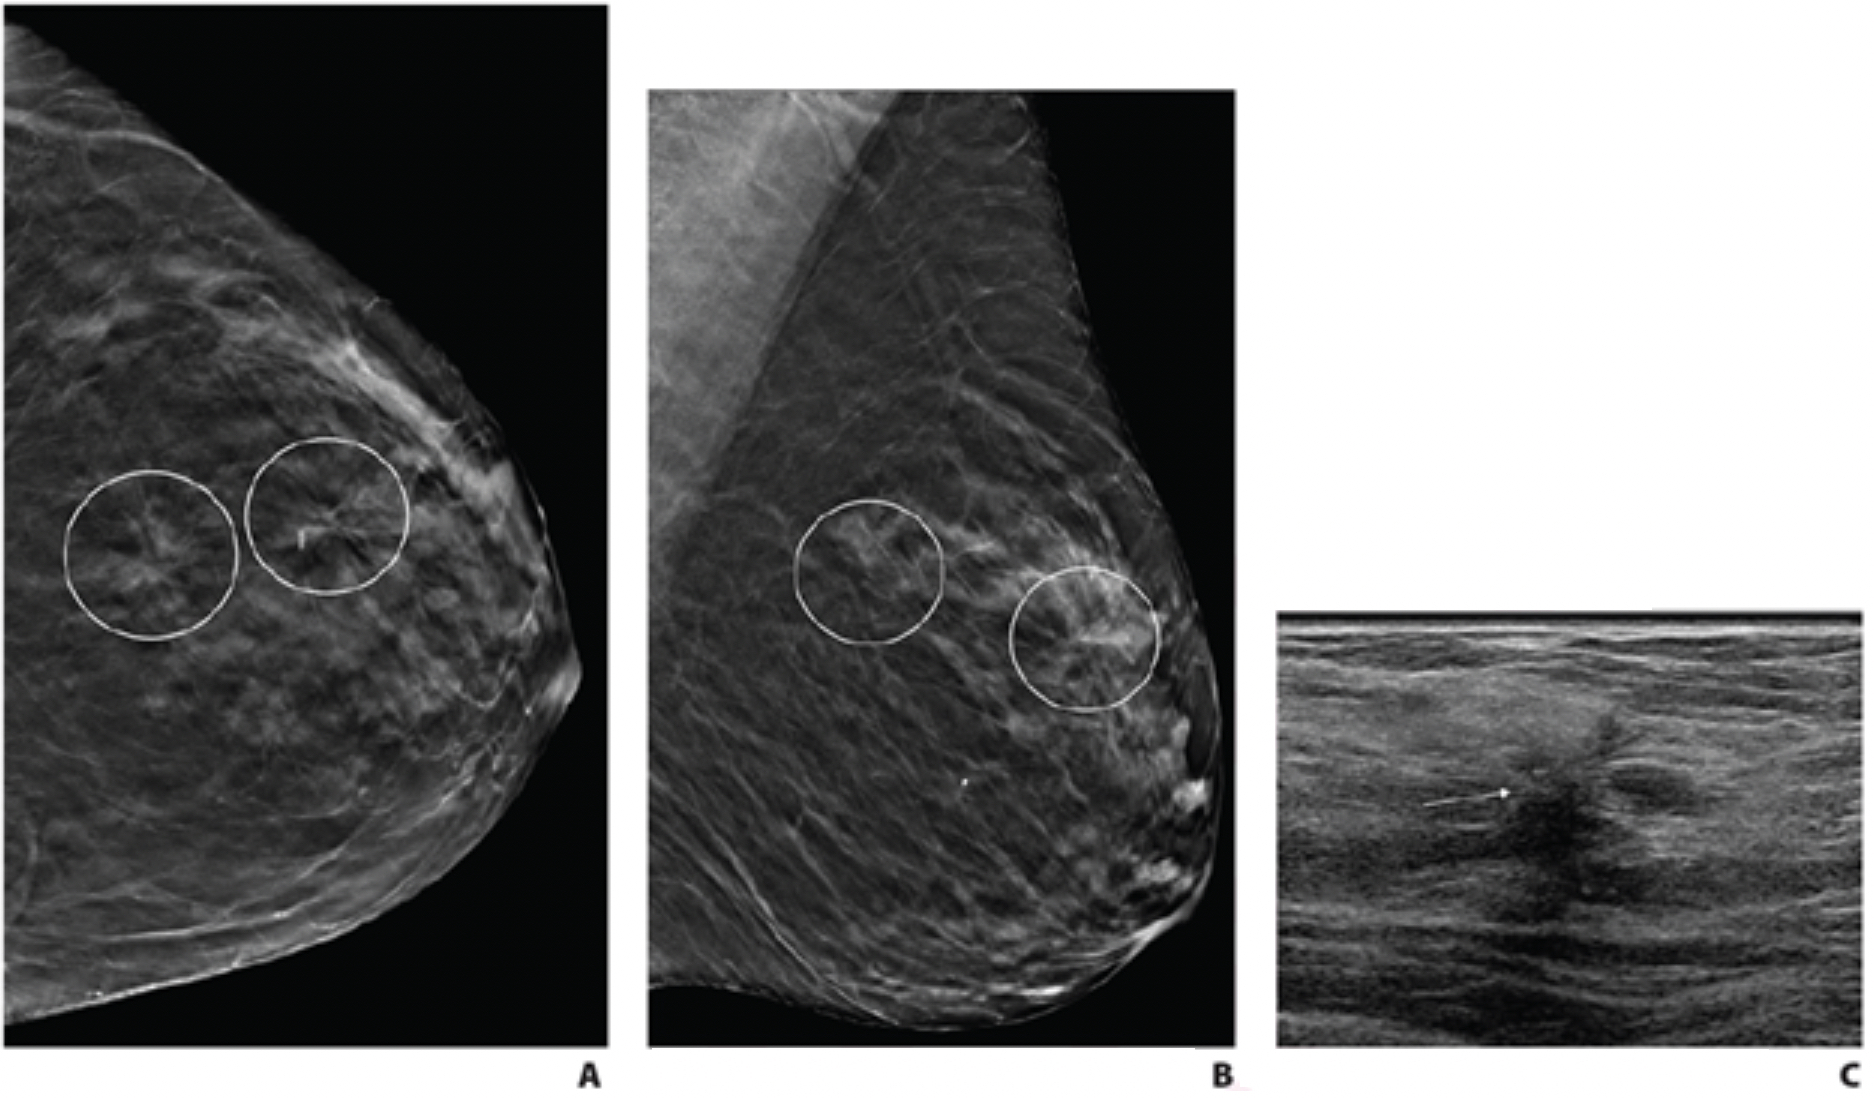
Single vs. multiple architectural distortions on digital breast tomosynthesis (DBT). (A) Craniocaudal, and (B) mediolateral oblique digital breast tomosynthesis images demonstrate two areas of AD in upper outer left breast (circles) that persisted on additional diagnostic tomosynthesis images (not shown). (C) Transverse greyscale ultrasound image of upper outer breast shows irregular hypoechoic mass with associated AD at 12:30 (arrow), corresponding to posterior AD. No ultrasound correlate was identified for anterior AD. Ultrasound-guided biopsy of posterior AD revealed malignancy (invasive lobular carcinoma). Tomosynthesis-guided biopsy of anterior AD yielded benign pathology (stromal fibrosis). Image courtesy of AJR. Read more.
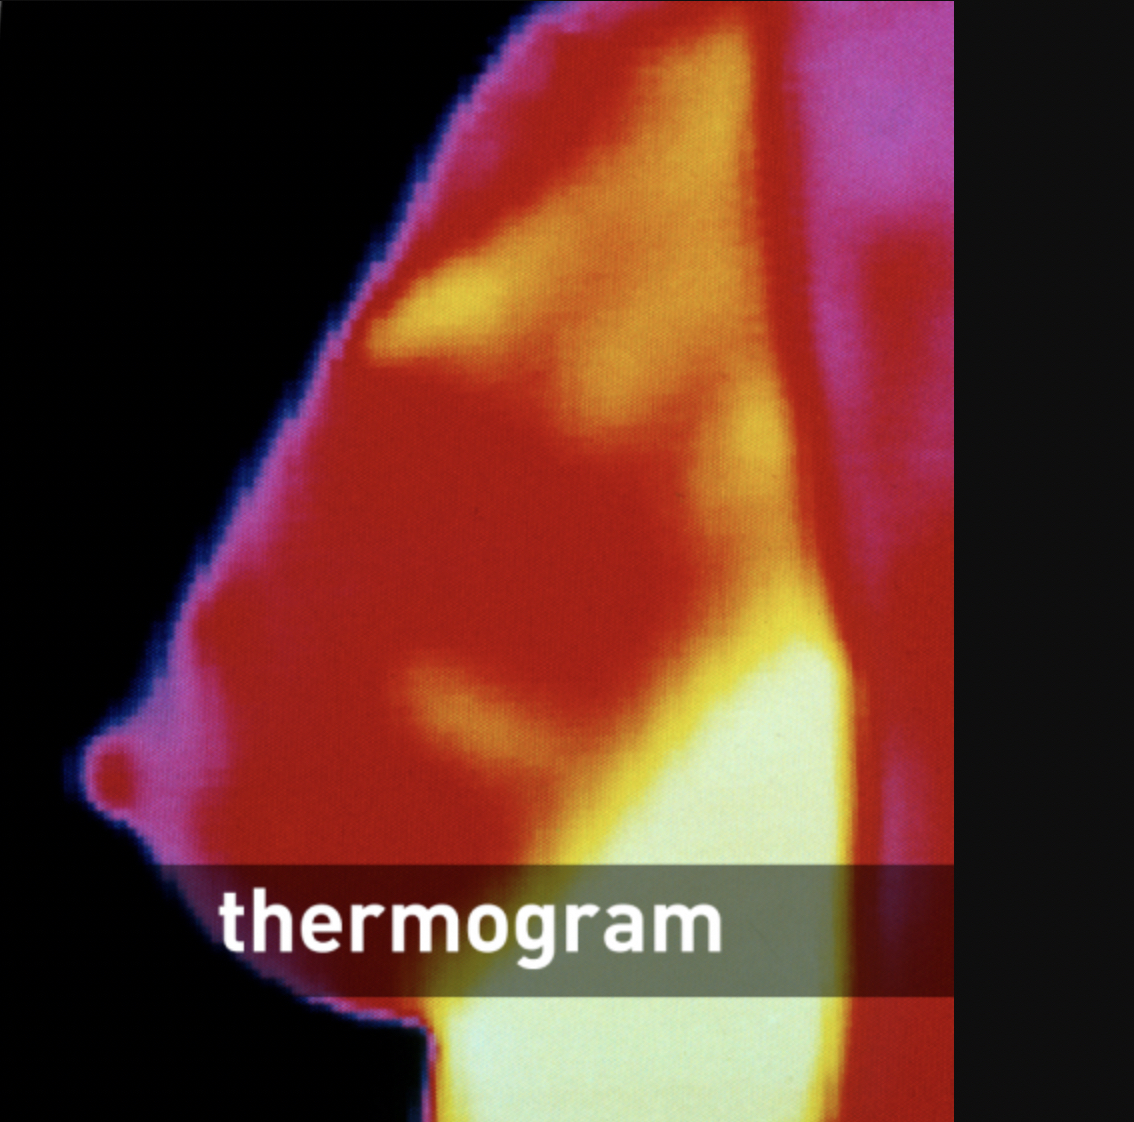
Example of a breast thermogram, which is a thermography image produced by an infrared image showing heat patterns on or near the surface of the body. This image is from the FDA as part of a warning from 2021 to patients and clinicians that thermography is not a proven alternative to mammography. It was shared after the FDA received several reports of some breast imaging centers using this method. The FDA said thermography has not been shown to be effective as a standalone test for either breast cancer screening or diagnosis in detecting early stage breast cancer. The agency said mammography is still the most effective primary screening method for detecting breast cancer in its early, most treatable stages. Read more.
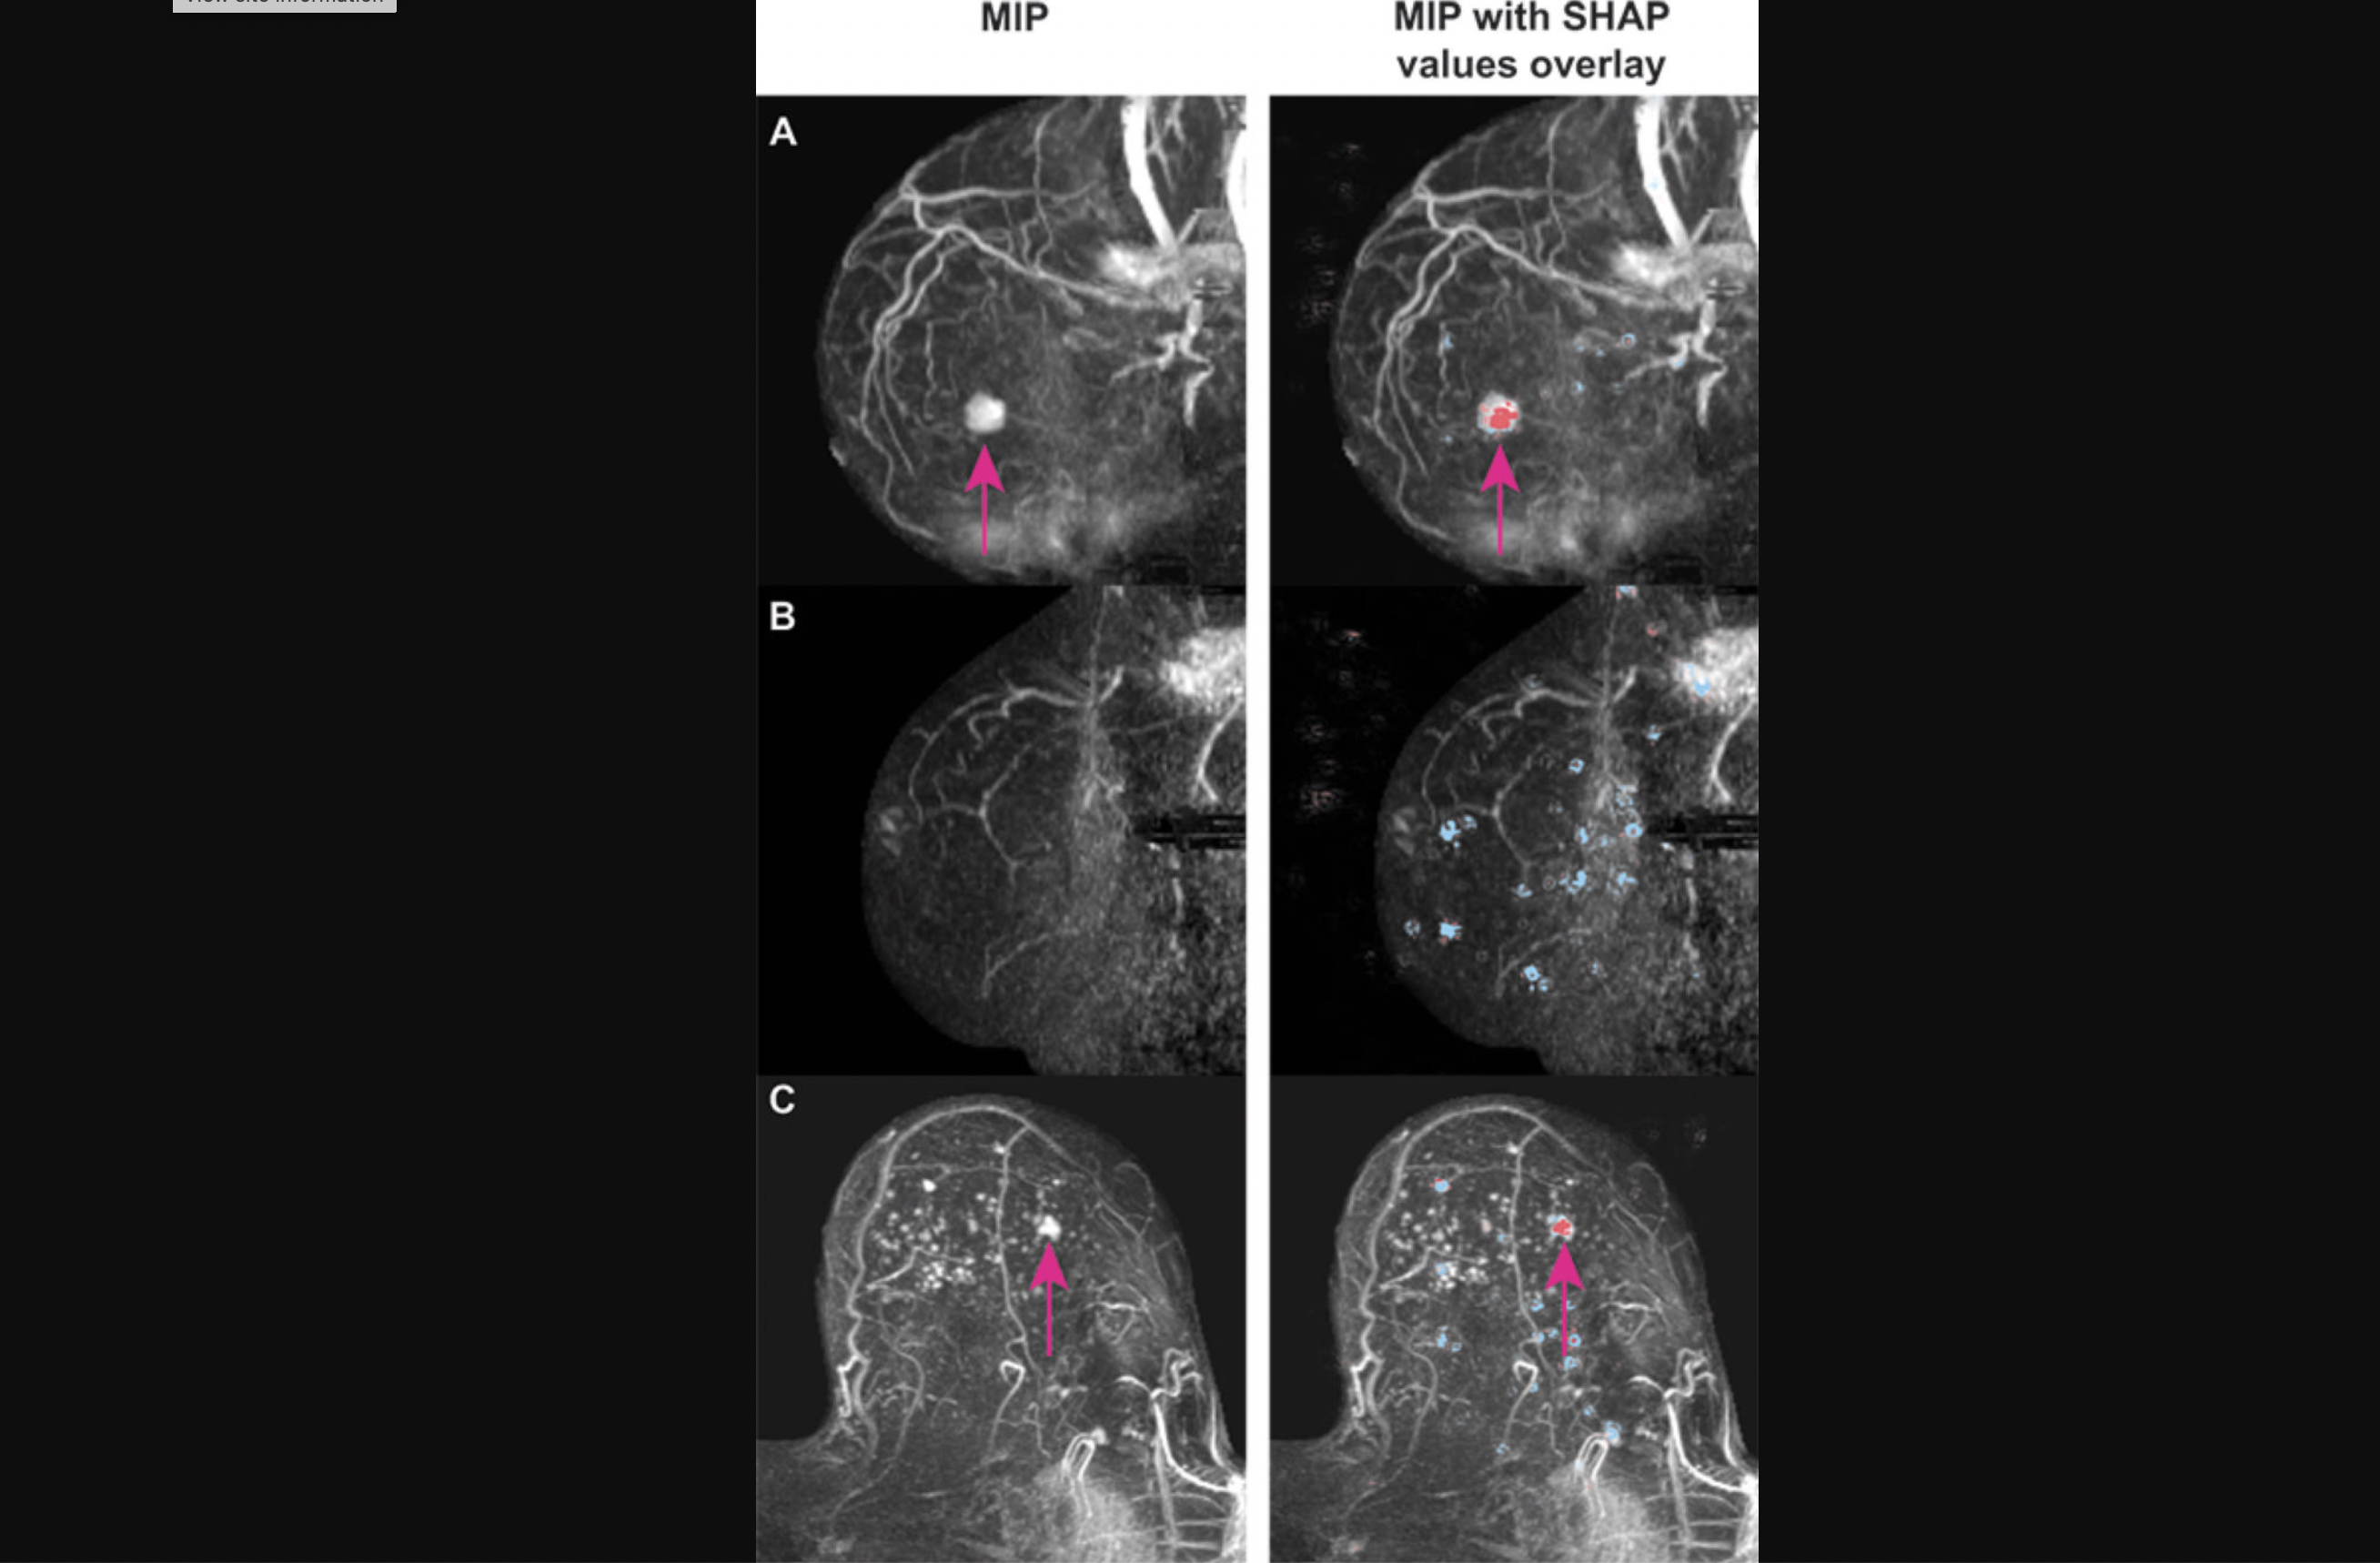
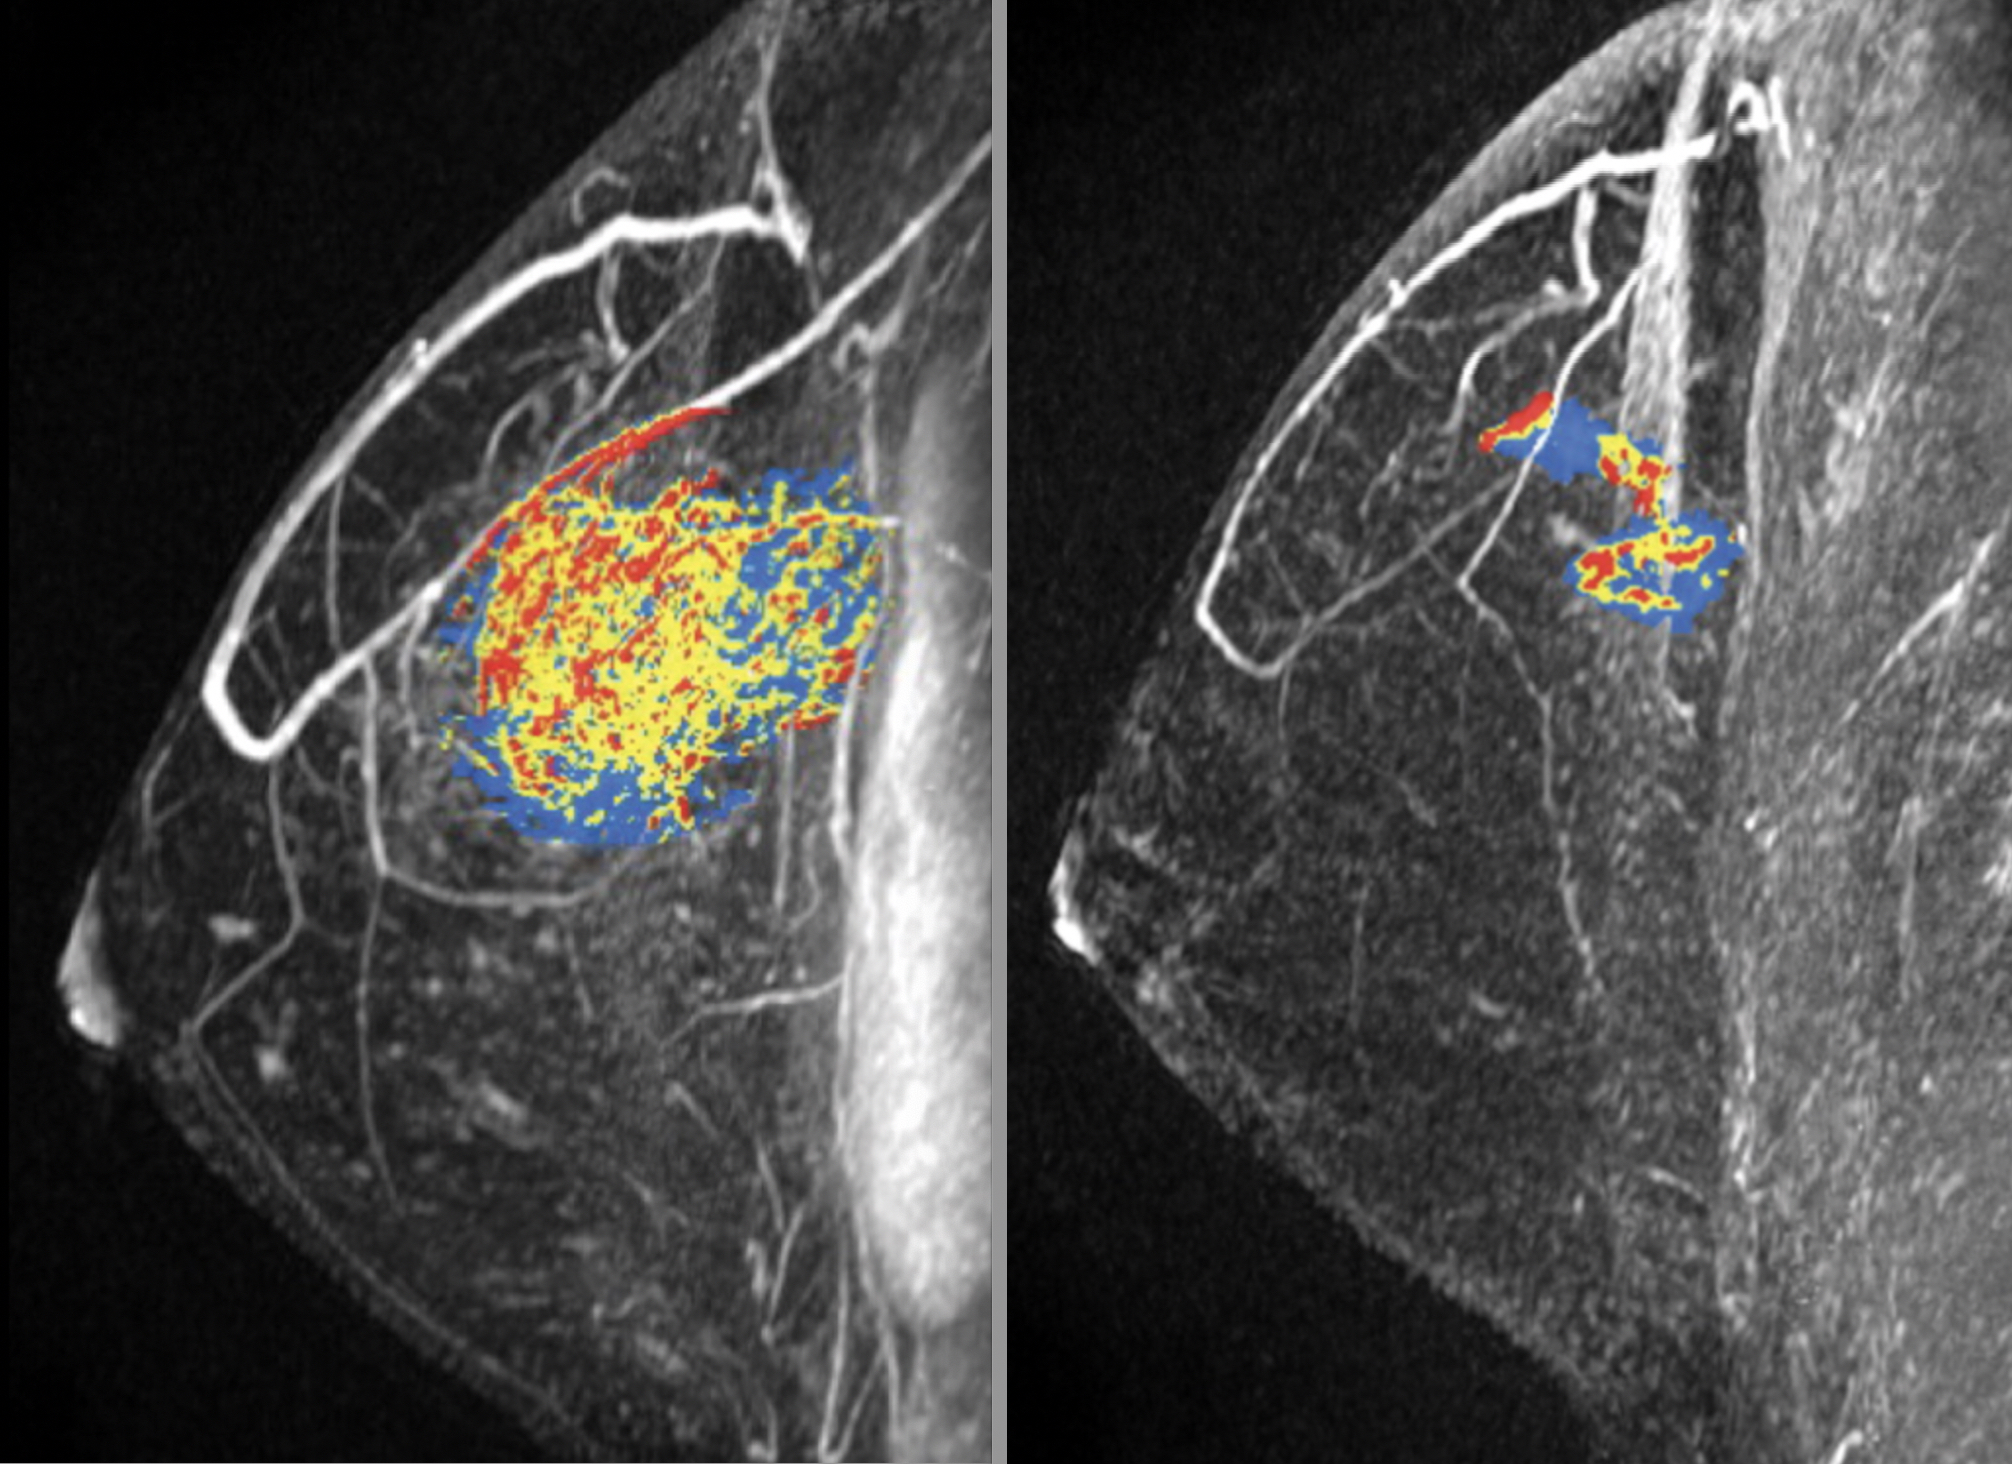
Examples of artificial intelligence (AI) deep Shapley additive explanations (SHAP) overlay on breast MRI. Maximum intensity projection (MIP) images are on left, and MIP images with the SHAP overlay are on right. Positive SHAP values (red) show areas that contribute to a high probability of lesion presence, negative SHAP values (blue) show locations with reduced probability. (A) Sagittal MIP images of contrast-enhanced breast MRI scan of an invasive ductal carcinoma in a 57-year-old woman with Breast Imaging Reporting and Data System (BI-RADS) category 4. The deep learning (DL) model yielded a probability of lesion presence of 90%. Positive SHAP values (red) are shown to coincide with the location of the lesion (arrows). (B) Sagittal MIP images of contrast-enhanced breast MRI scan of a breast without lesions in a 53-year-old woman with BI-RADS 1 score. The DL model yielded a probability of lesion presence of 11%. Negative SHAP values (blue) are diffusely distributed in the breast region. (C) Transverse MIP images of contrast-enhanced breast MRI scan of a ductal carcinoma in situ in a 65-year-old woman with BI-RADS 4 score. The DL model yielded a probability of lesion presence of 32%—the lowest probability value among all breasts with malignant disease in our study. Positive SHAP values (red) are shown to coincide with the location of the lesion (arrows). Read more on this study.
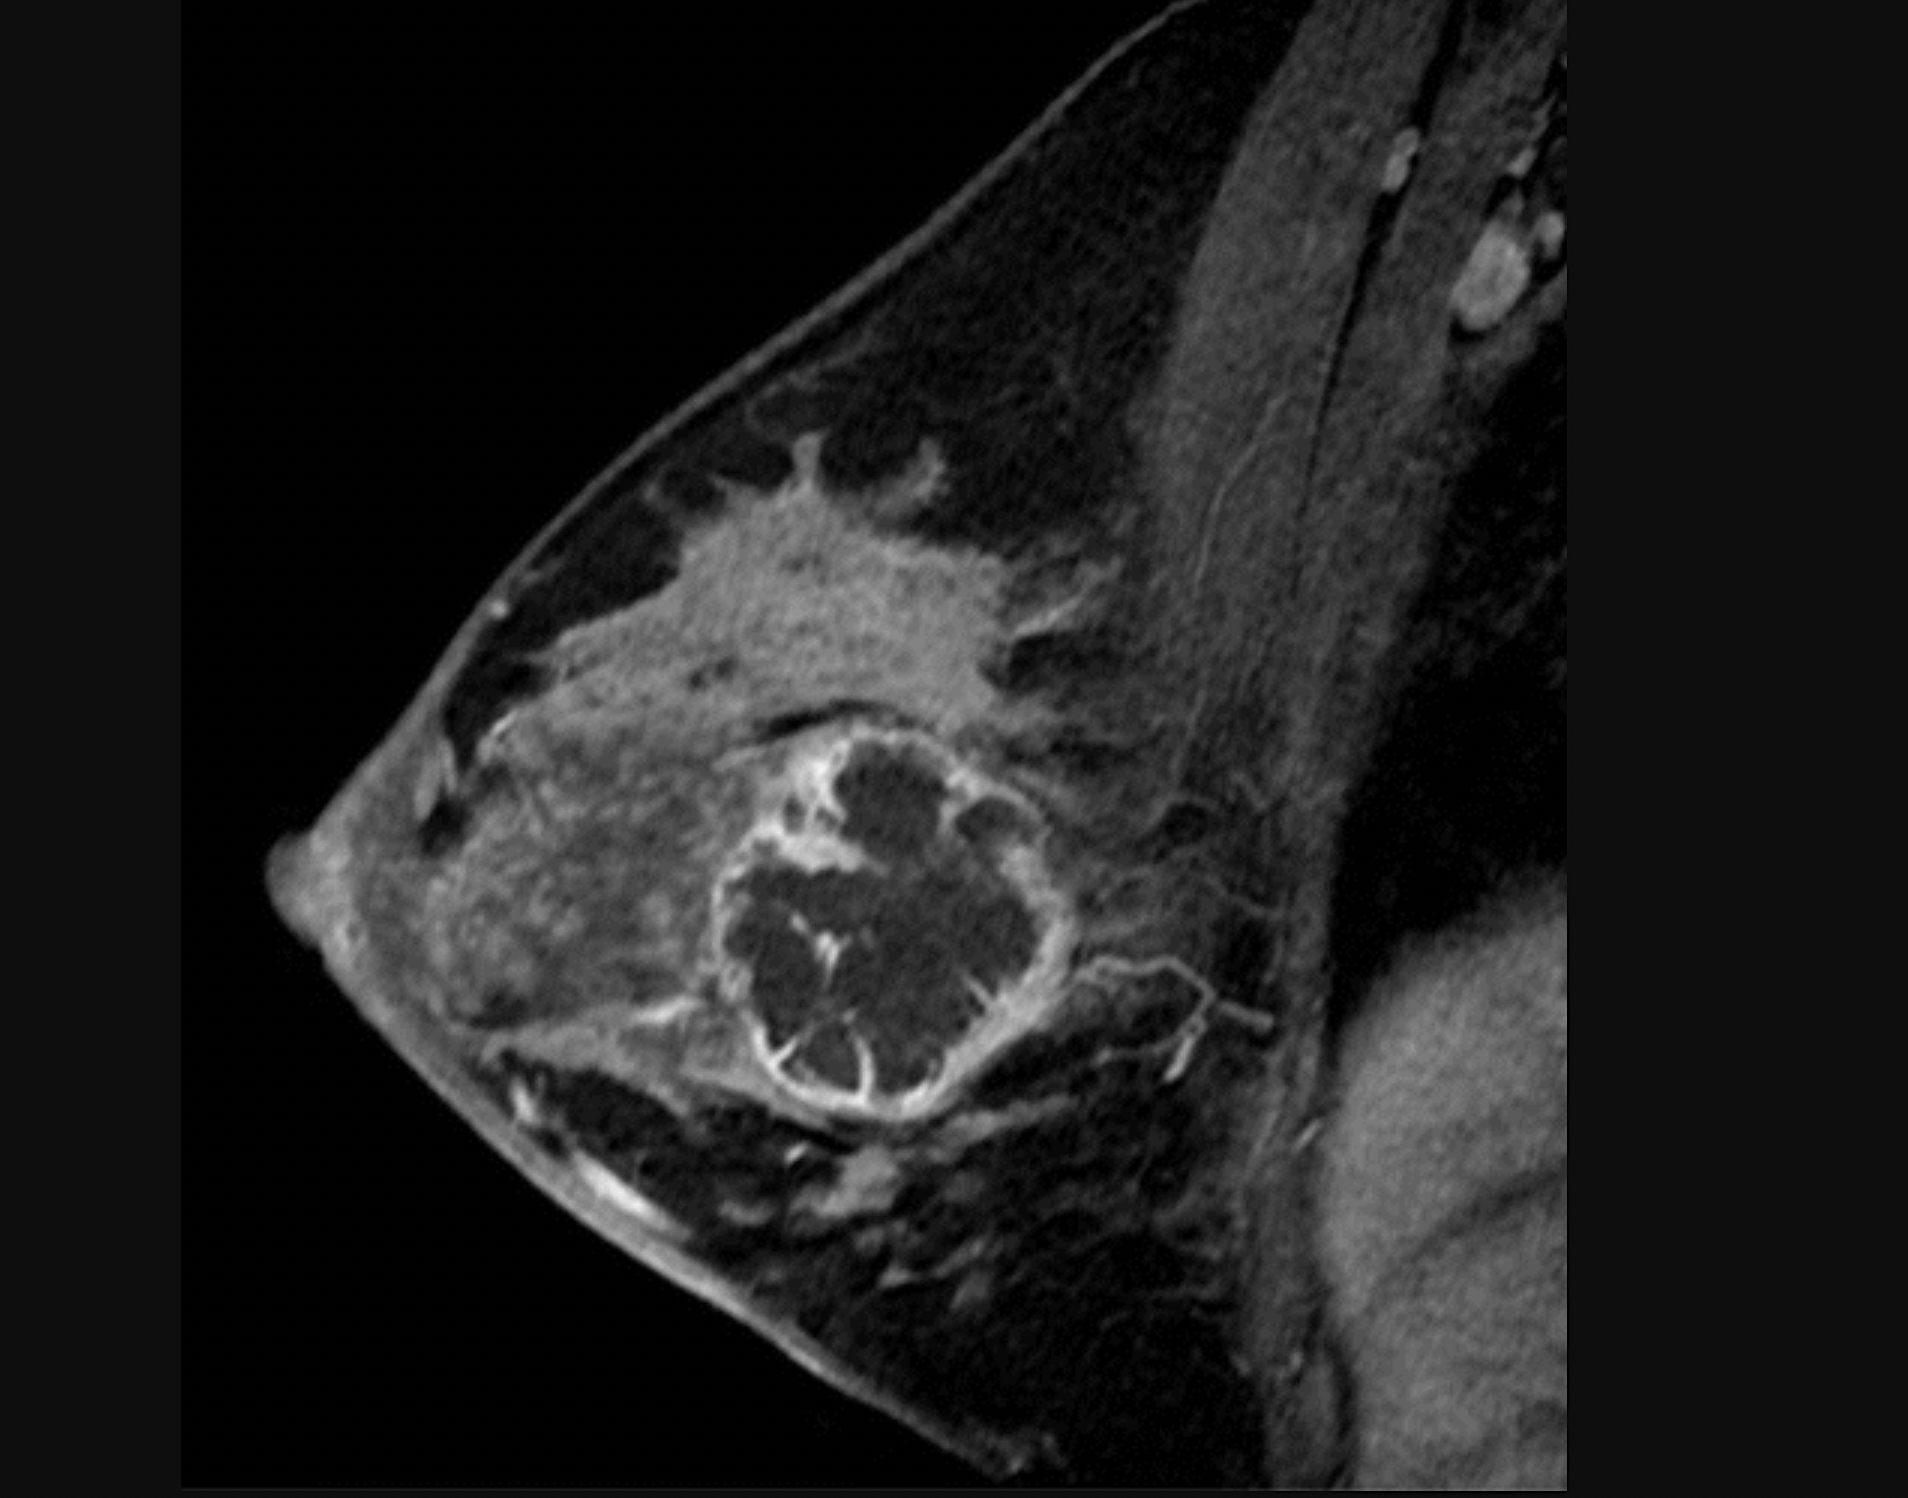
Sagittal images from breast MRI in a 36-year-old woman with an invasive ductal carcinoma. Image from pre-chemotherapy contrast-enhanced T1-weighted MRI shows a round, rim-enhancing mass. This subtraction image shows the maximal diameter of the mass was measured up to 5.4 cm. Read more. RSNA image.
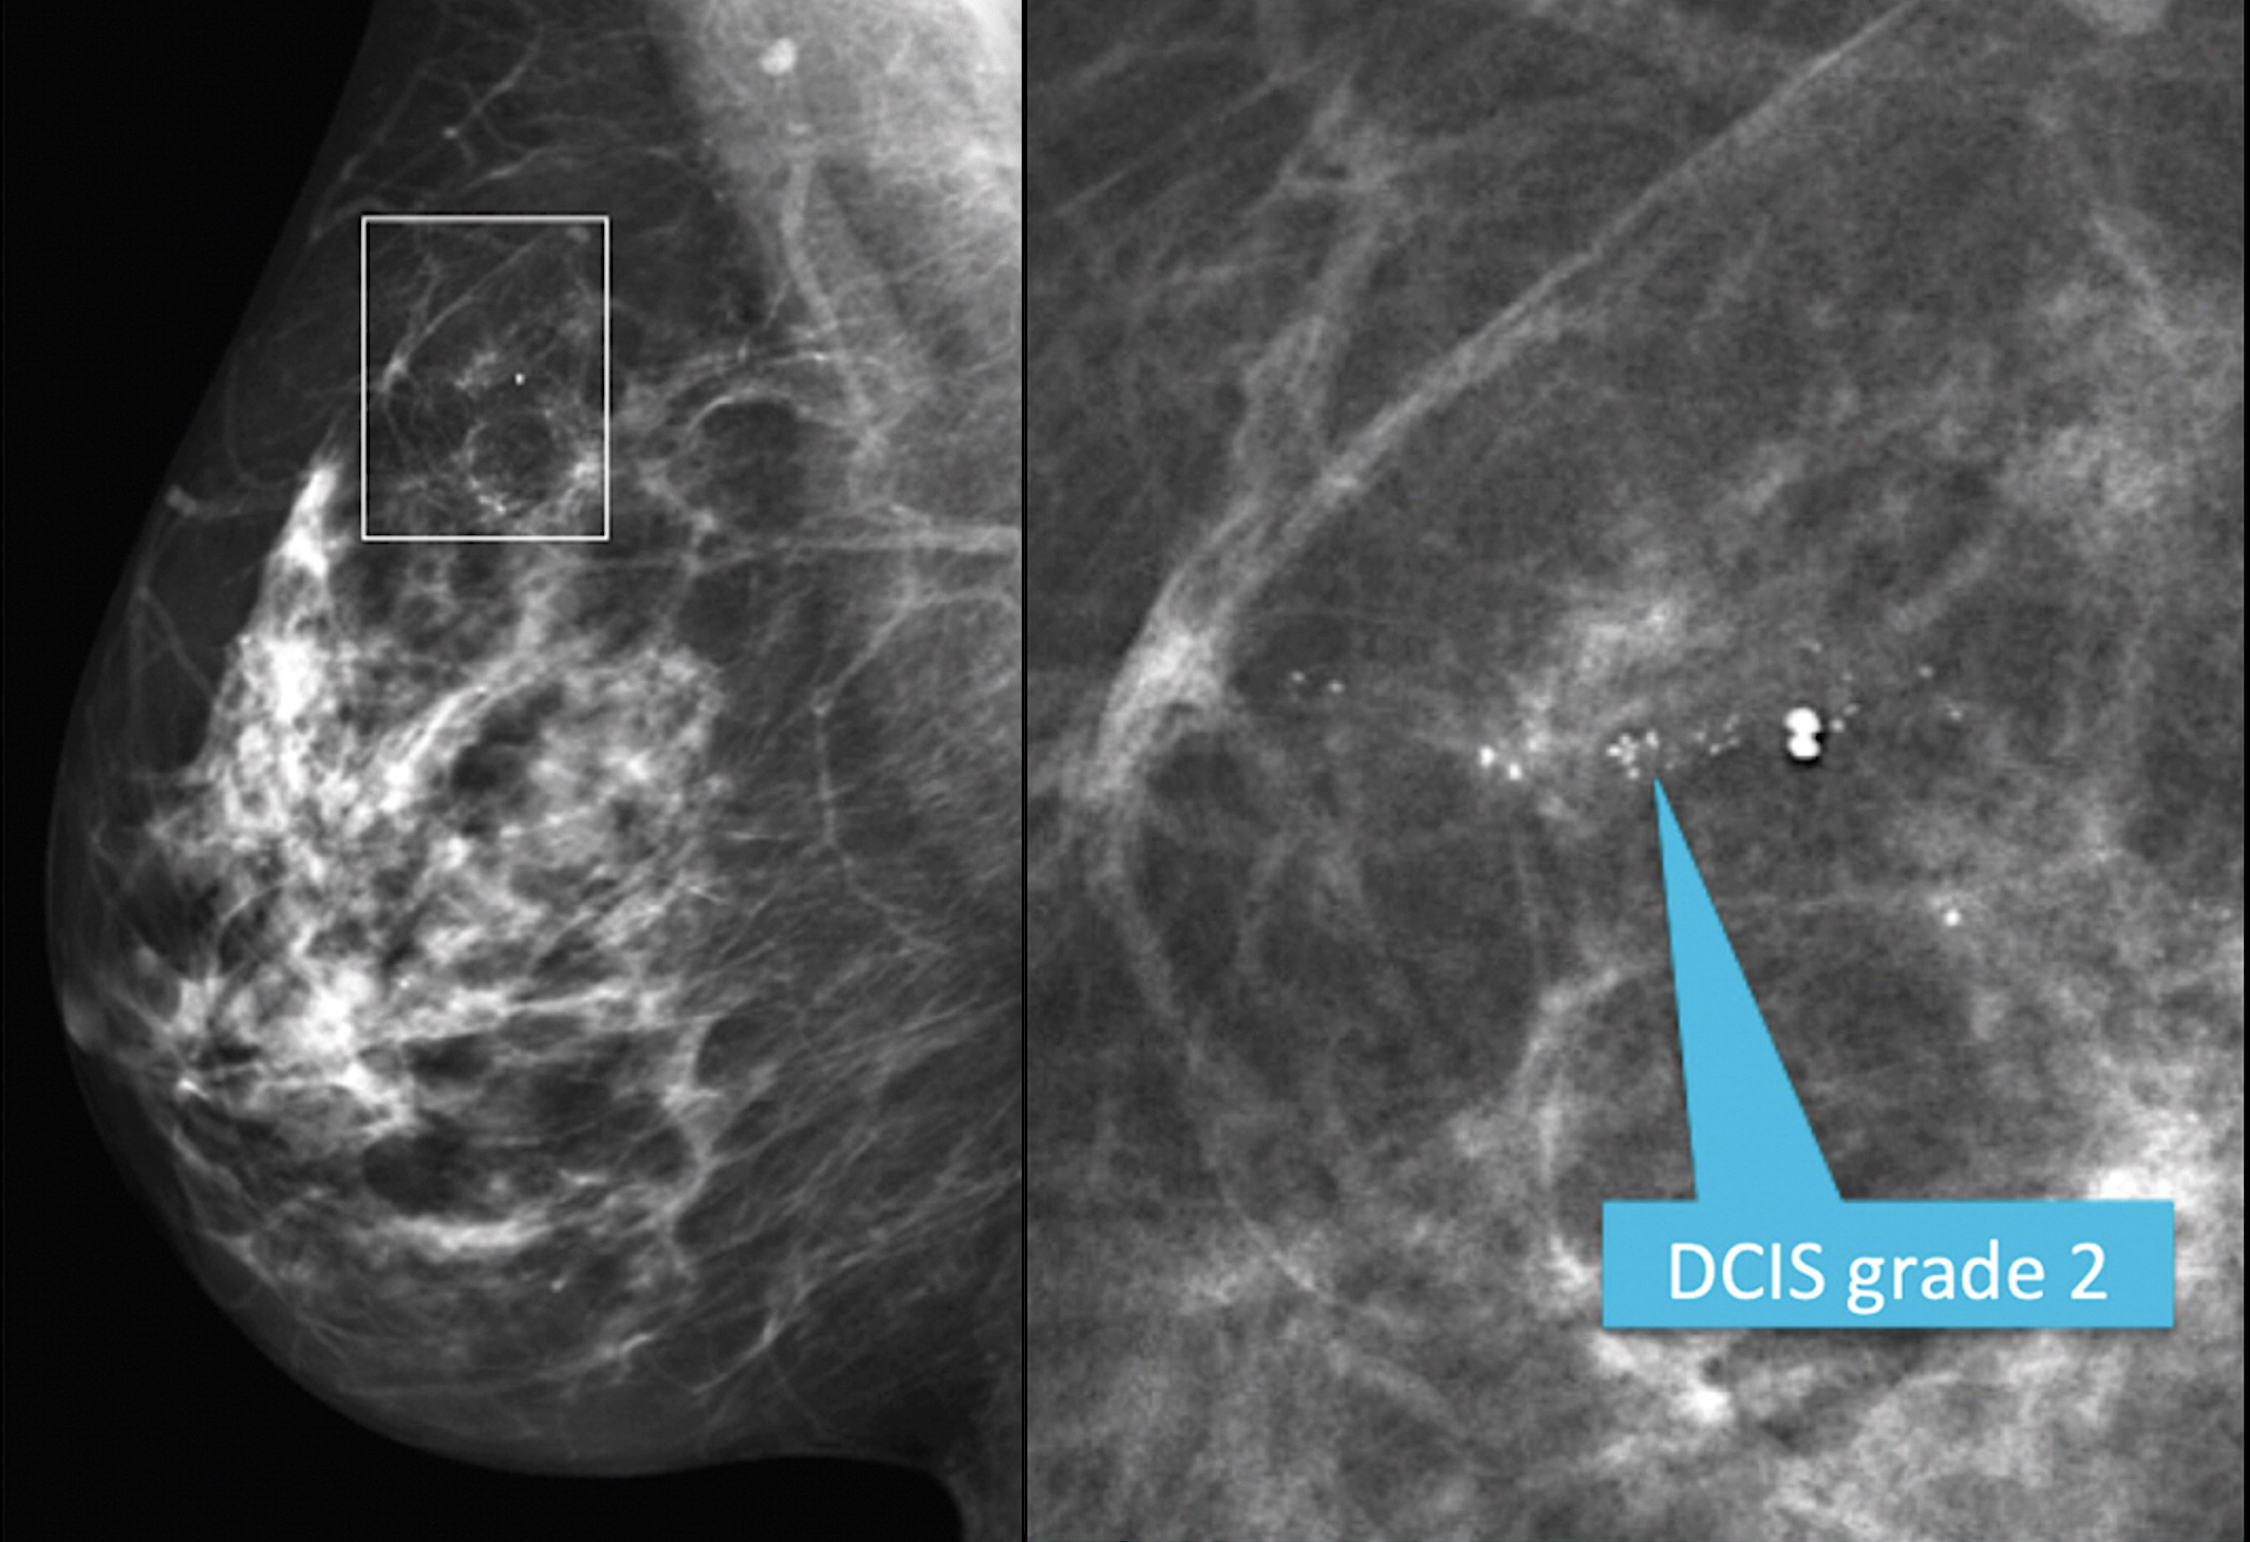
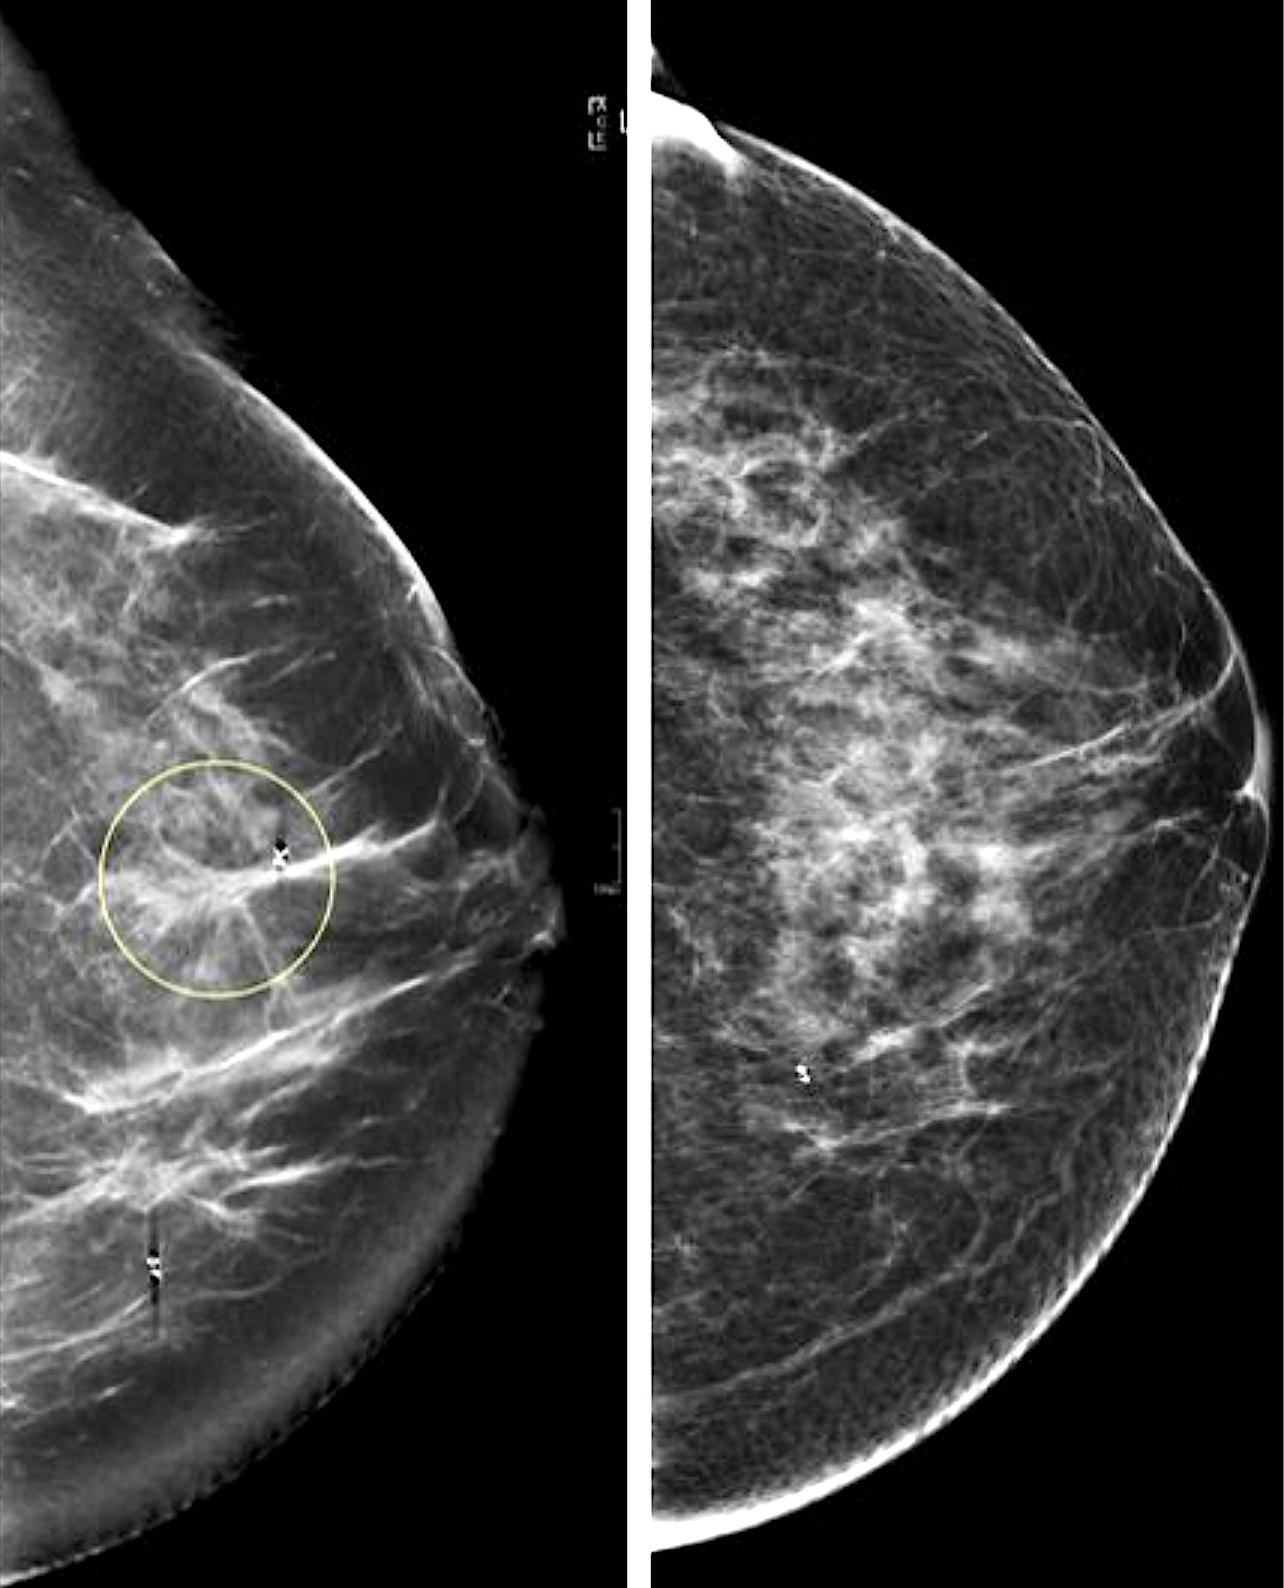
Mediolateral oblique view from a screening mammogram in a 54-year-old woman shows a small cluster of microcalcifications in the upper outer quadrant of the right breast. The right image shows a detailed spot magnification view of the calcifications. Stereotactic biopsy revealed grade 2 ductal carcinoma in situ (DCIS). See the next image for an MRI view. Read more. RSNA image.
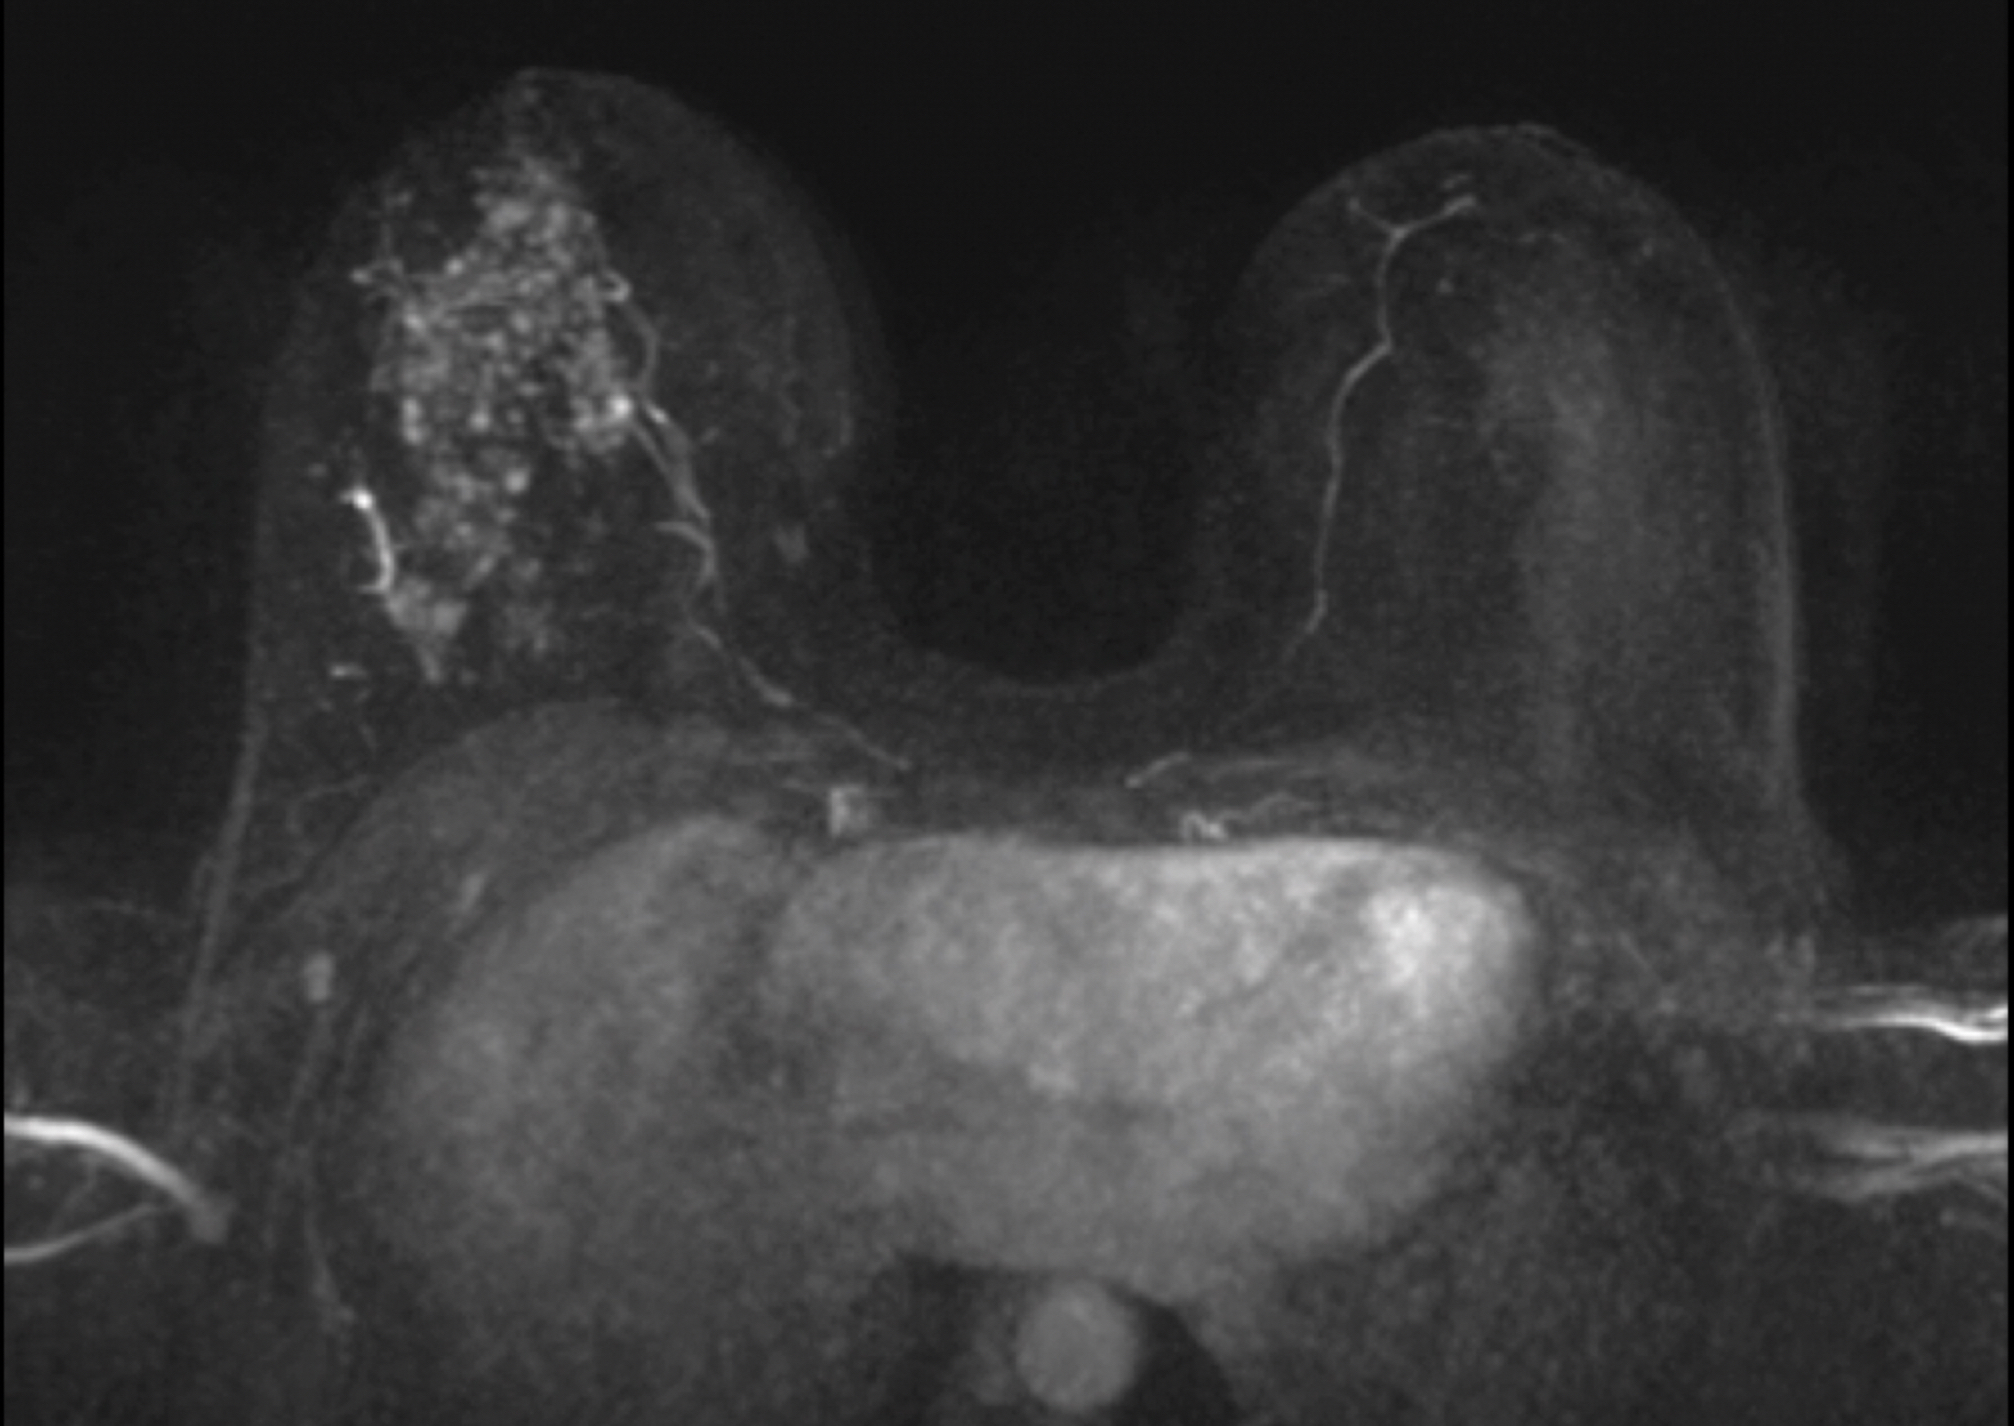
Breast MRI image of a 54-year-old woman shows a small cluster of microcalcifications in the upper outer quadrant of the right breast. Stereotactic biopsy revealed grade 2 ductal carcinoma in situ (DCIS). This is a maximum intensity projection (MIP) from the staging MRI that shows a large area of segmental clumped non-mass enhancement in the right breast, representing the actual extent of disease. Read more. RSNA image.
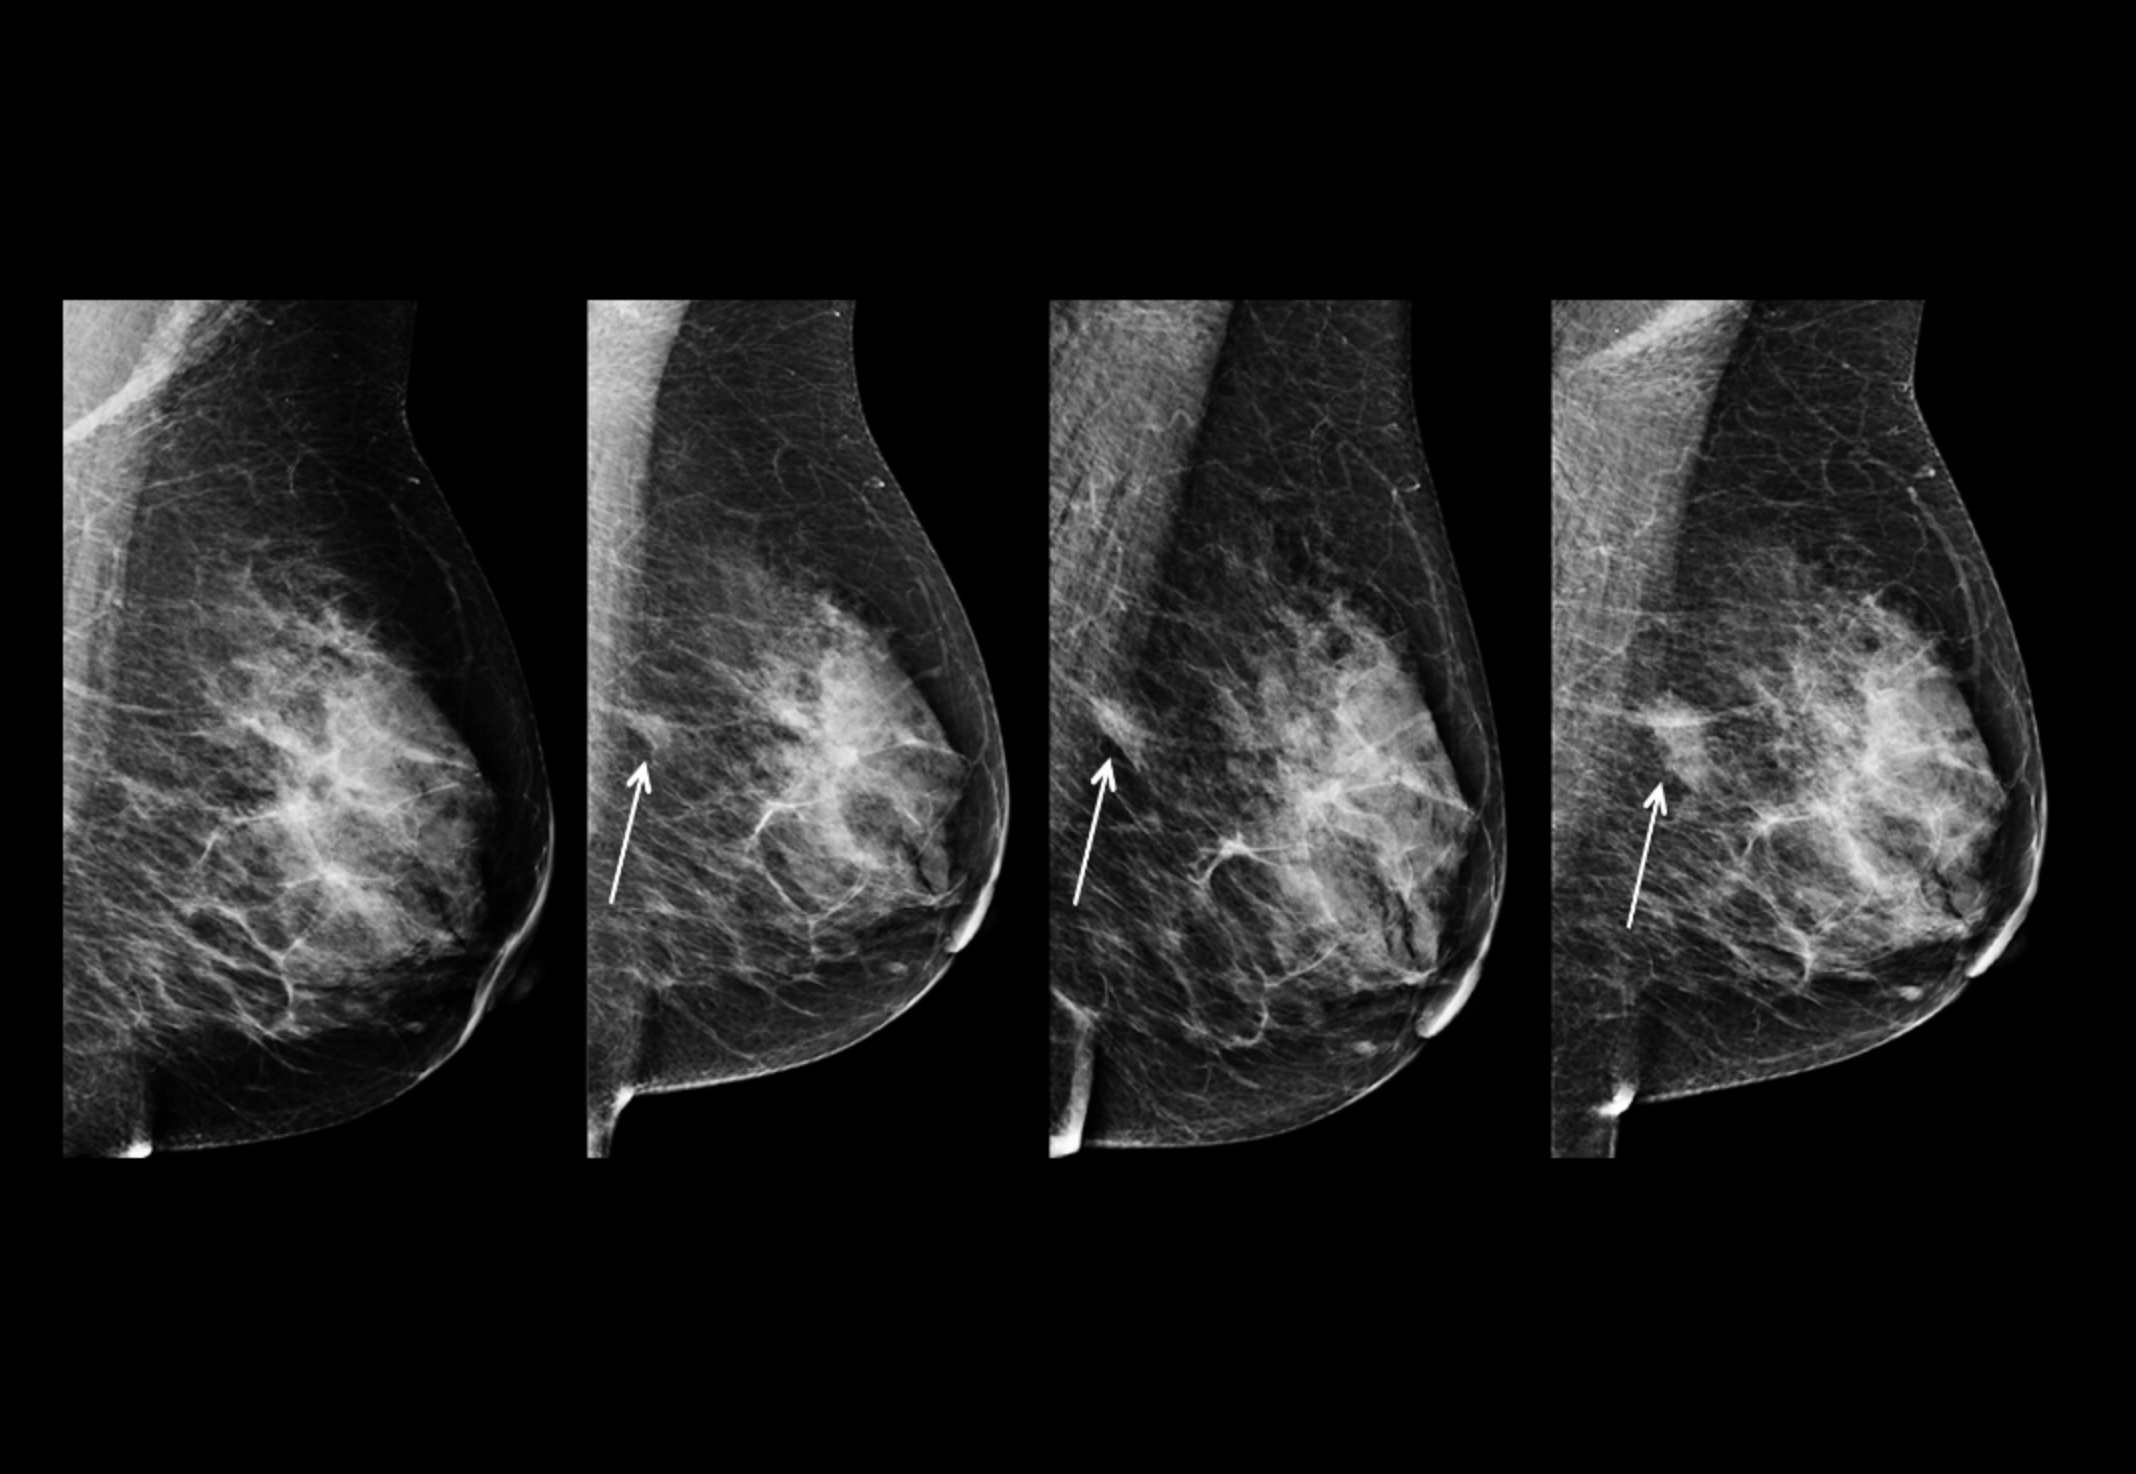
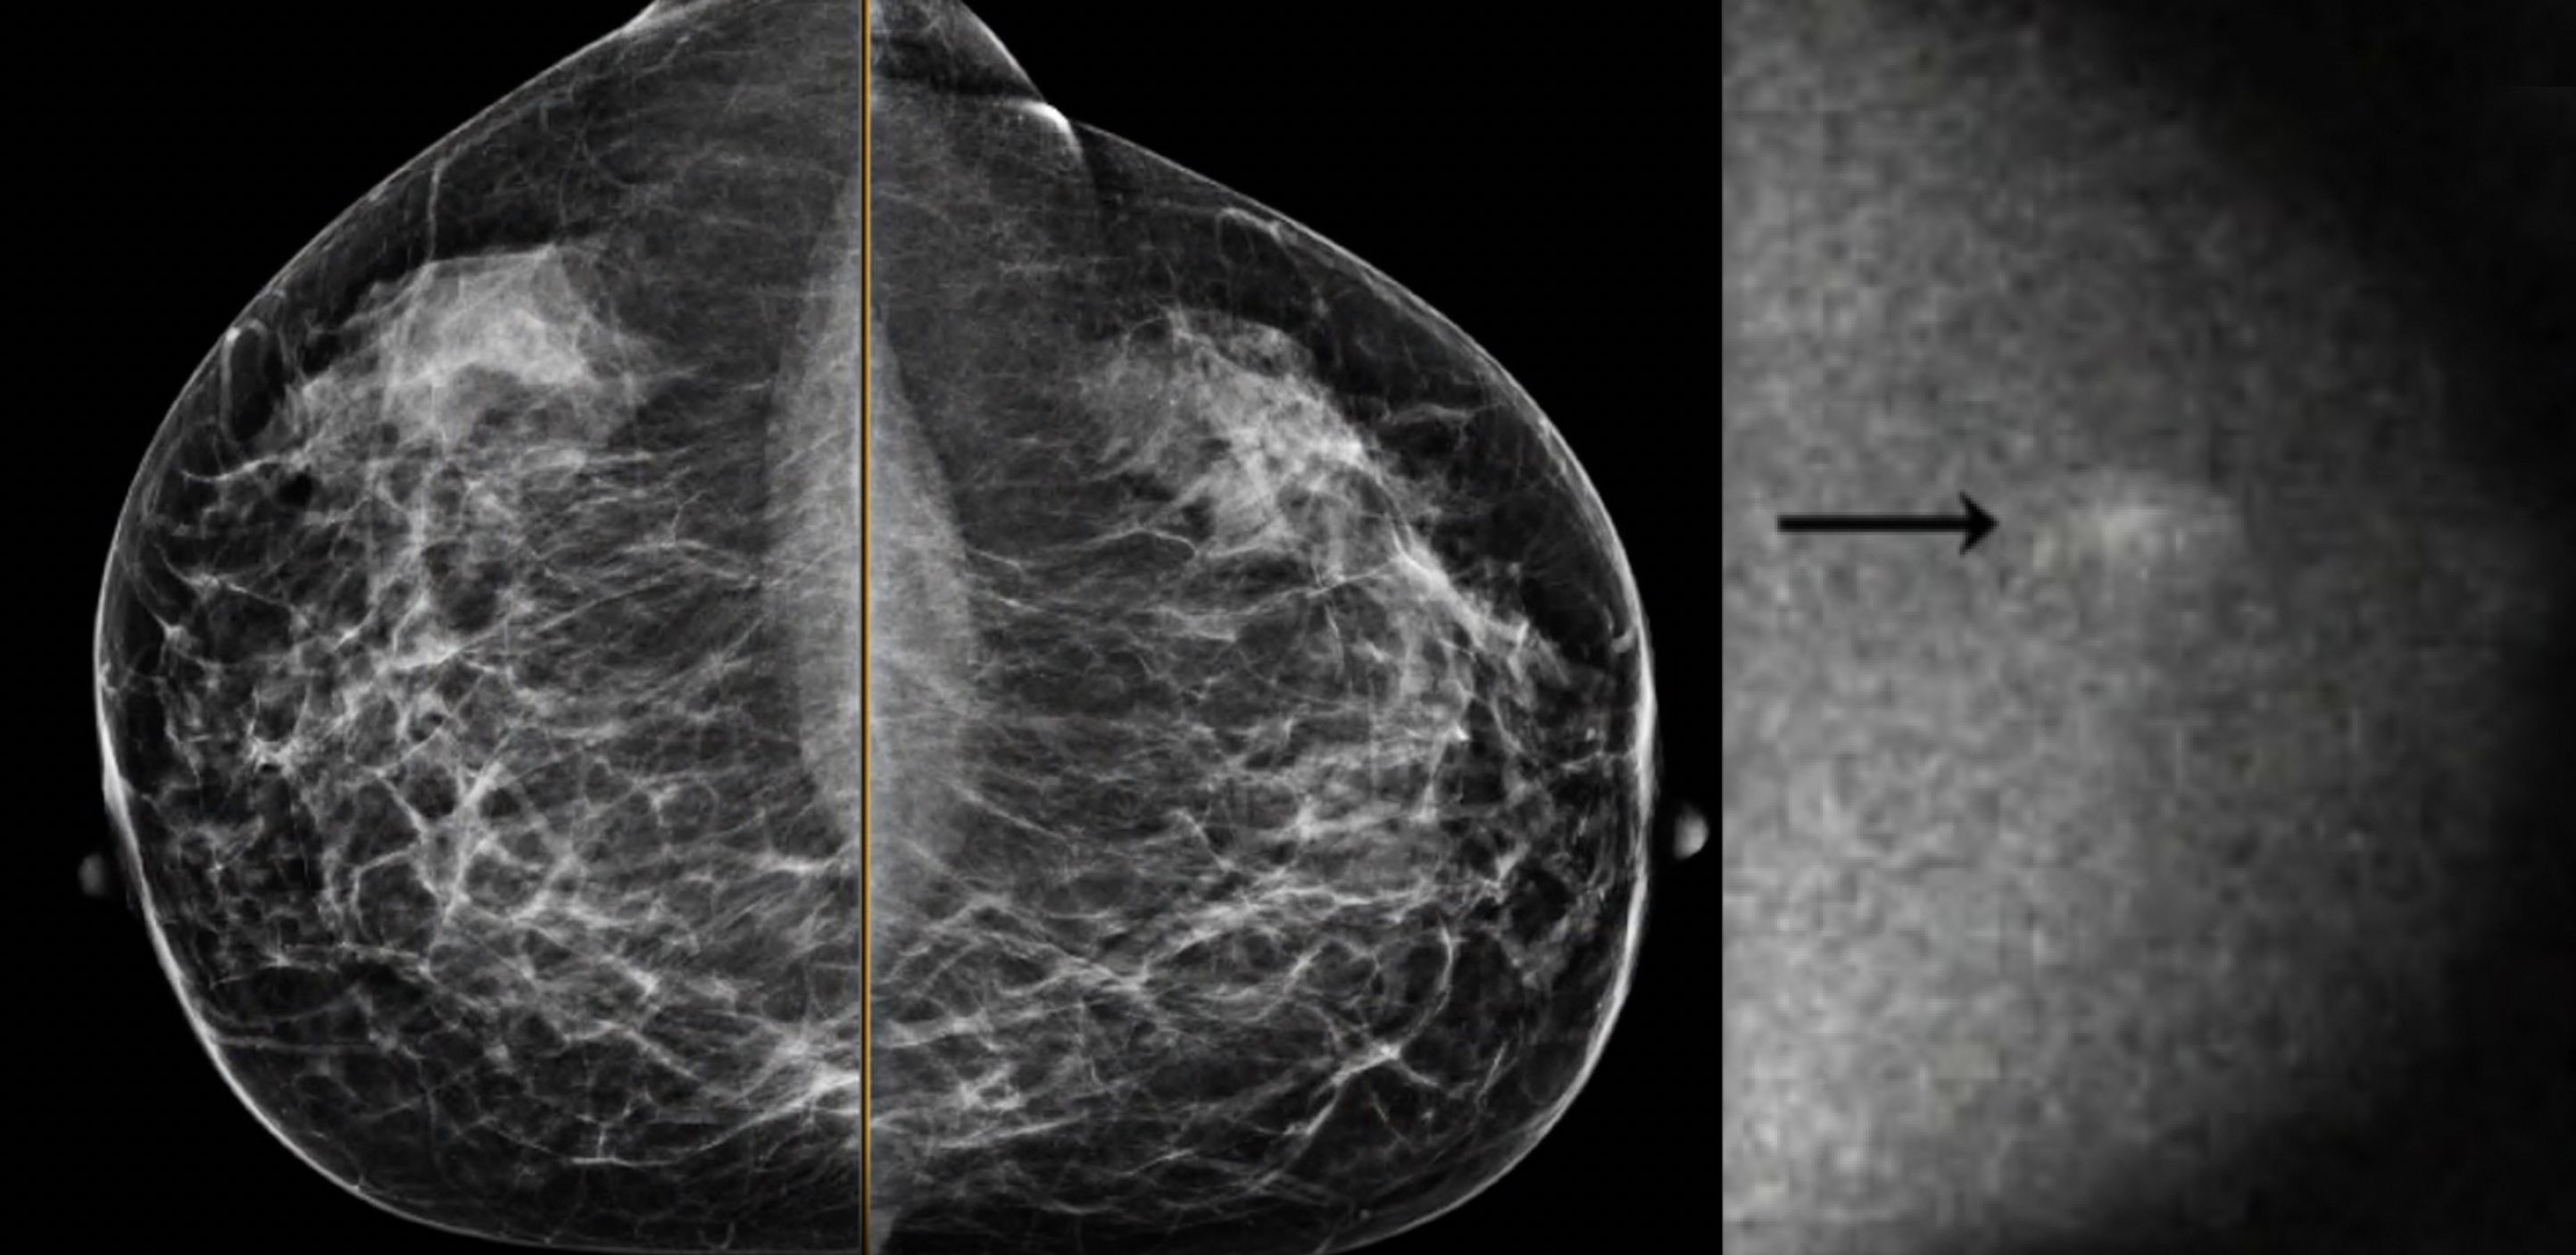
Example of asymmetry in breast imaging. This is a series of mammograms obtained at annual screenings in the same patient, displayed from oldest (far left) to most recent (far right). An asymmetry in the posterior central left breast (arrows) becomes more conspicuous and increases in size over time. The finding is consistent with a developing asymmetry, a recent term added to the mammography lexicon for mammography reports. A developing asymmetry is a focal asymmetry that is new or more conspicuous over time. The finding carries a 12.8% risk for malignancy when seen at screening mammography and a 26.7% risk for malignancy when it persists at diagnostic mammography. Read more. Image courtesy of RSNA
Gray-scale breast ultrasound image shows intraductal calcifications (arrow). Read more. Image courtesy of RSNA
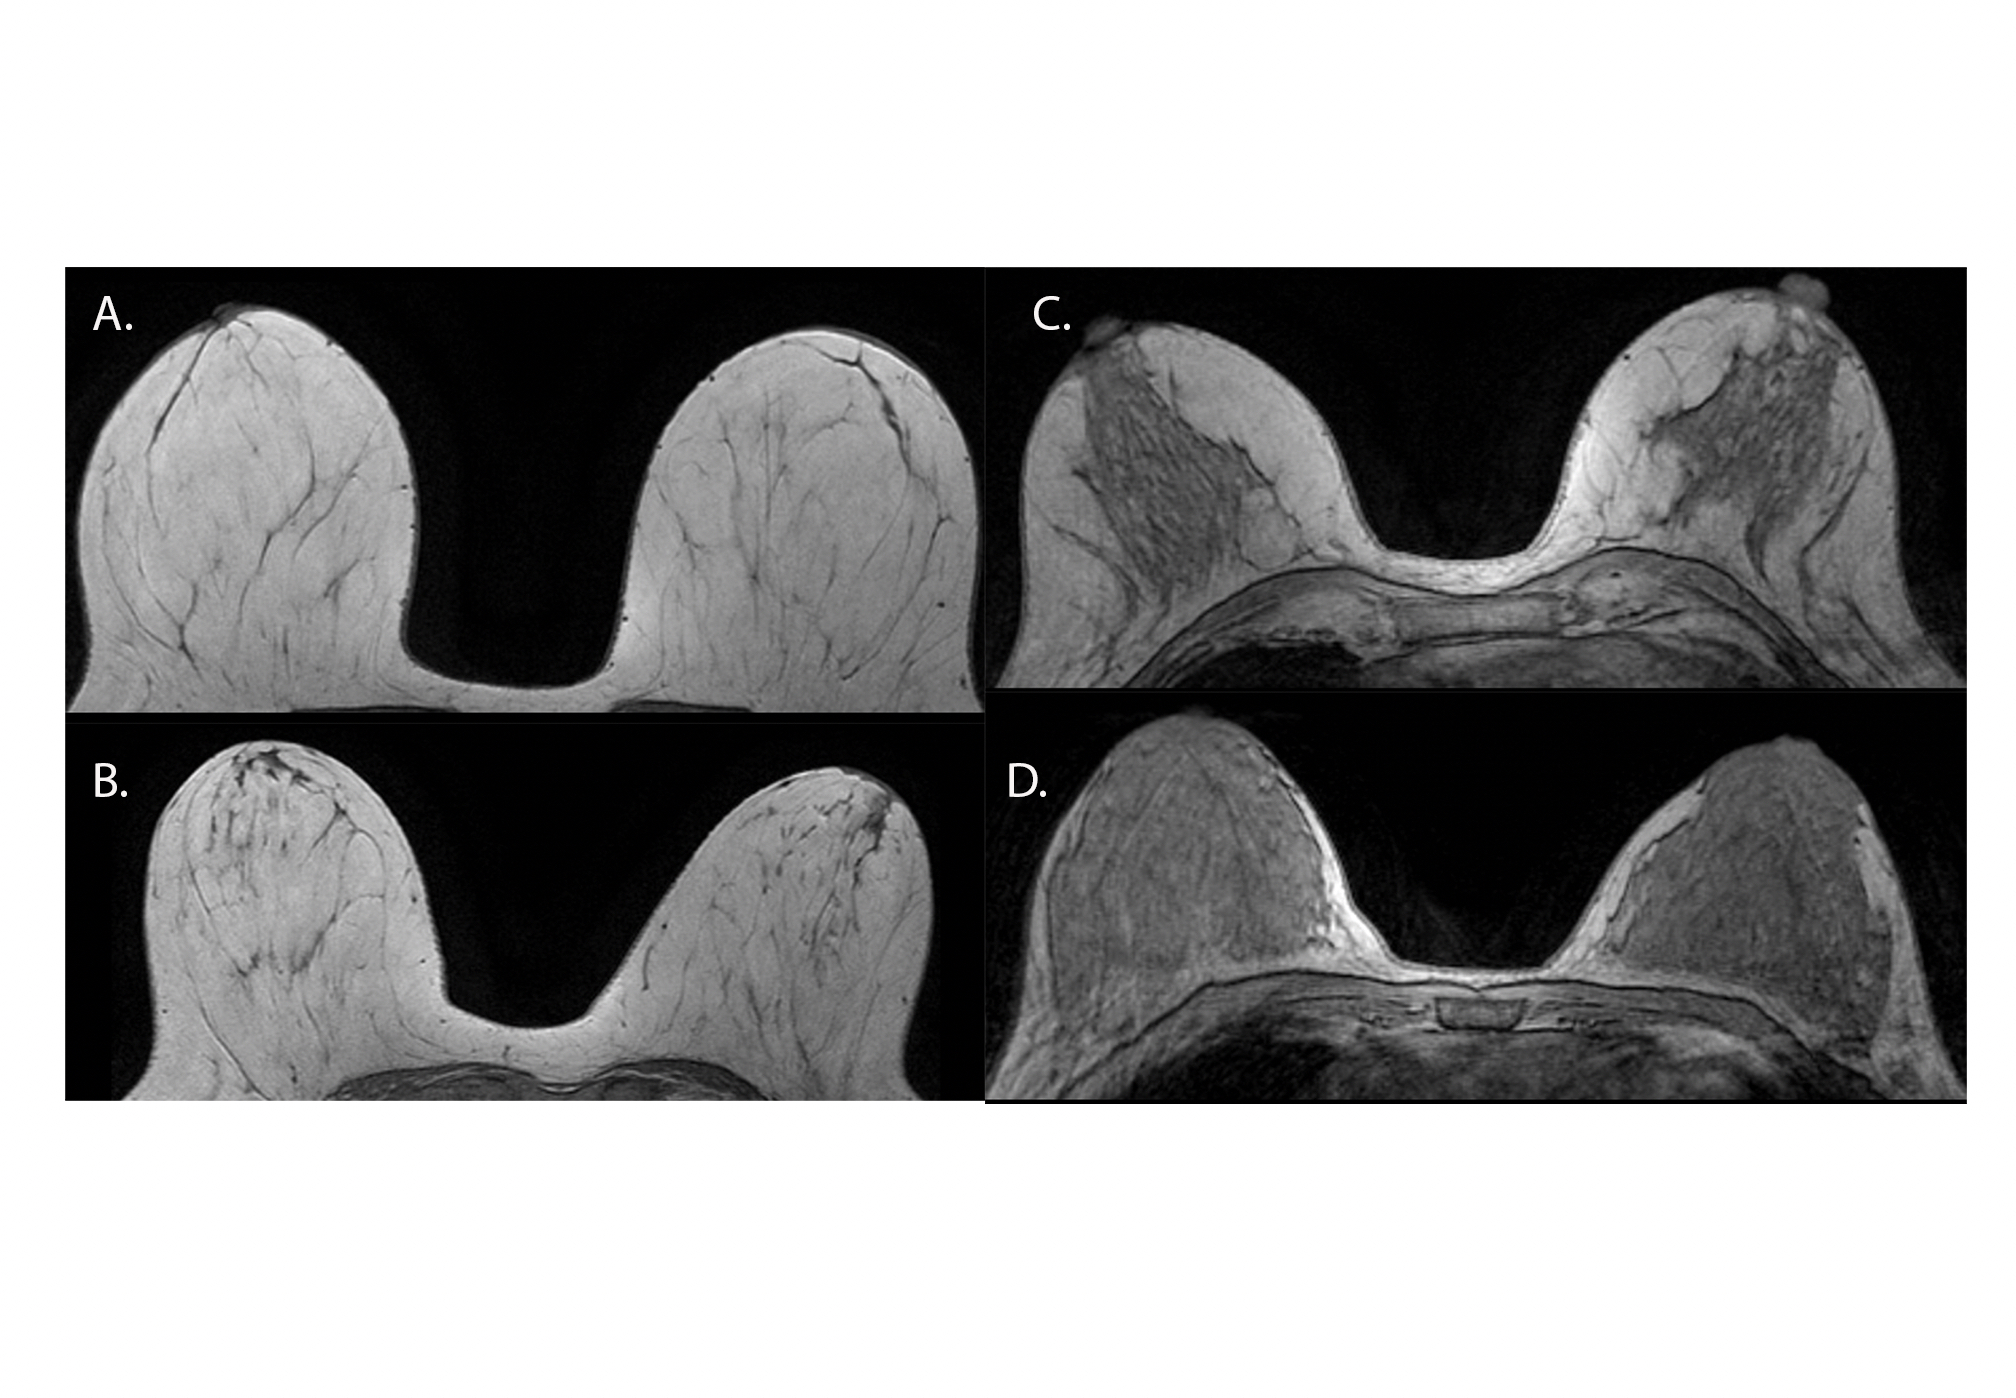
Mammographic density translates into fibroglandular tissue quantity. These examples show what breast density looks like on MRI imaging. Axial nonenhanced T1-weighted MR images show the following descriptors: A. almost entirely fat, B. scattered fibroglandular tissue, C. heterogeneous fibroglandular tissue, and D. extreme fibroglandular tissue. Read more. Image courtesy of RSNA
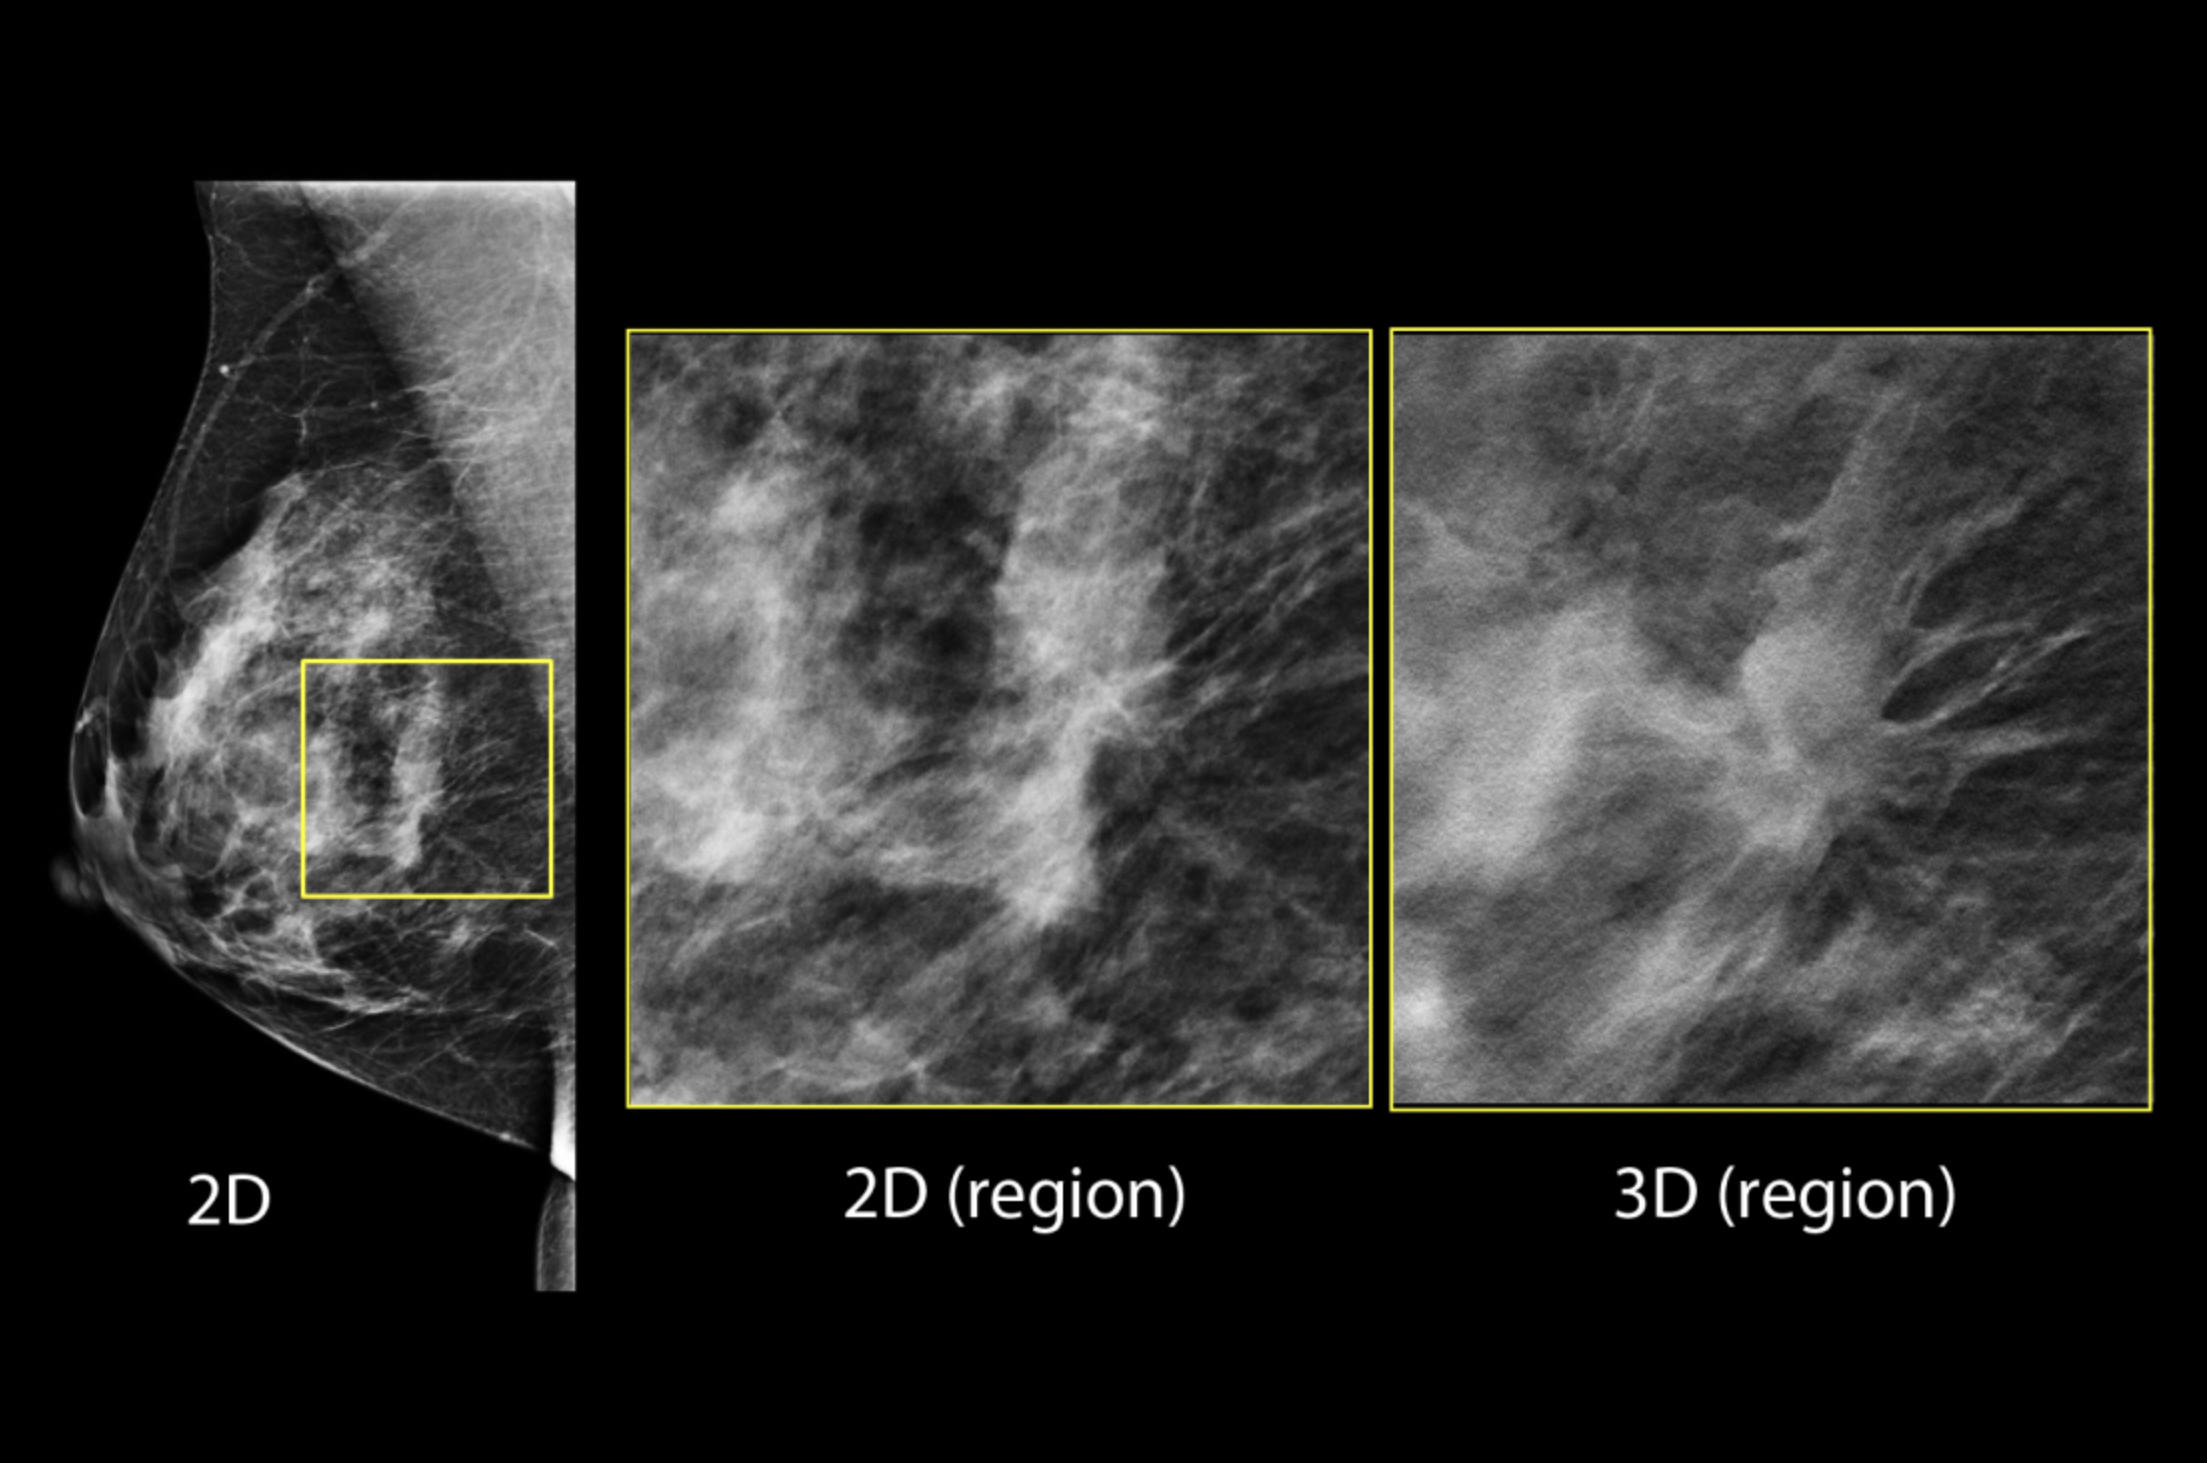
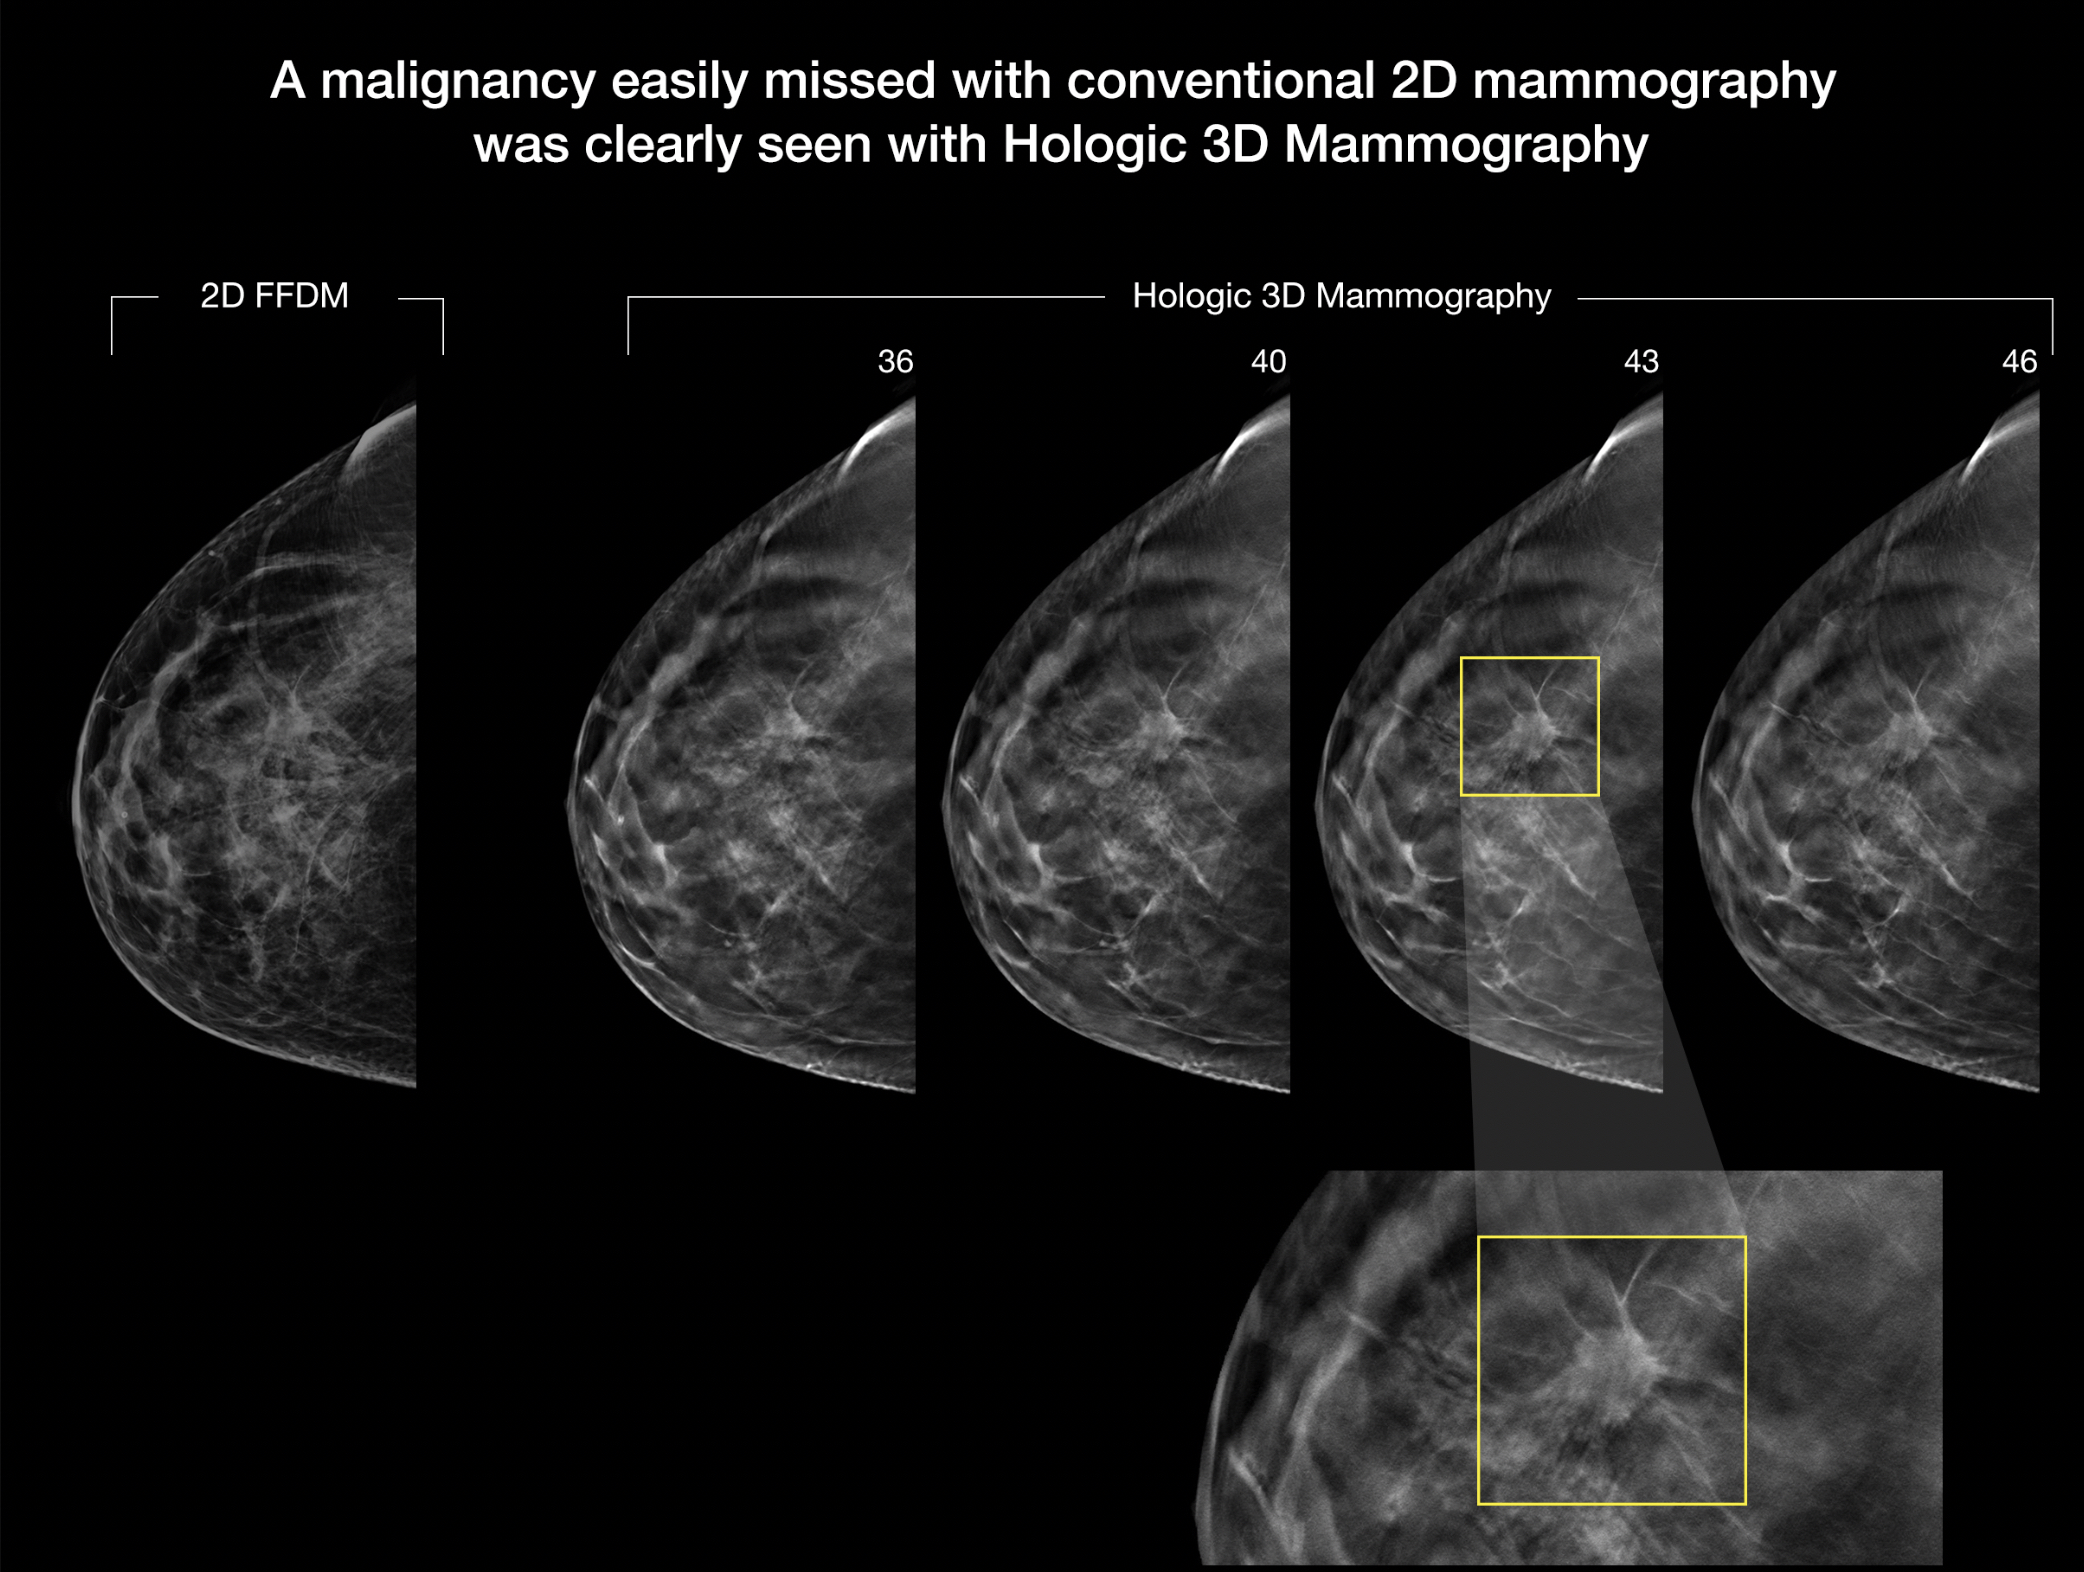
A comparison between 2D full-field digital mammography (FFDM), which has been the standard of care for years, and 3D mammography on the Hologic Selenia Dimensions Mammography System. 3D tomosynthesis shoots a series of images of the breast that can be flipped through as slices of specific layers of the breast tissue, where 2D shows all the breast tissue in one image. Dense breast tissue can hide cancers, as can be seen here where one of the 3D slices found a cancer masked by dense tissue on the 2D image.
A comparison between 2D and 3D mammography on the Hologic Selenia Dimensions Mammography System. 3D tomosynthesis shoots a series of images of the breast that can be flipped through as slices of specific layers of the breast tissue, where 2D shows all the breast tissue in one image. Dense breast tissue can hide cancers, as can be seen here where one of the 3D slices found a cancer masked by dense tissue on the 2D image.
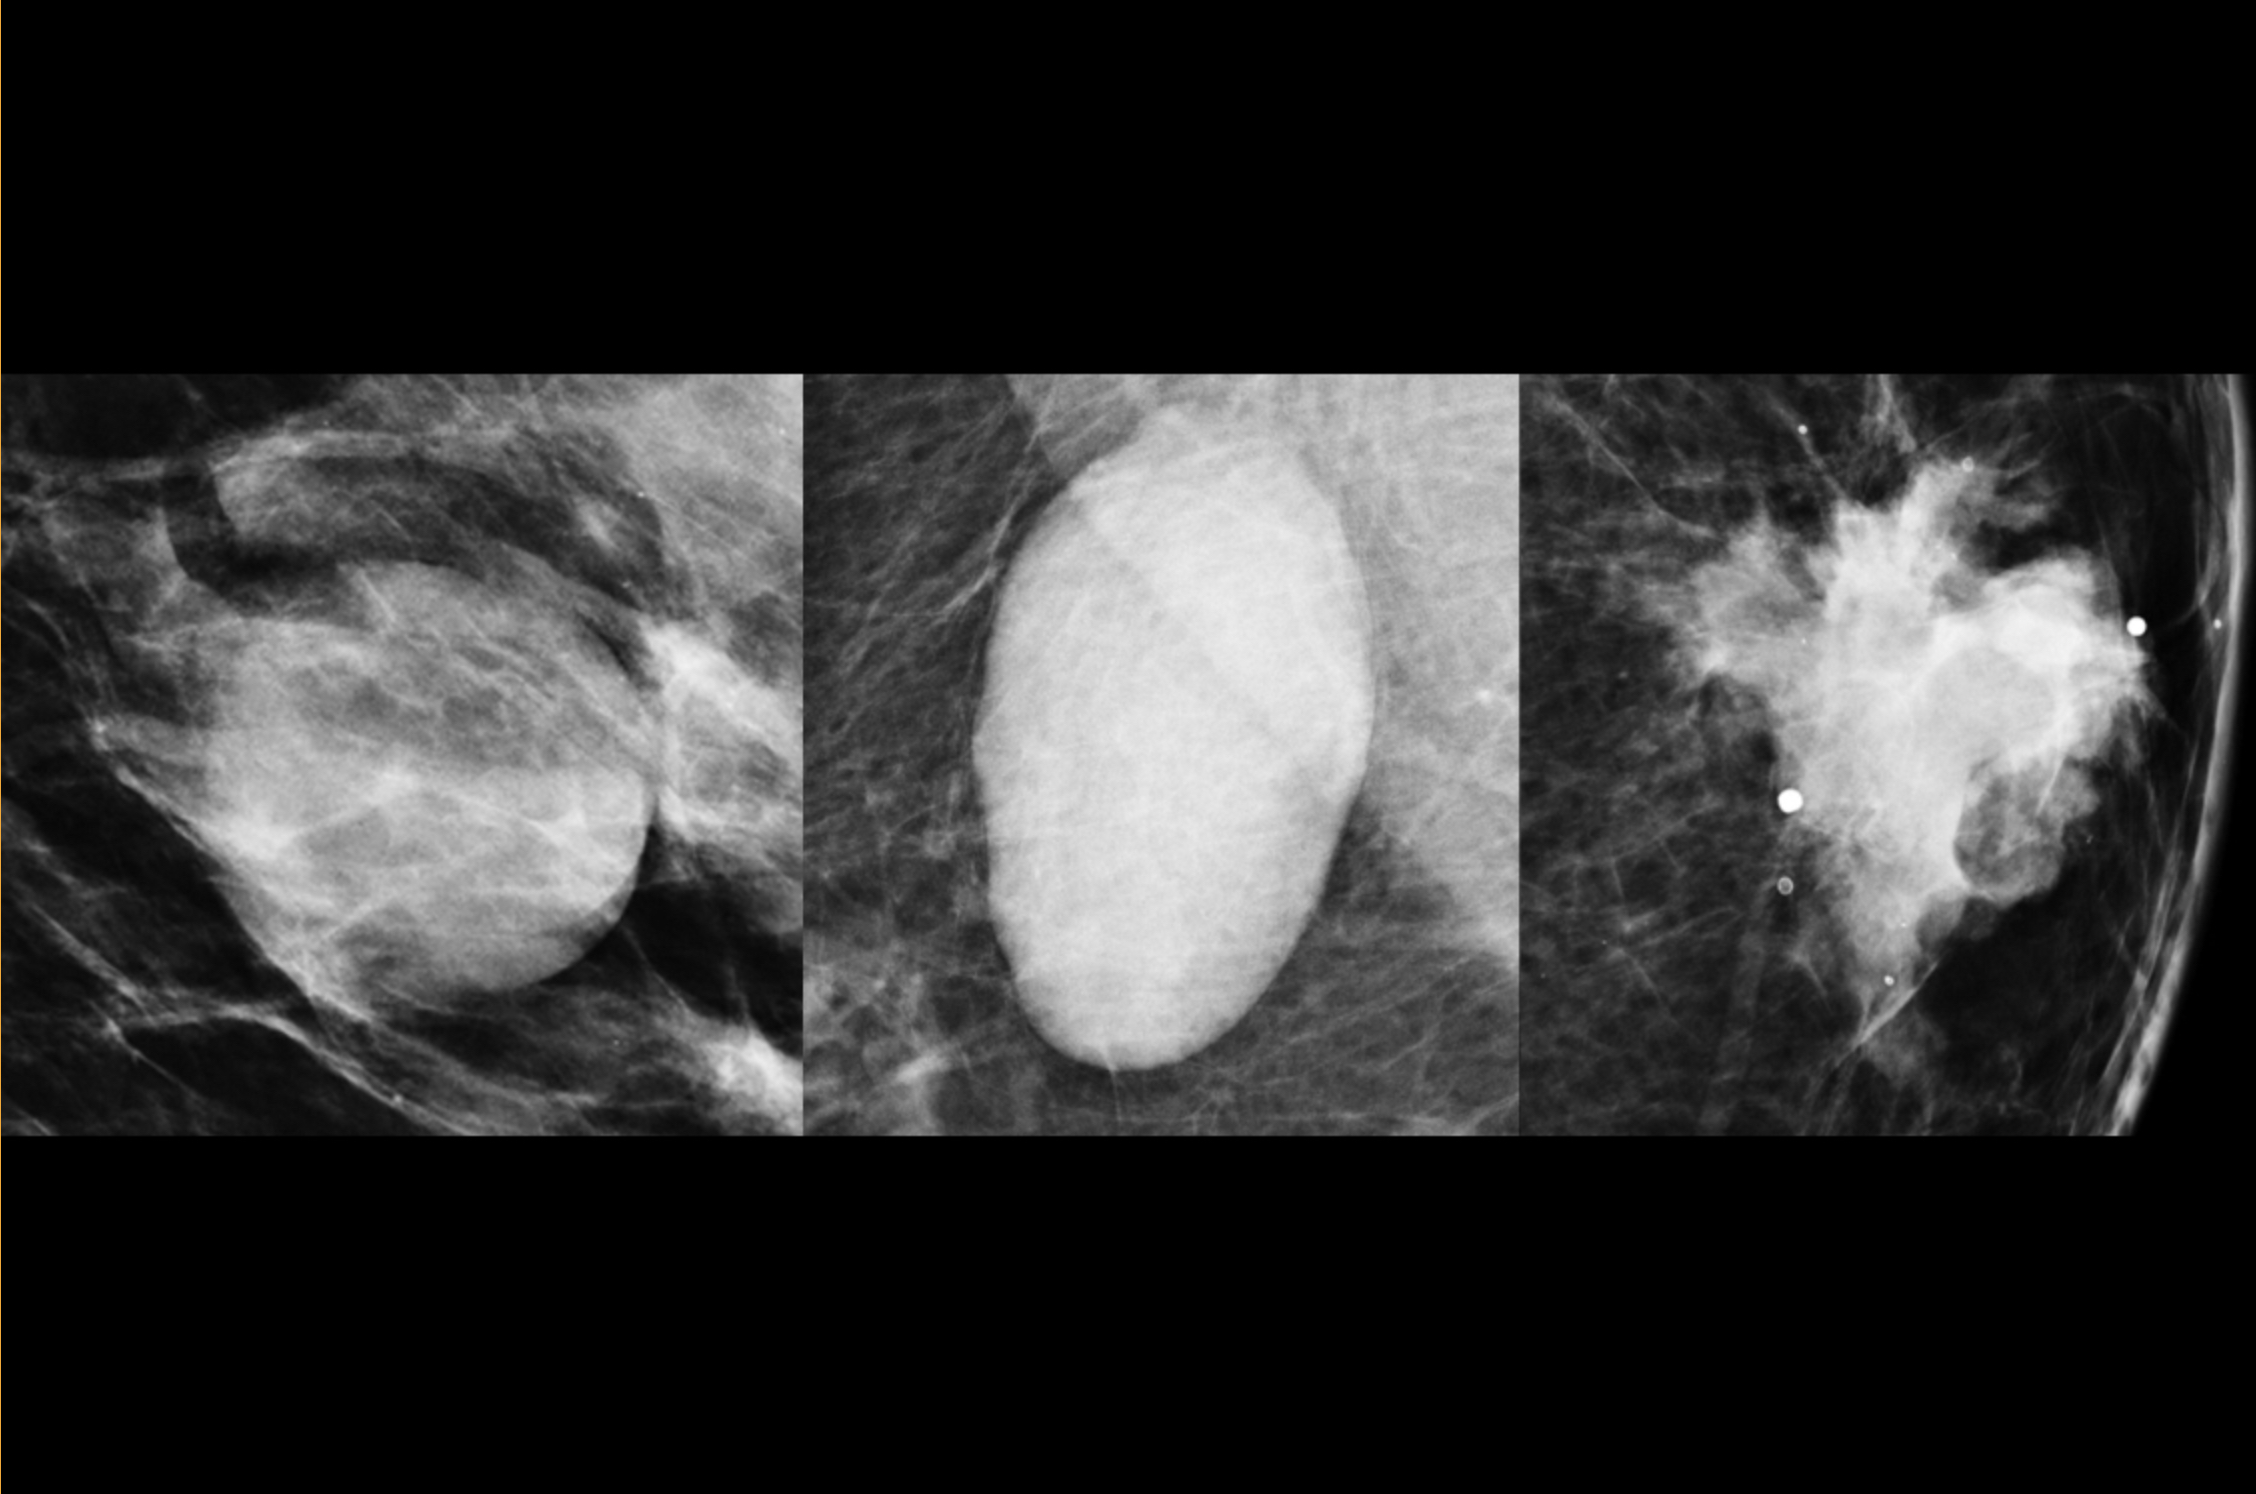
The shape a breast mass carries can help determine if it is cancer. Digital zoom mammographic projection images show, from left to right, round, oval, and irregular masses. An irregular mass has a higher probability of malignancy. Read more. Image courtesy of RSNA.
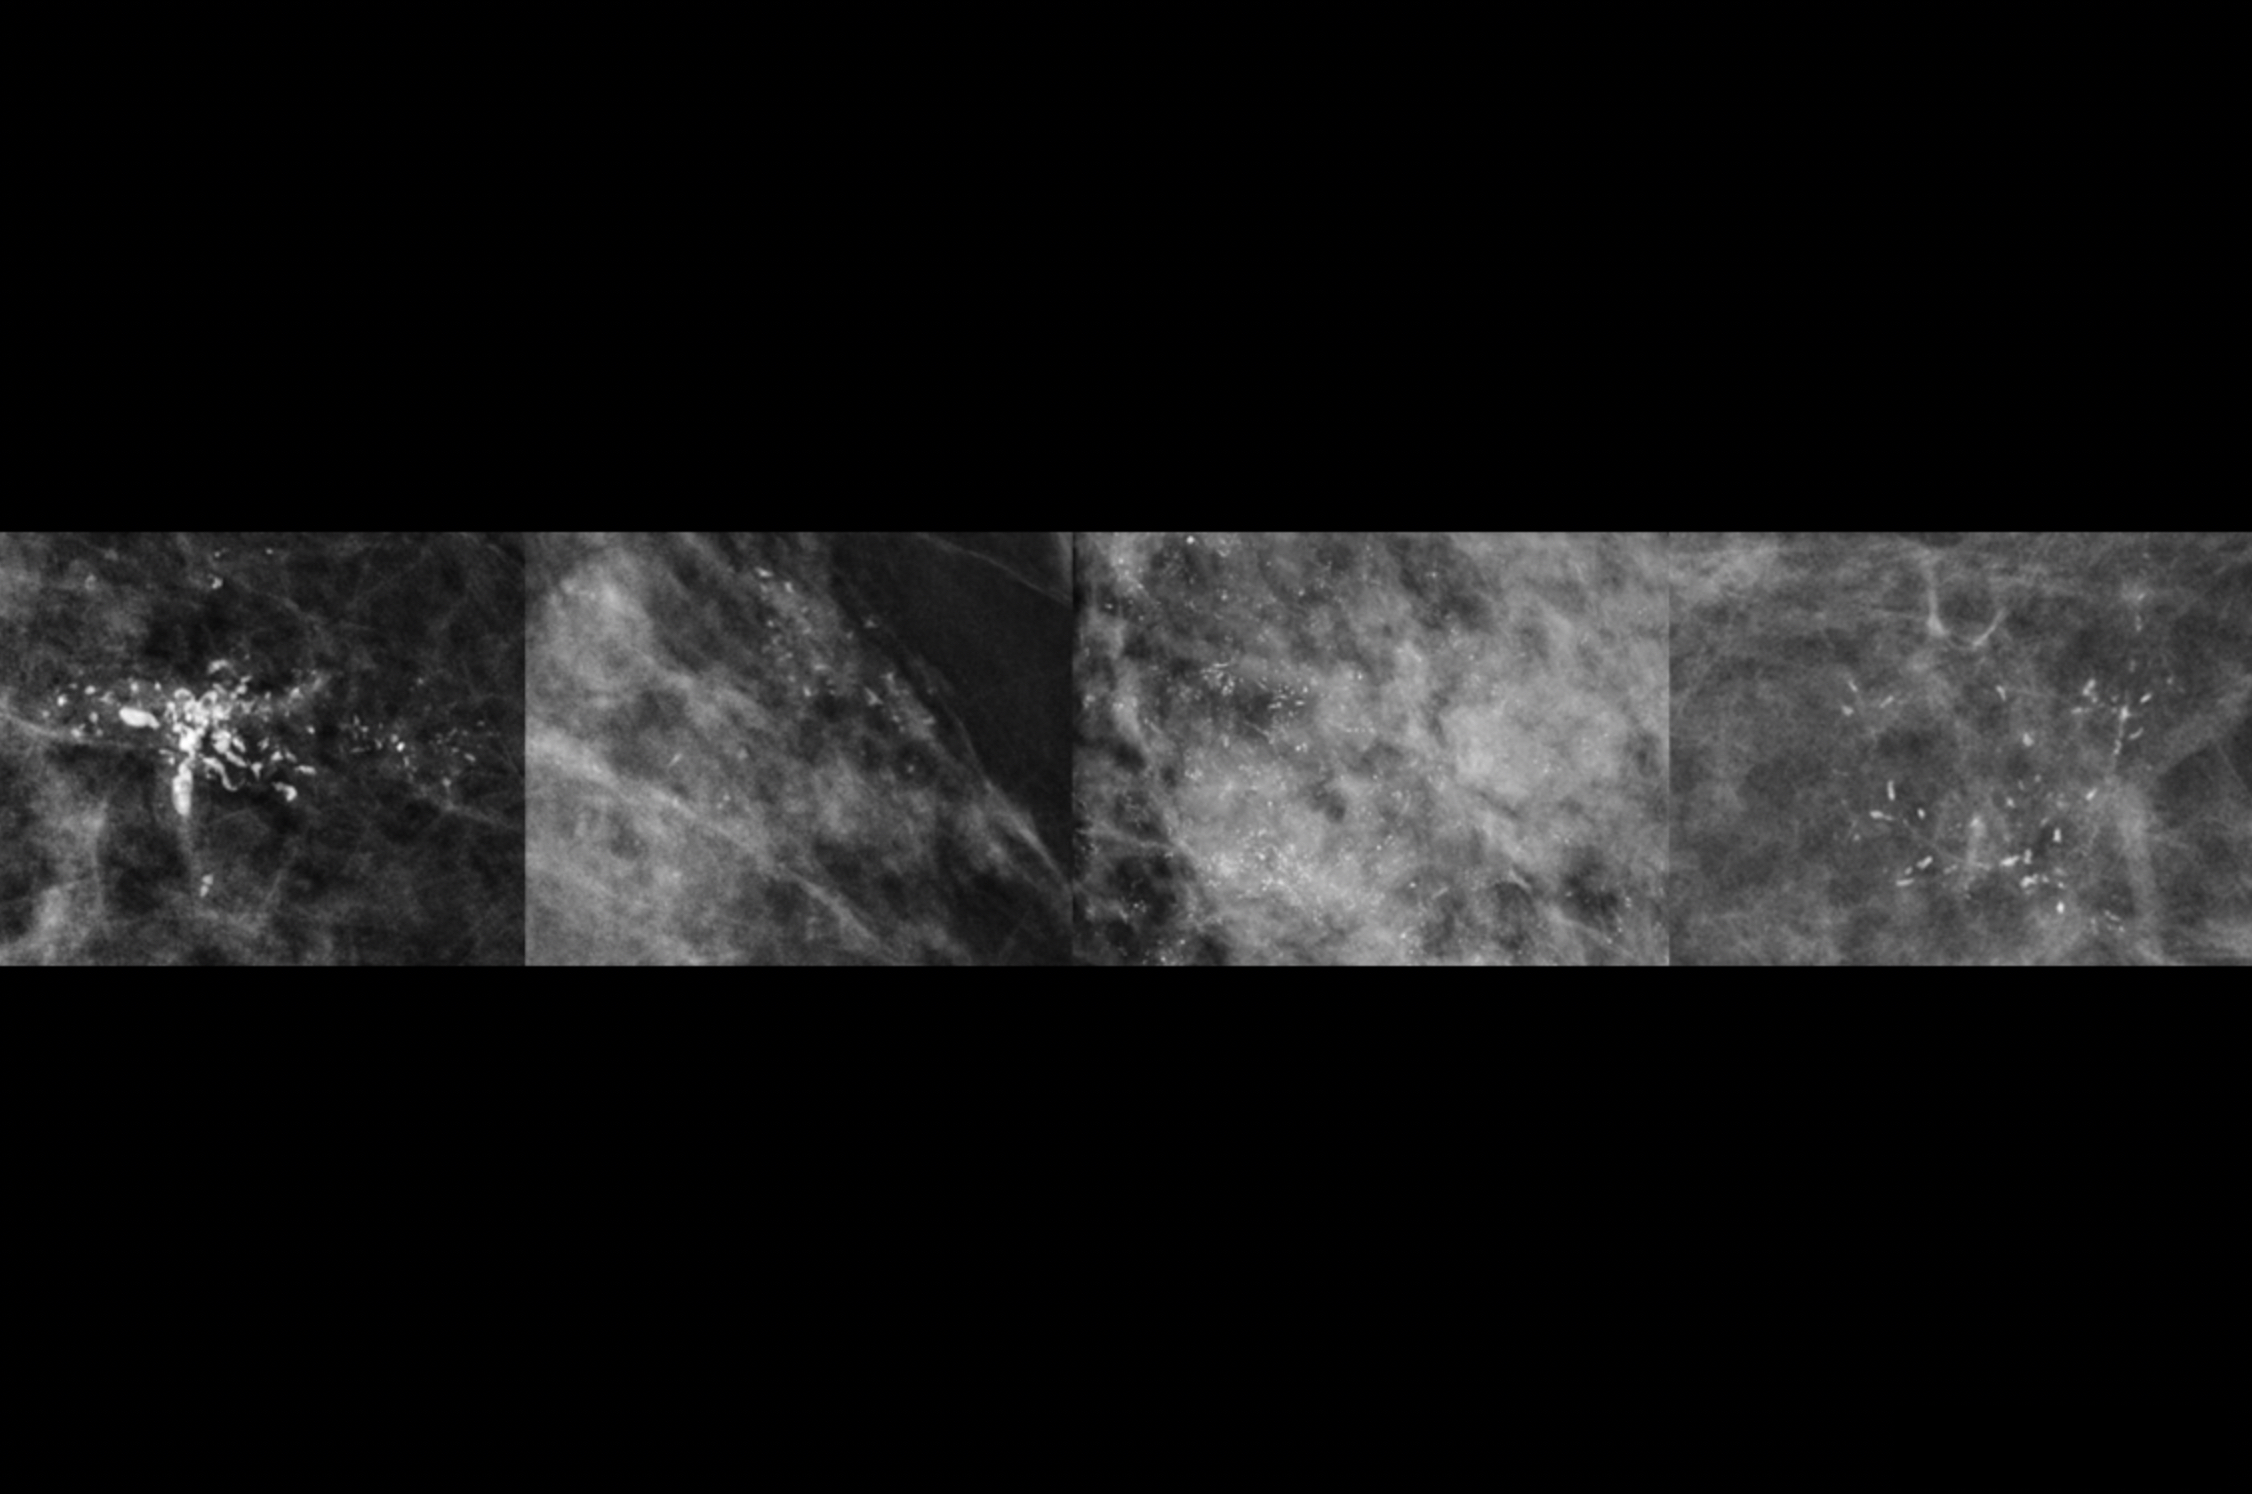
Examples of mammogram calcifications with suspicious morphology. These images are zoomed in to show calcifications with increasing risk for malignancy: coarse heterogeneous (far left), amorphous (second from left), fine pleomorphic (second from right), and fine linear or fine linear branching (far right). Read more. Image courtesy of RSNA.
Breast MRI example showing a signal void in right breast (arrow) caused by biopsy on an axial contrast-enhanced in-phase Dixon image. It shows a signal void in right breast (arrow), which corresponded with a MammoMark/CorMark Bread Tie biopsy clip. Image courtesy of AJR.
72-year-old woman recalled from screening mammography for architectural distortion (AD) in left breast. Ultrasound of upper outer breast shows irregular hypoechoic mass (arrow) with associated AD at 1-o'clock position. Ultrasound-guided biopsy of revealed malignancy (invasive lobular carcinoma). Image courtesy of AJR. Read More.
Ultrasound of upper central breast shows irregular hypoechoic mass (arrow) with antiparallel orientation at 12-o'clock position. Ultrasound-guided biopsy of upper central architectural distortion revealed malignancy (invasive ductal carcinoma). 82-year-old woman with history of right mastectomy recalled from screening mammography for architectural distortion (AD) in outer left breast. Image courtesy of AJR. Read More.
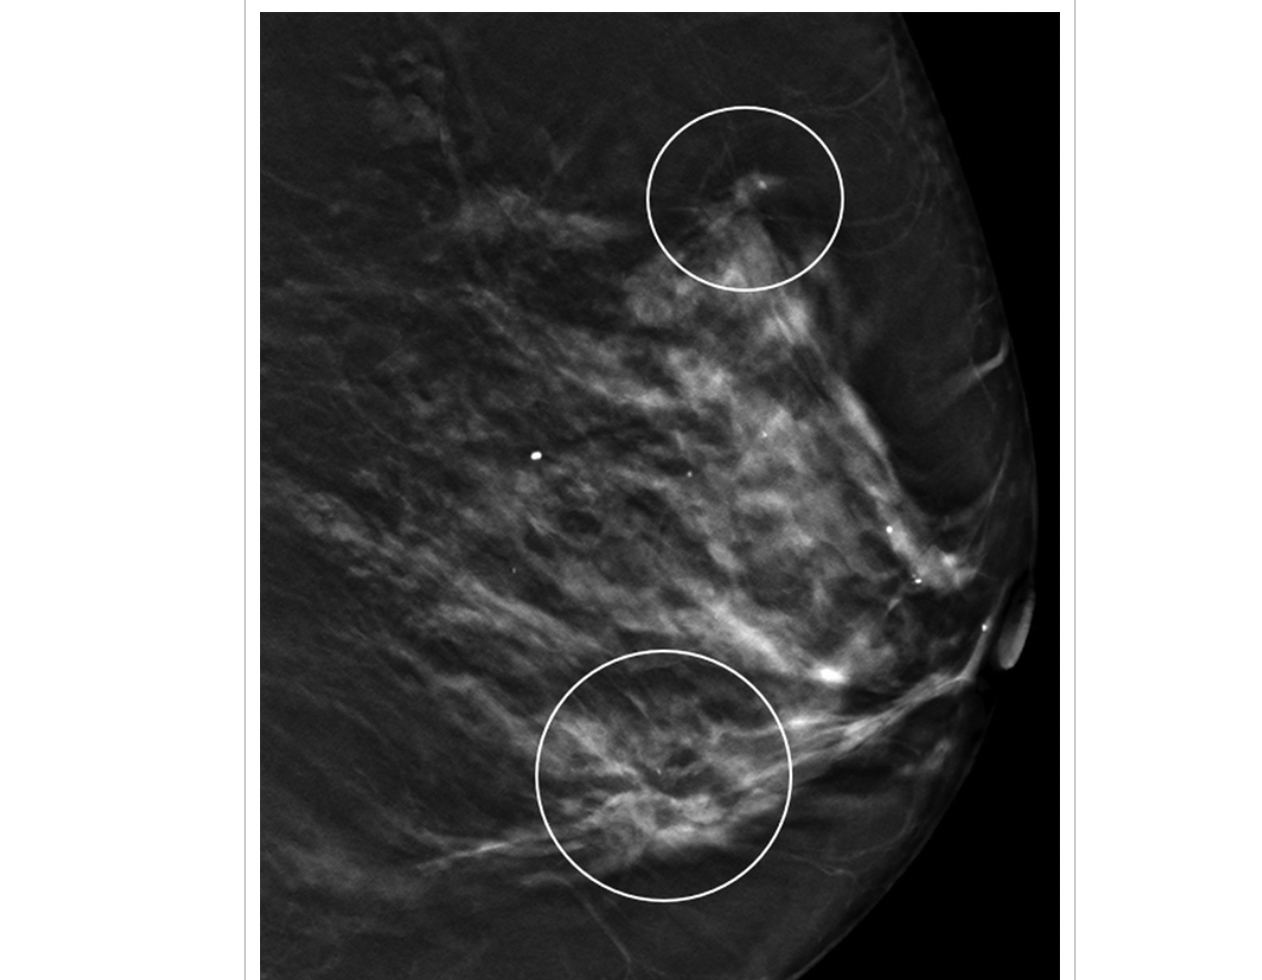
82-year-old woman with history of right mastectomy recalled from screening mammography for architectural distortion (AD) in outer left breast. Left lateral digital breast tomosynthesis (DBT) image shows ADs (circles) in upper central breast and in lower outer breast, consistent with multiple ADs. Image courtesy of AJR. Read More.
Related Breast Imaging Content:
VIDEO: 3D mammography is becoming the standard-of-care in breast imaging
VIDEO: Use of supplemental imaging in women with dense breasts
DBT is better for women with increased breast cancer risks
Same-day results could increase breast cancer screening compliance, study shows
Research offers new guidance on managing architectural distortion visualized on DBT exams
Screening mammograms are not as effective as they once were
Contrast enhanced breast MRI superior to CEM, but accessibility remains an obstacle
CEM vs breast MRI: Which is best for assessing treatment response?
Abbreviated breast MRI protocols not as cost-effective as promised, new study shows
The National Comprehensive Cancer Network has published new patient-friendly breast cancer screening guidelines
3D mammography is costly—but its benefits may more than pay the difference
3D mammography approaching 50% of breast imaging systems in the U.S.
Research offers new guidance on managing architectural distortion visualized on DBT exams
Screening recommendations are disputed, so when are women actually starting their annual mammograms?
Surveillance breast MRI findings linked with future second cancer
Synthetic MRI measures predict breast cancer treatment responses, according to new research
VIDEO: Use of supplemental imaging in women with dense breasts
Related COVID-19 Vaccine Imaging Content:
VIDEO: Should women wait to get mammograms after COVID vaccination?
Women do not need to delay their mammogram appointment after COVID-19 vaccination.
Q&A: Should COVID vaccinated patients delay getting breast imaging — new study says no
Molecular imaging group shares updates for managing COVID-19 vaccine effects on PET/CT exams
How radiology providers can minimize mammography recalls among COVID-vaccinated patients
Radiologists report COVID vaccine side effects mimicking breast cancer on mammograms
These ultrasound features distinguish between COVID vaccine-related and malignant adenopathy
More on Breast Imaging:

Dave Fornell has covered healthcare for more than 17 years, with a focus in cardiology and radiology. Fornell is a 5-time winner of a Jesse H. Neal Award, the most prestigious editorial honors in the field of specialized journalism. The wins included best technical content, best use of social media and best COVID-19 coverage. Fornell was also a three-time Neal finalist for best range of work by a single author. He produces more than 100 editorial videos each year, most of them interviews with key opinion leaders in medicine. He also writes technical articles, covers key trends, conducts video hospital site visits, and is very involved with social media. E-mail: dfornell@innovatehealthcare.com