
PHOTO GALLERY: What does COVID-19 look like on medical imaging?
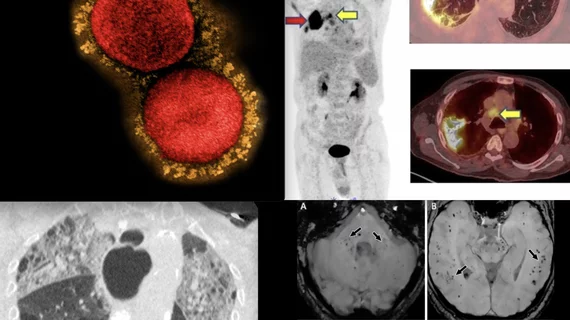
This image gallery shows what the various clinical presentations associated with the COVID-19 (SARS-CoV-2) virus that have been documented during the coronavirus pandemic.
Originally thought to be a disease limited to the respiratory system, COVID was quickly found to impact many areas of the body. The virus caused responses in many people that resulted in increased clotting of the blood, which can lead to pulmonary embolism, strokes, heart attacks and thrombosis in other organs leading to infarcts. Severe inflammatory responses from COVID also cause rashes, nerve damage, myocarditis, pericarditis and brain hemorrhages. The virus usually causes mild or asymptomatic illness in kids, but a couple of weeks after infection can result in the rare presentation of multi-system inflammatory syndrome in children (MIS-C). Ongoing research is also shedding light on long-term damage caused to the body by COVID, including issues in the lungs, brain and heart. Long-COVID symptoms have become a major area of research in 2021-22. This gallery offers medical imaging examples in all of these areas.
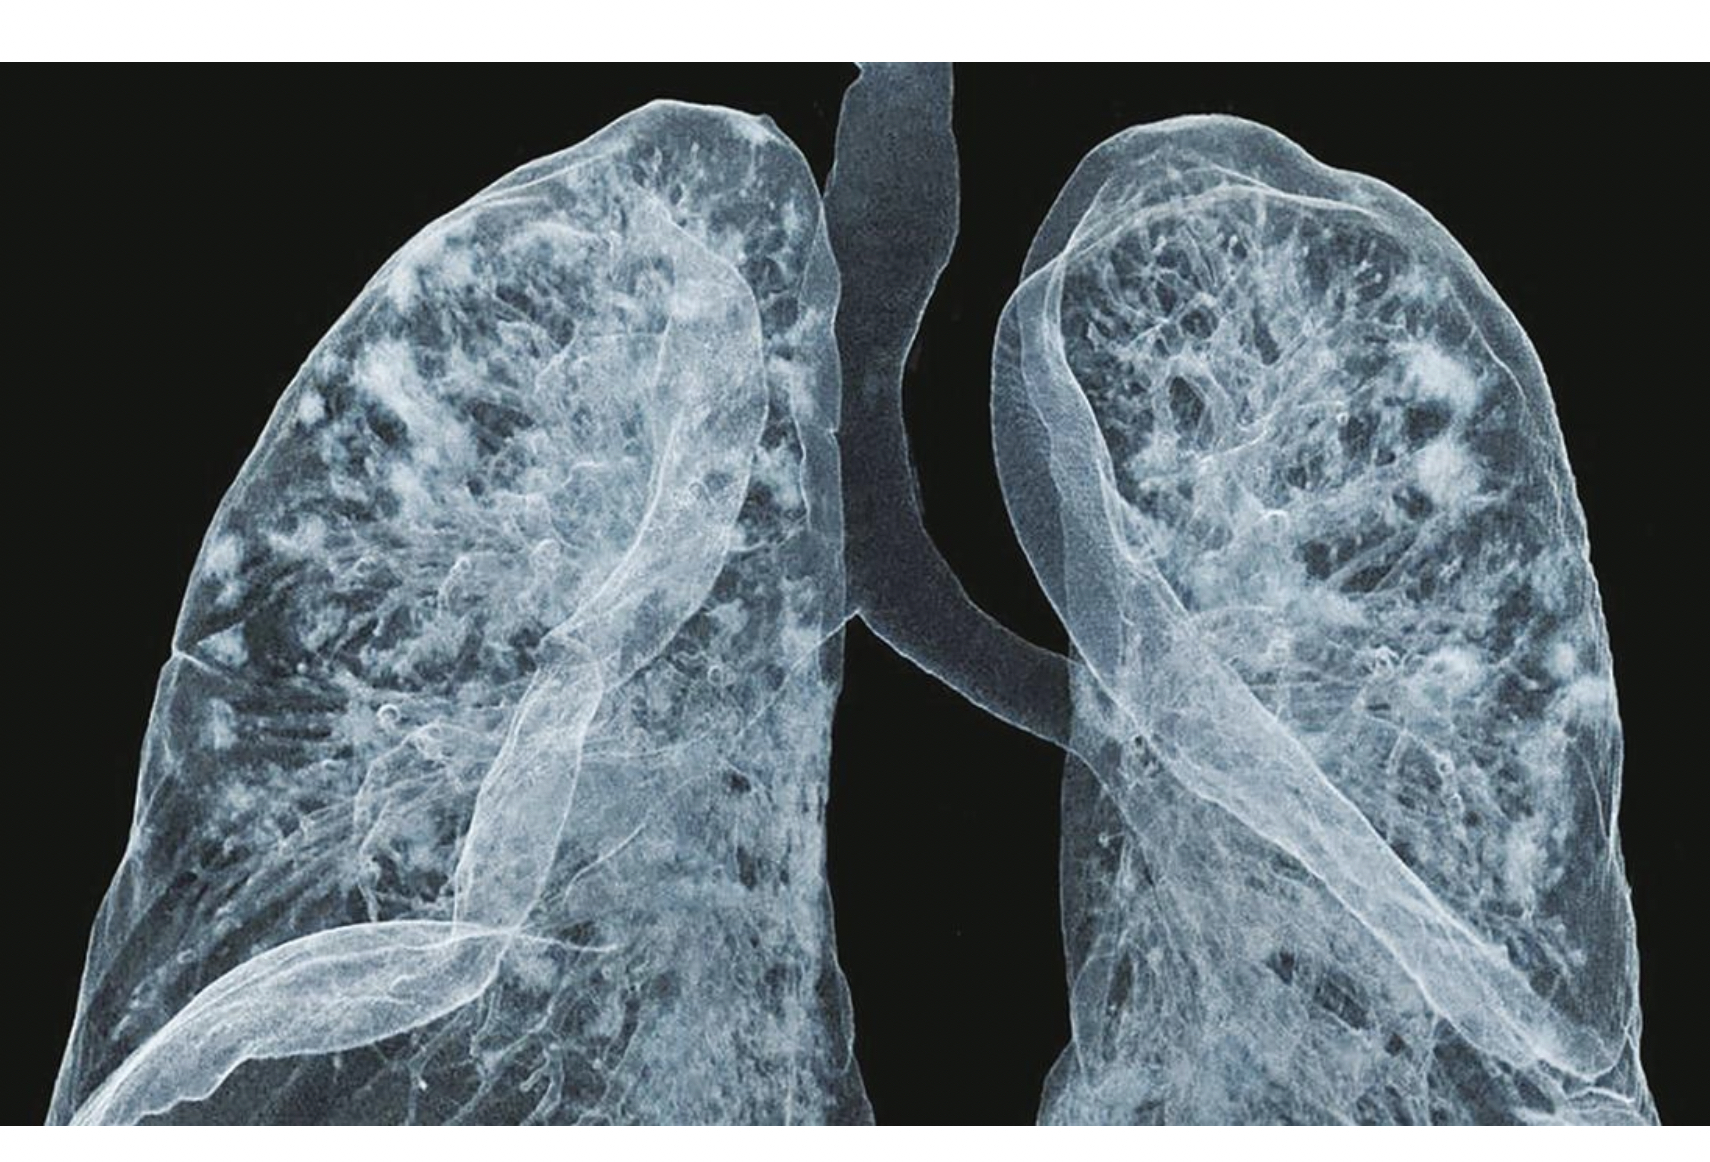
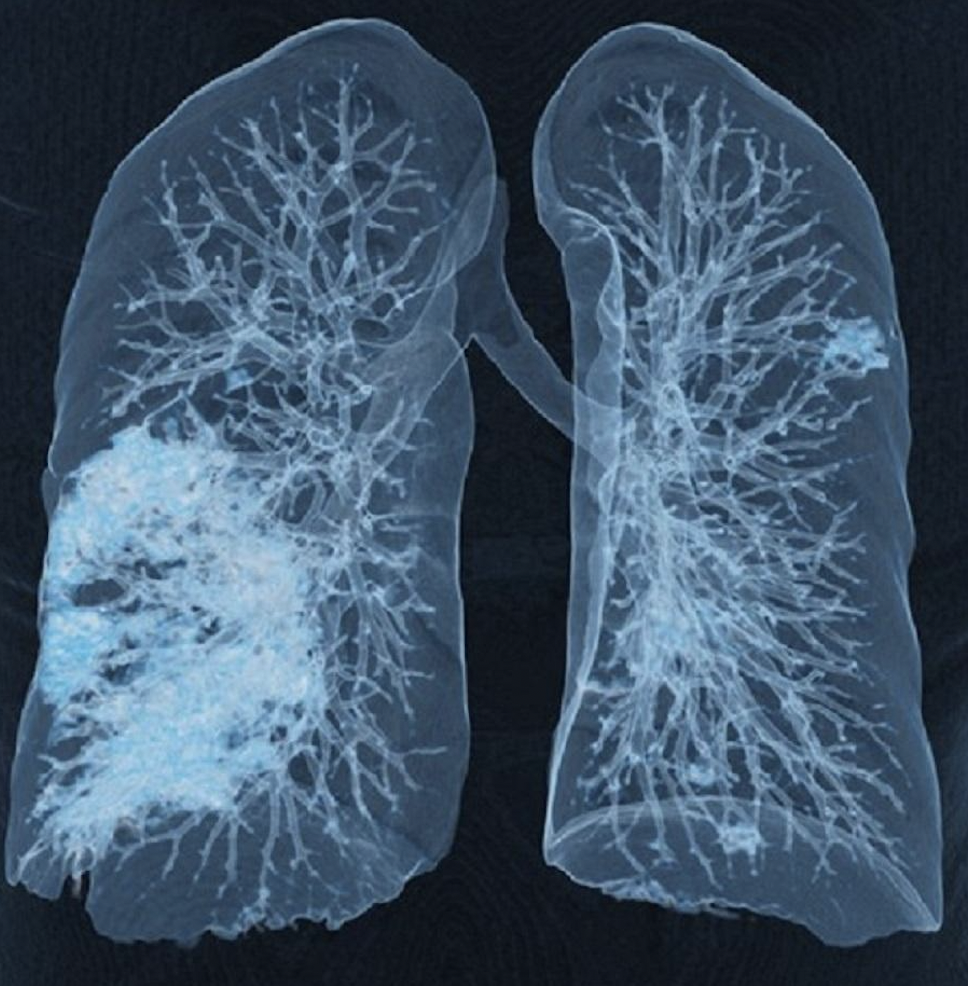
A three-dimensional rendering of a CT scan shows densely consolidated inflammation caused by COVID-19, which NYU Langone radiologists have linked to poor outcomes. Image courtesy of Matthew Young, DO, clinical assistant professor of radiology.
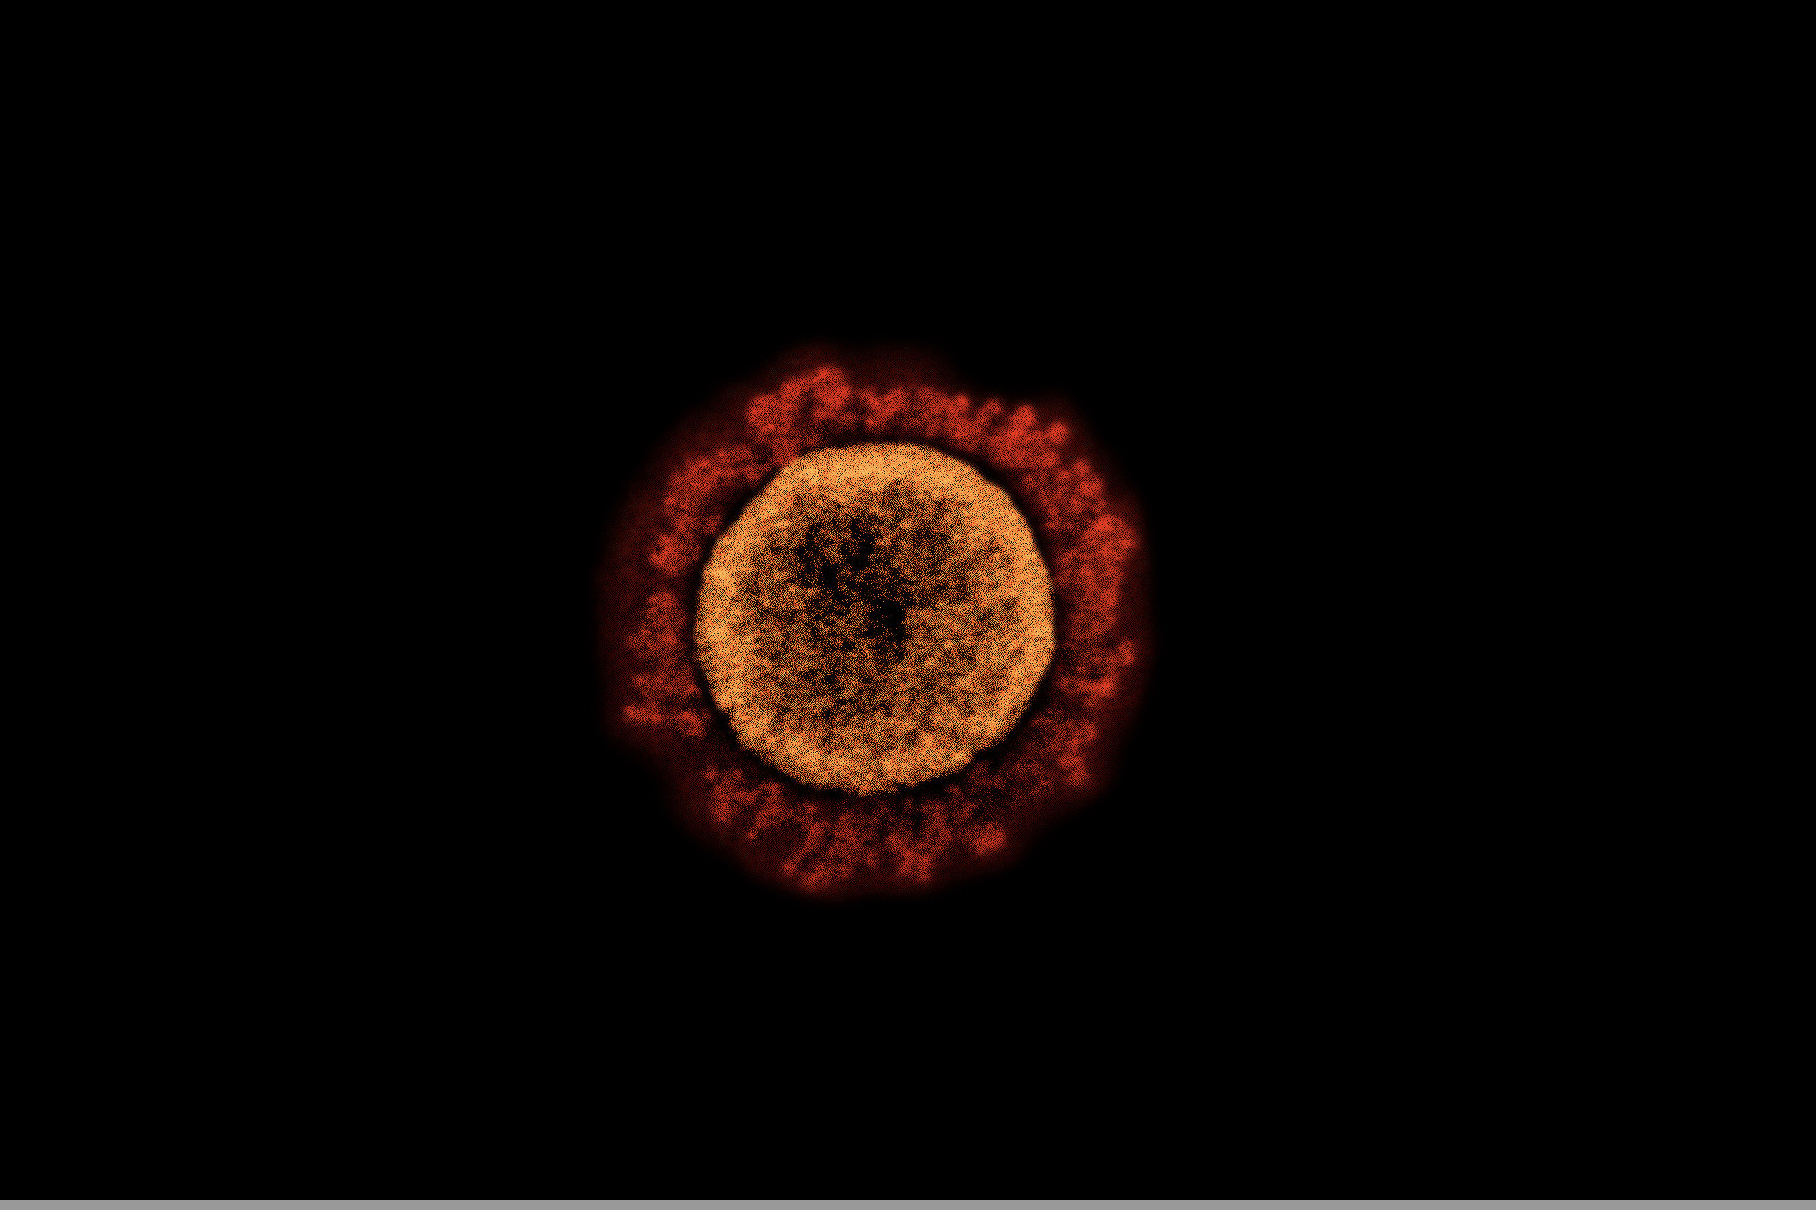
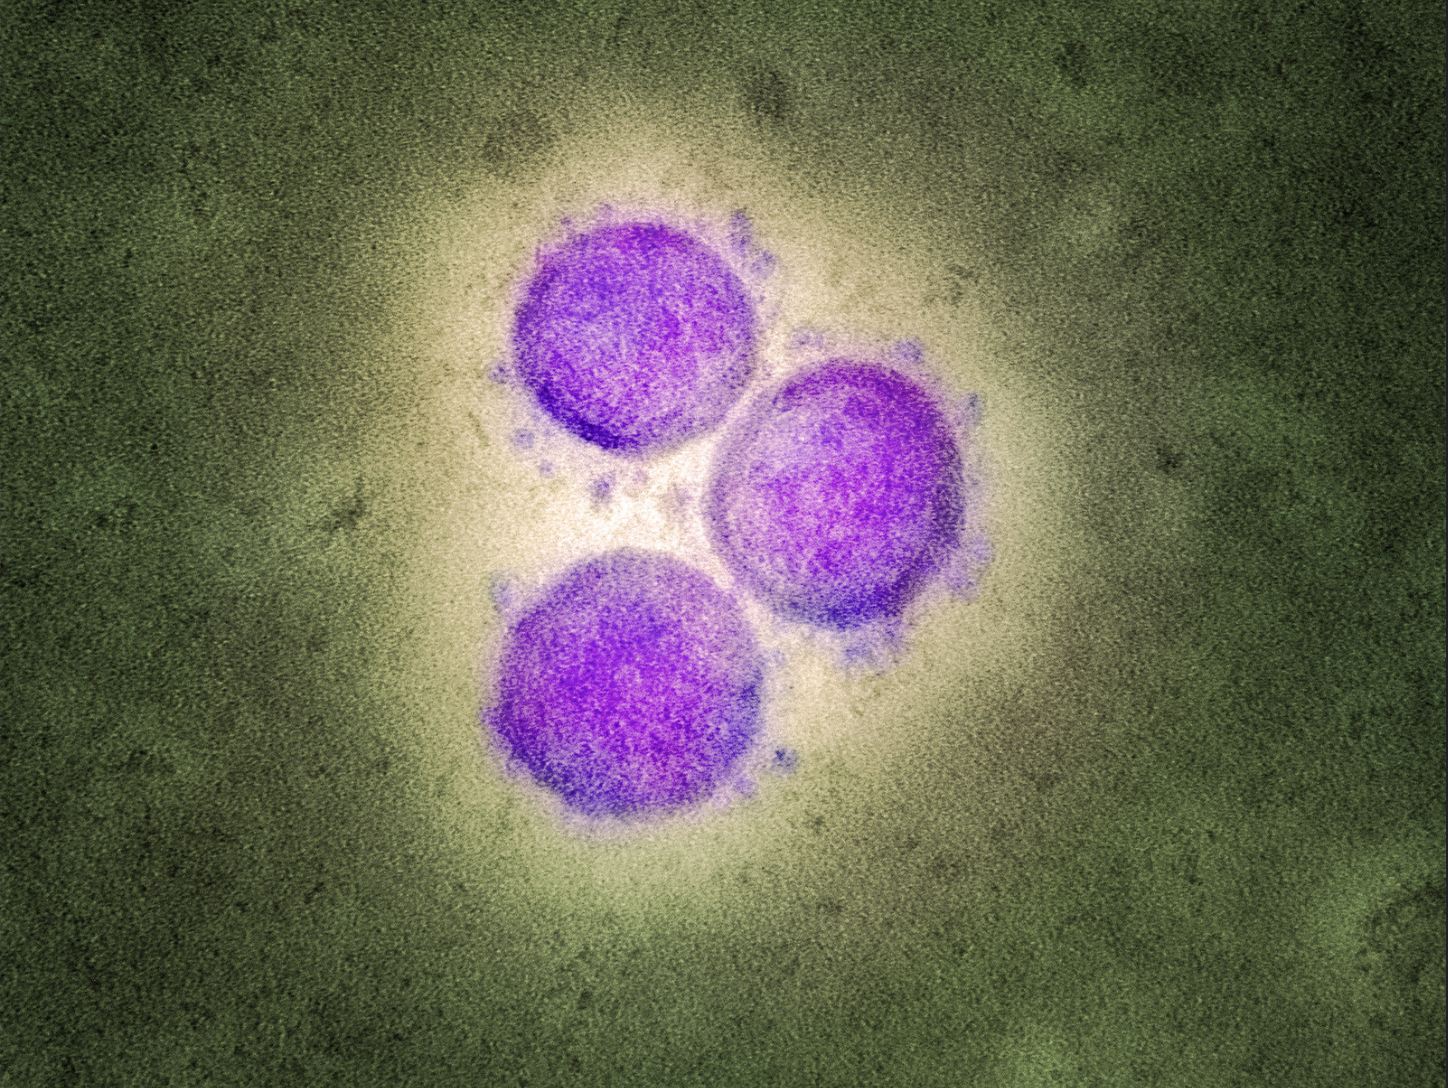
Electron microscope view of the COVID U.K. B.1.1.7 variant strain, showing the protein spikes in red that are used to attach to cells in a host's body. Image courtesy of NIAID
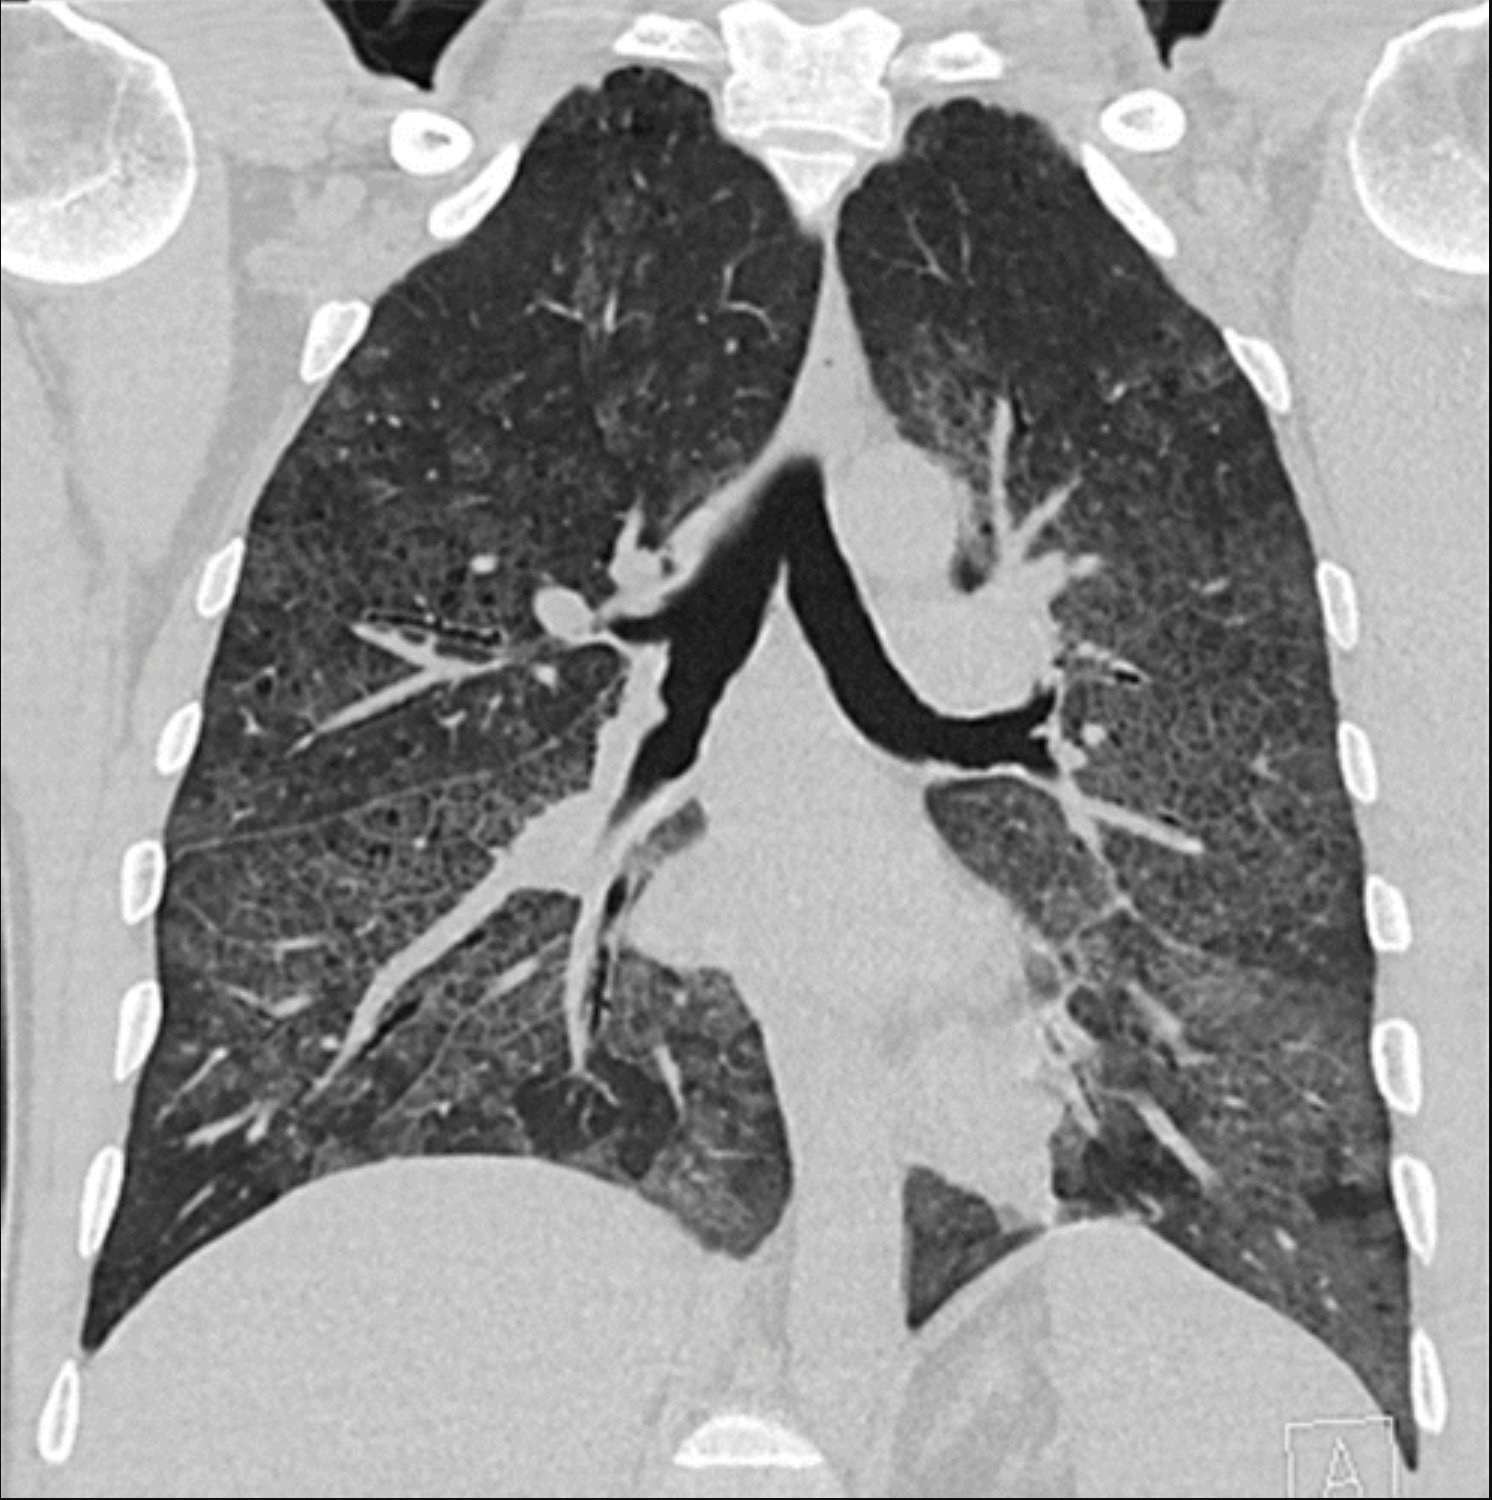
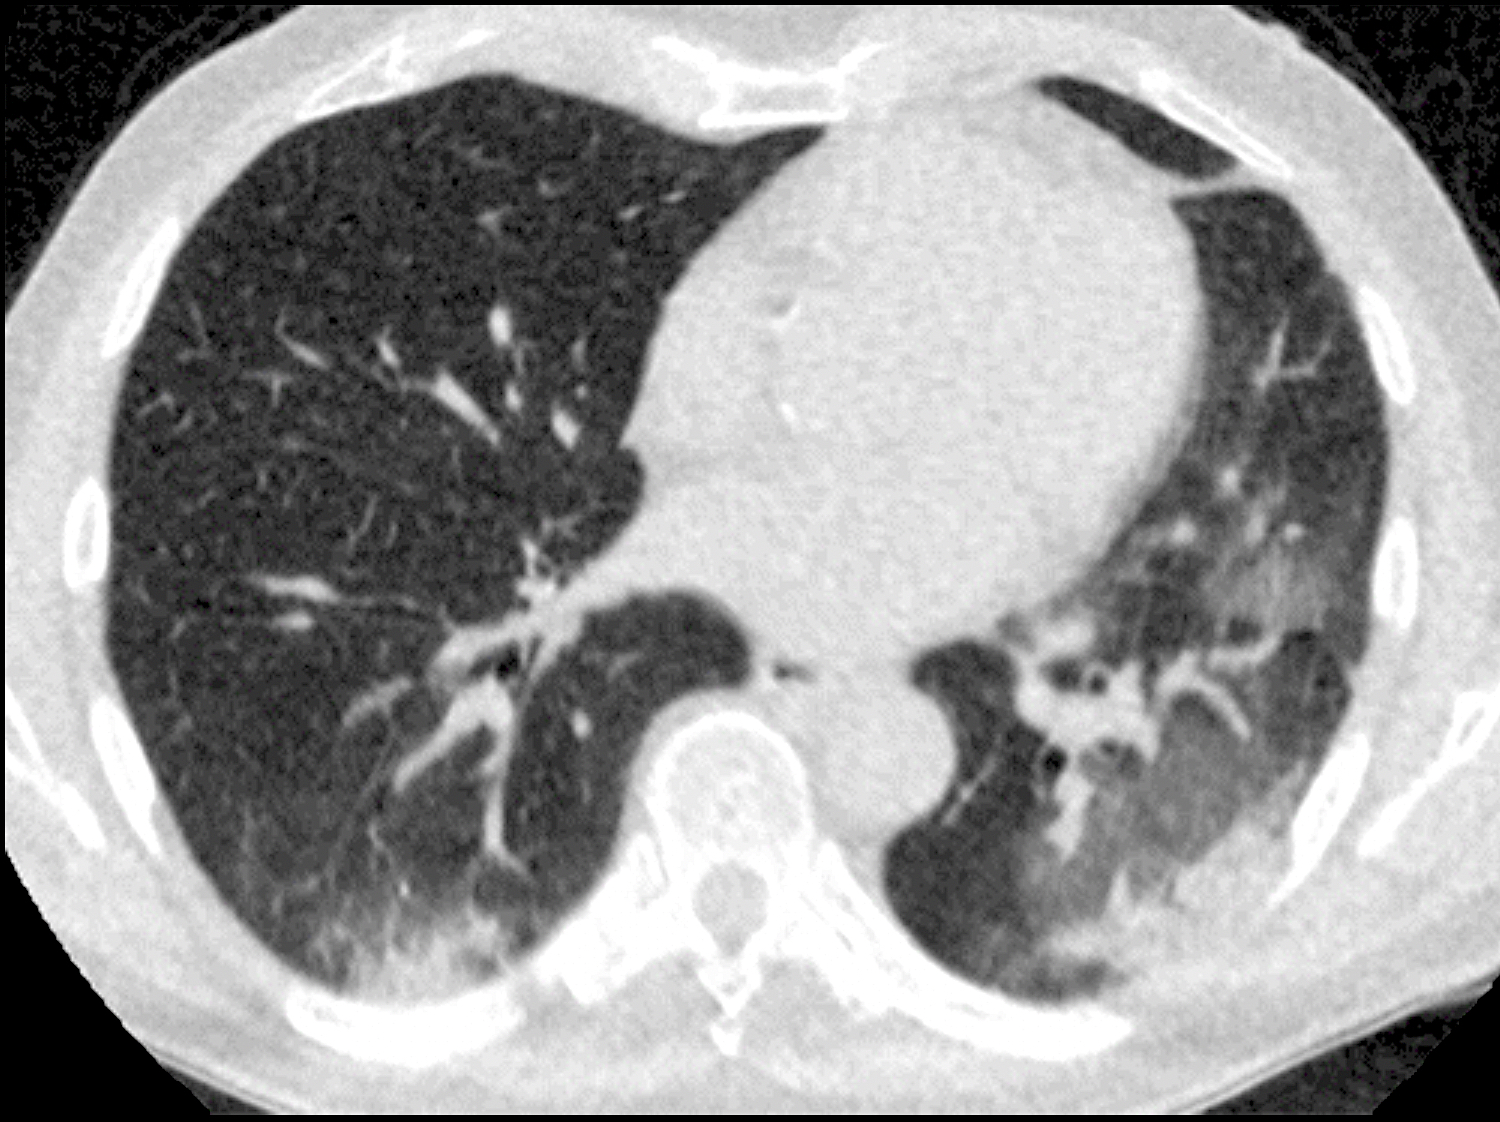
A typical view of a patient's lungs infected with COVID pneumonia, showing patchy, cloudy areas referred to as ground-glass opacities (GGO) caused by fluid and mucus build us inside the lung tissue. Lung CT of a 42-year-old man with more than 7 days of symptoms. Scans show COVID pneumonia with diffuse GGOs in close vicinity of visceral pleural surfaces. In addition, a crazy paving pattern is observed. Image courtesy of RSNA. Read more.
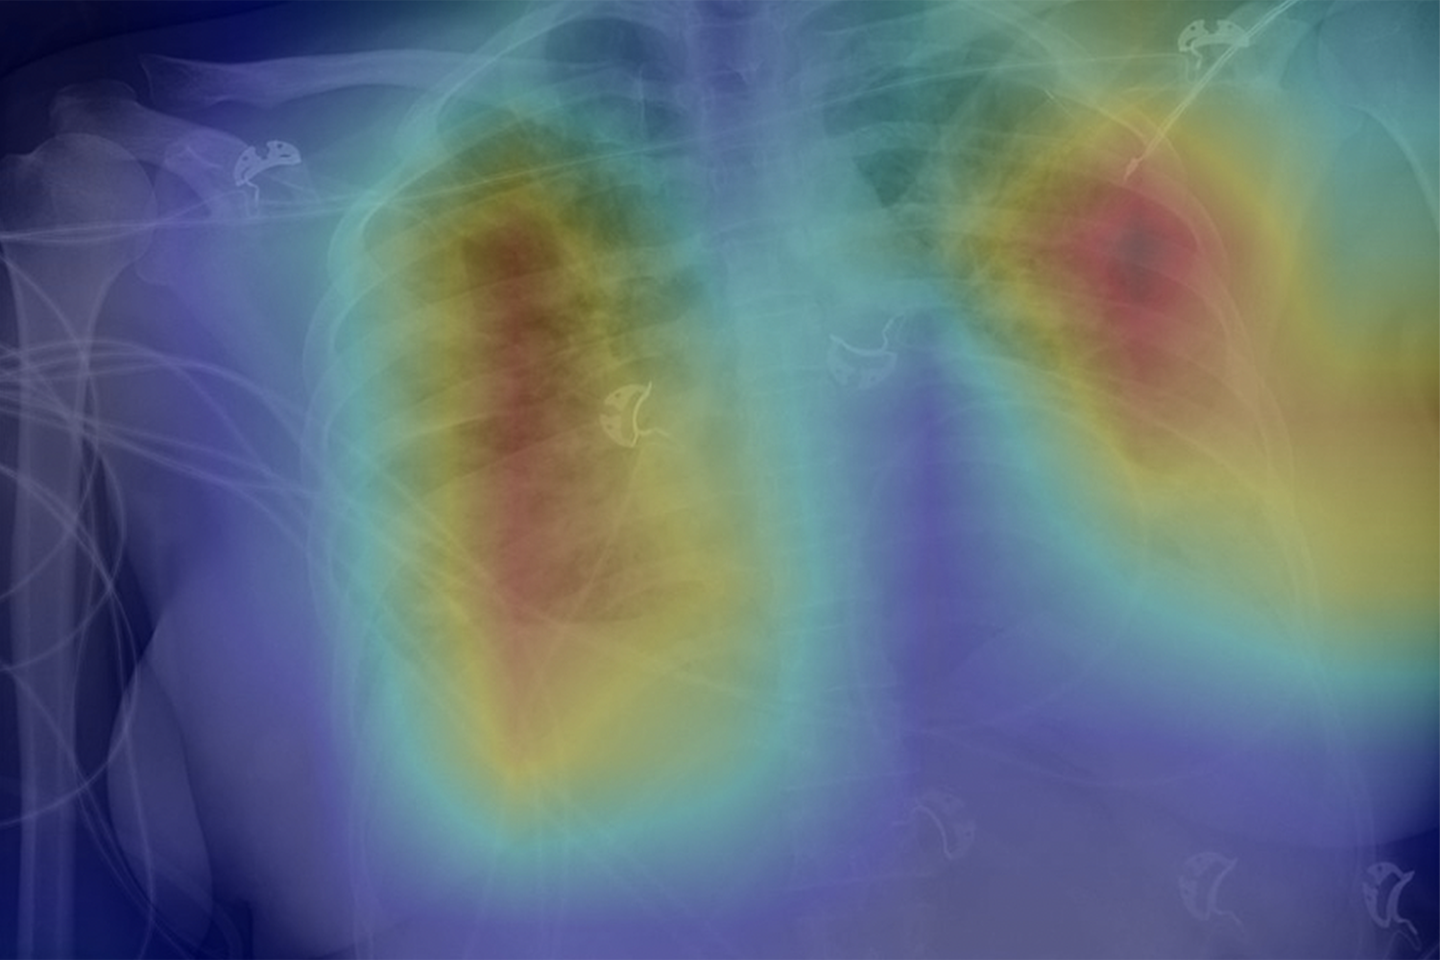
Early on in COVID, Johns Hopkins radiologists used a deep learning algorithm to detect tuberculosis in chest X-rays could be useful for identifying lung abnormalities related to COVID-19. This shows a an overlaid AI heat map of areas of COVID. Chest X-rays were proposed as a potentially useful tool for assessing COVID-19 patients, especially in overwhelmed emergency departments and urgent care centers, but the research team hypothesized that a deep learning model already trained to identify TB in X-rays would also work well to identify signs of the novel coronavirus. The AI was correct in 89% of cases. Read more. Image courtesy of Johns Hopkins.
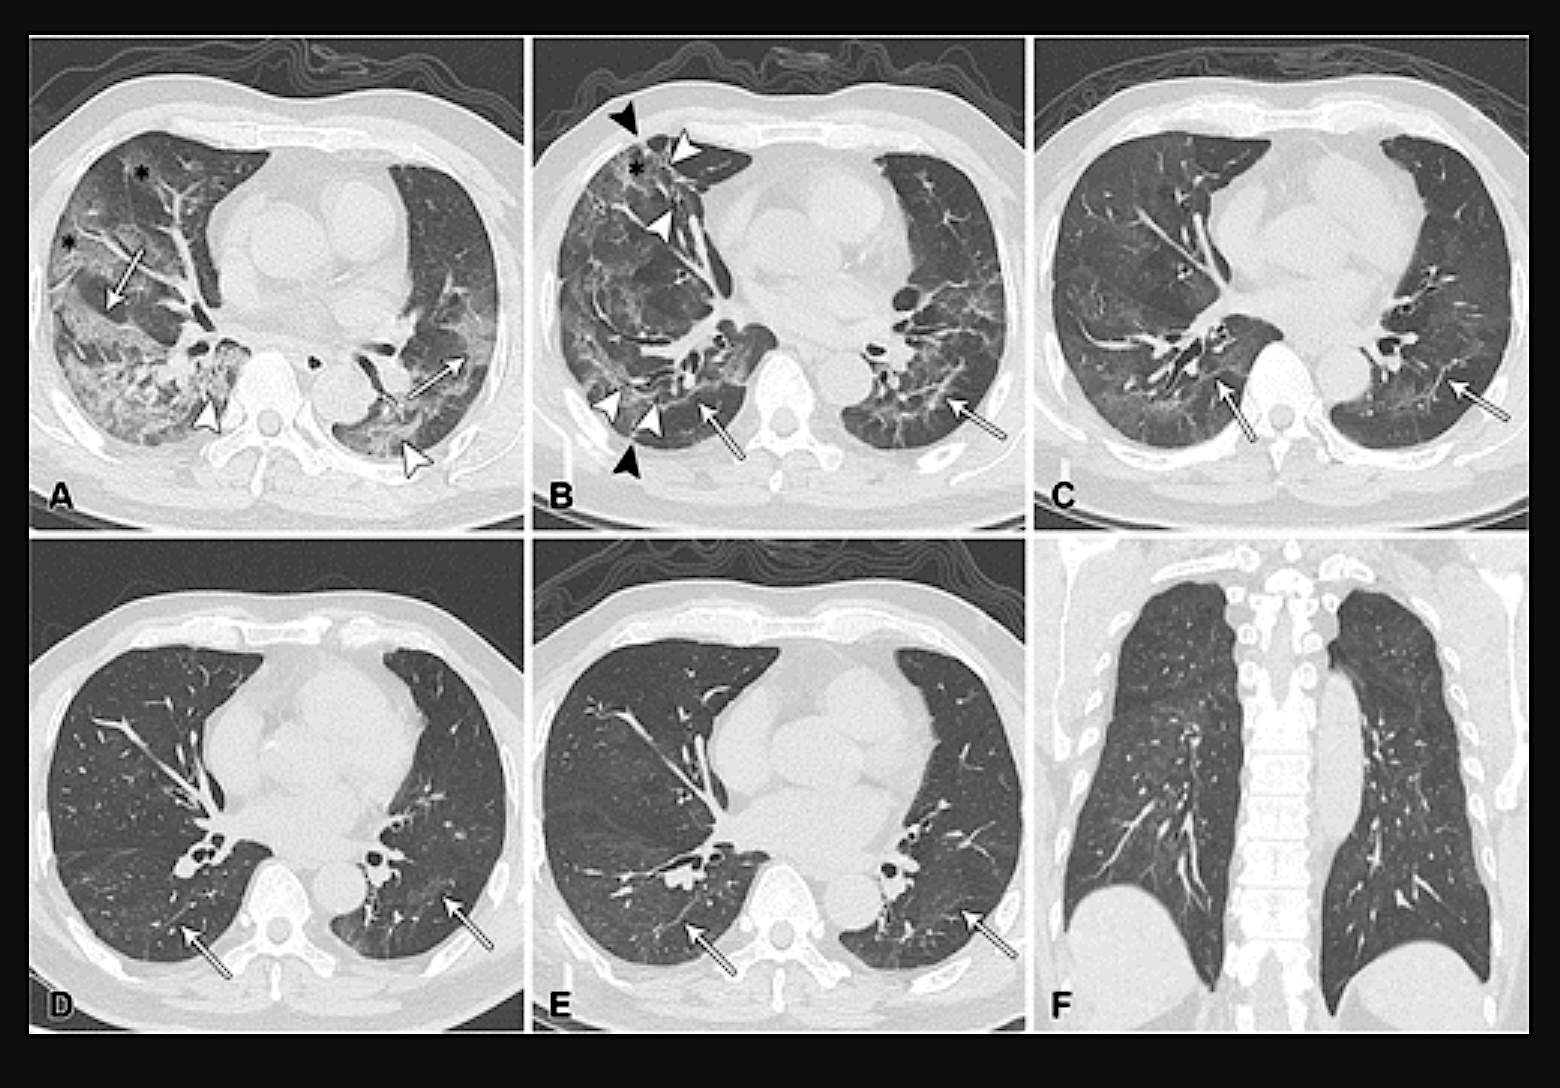
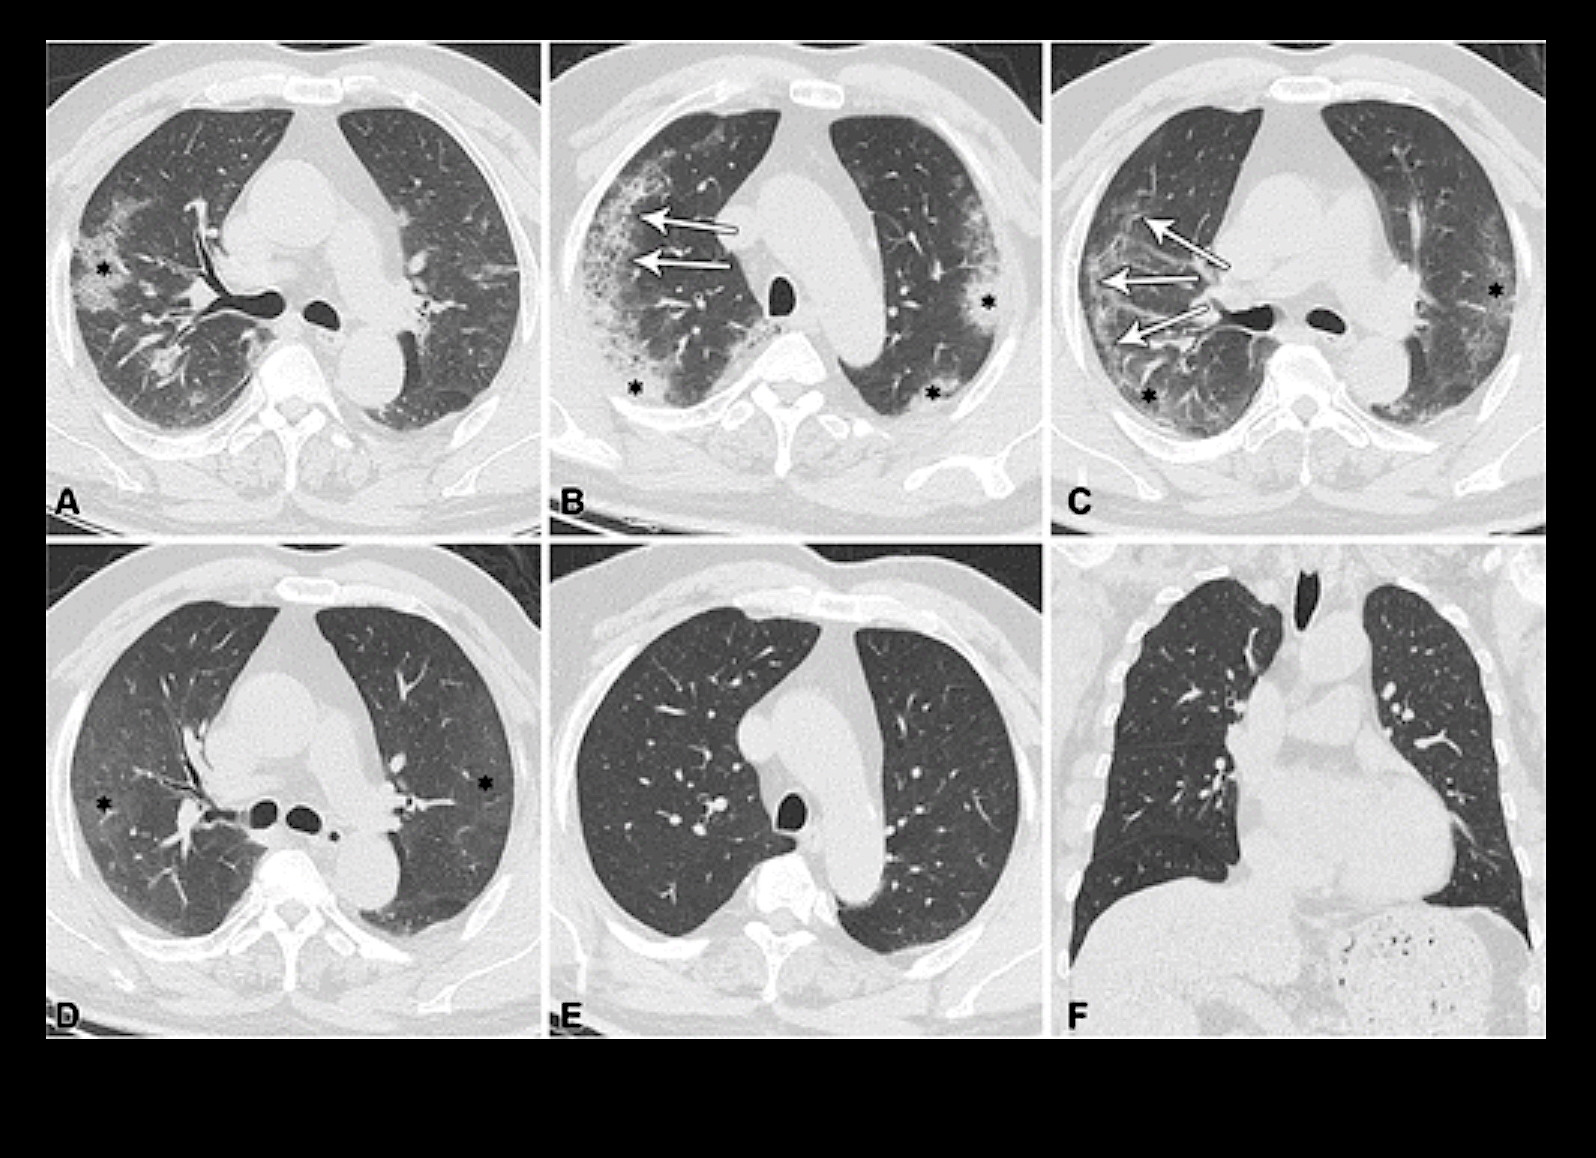
Series of CT scans showing patients do recover from COVID. Serial CT scans of a 64-year-old man, who progressed to acute respiratory distress syndrome caused by COVID-19. It shows typical findings over time for participants with residual linear opacities in the lungs. (A) Eight days after symptom onset, CT scan shows bilaterally diffuse mixed lesions, including ground-glass opacities (GGOs) (*), “crazy paving” appearance (arrows), and consolidation (arrowheads). (B) 52 days later, CT at discharge shows extensive GGOs and residual linear opacities (arrows), with focal volume loss indicated by displacement of major fissures, adjacent thickening of pleura, bronchial dilation (white arrowheads), parenchymal bands (black arrowheads), and reticular lesions (*). (C) After 3 months, continued resolution, with only residual GGOs and residual linear opacities (arrows) in bilateral lungs. (D) After 7 months. (E) After 12 months, and (F) previous CT scan. All images have same window level. Image courtesy of RSNA. Read more.
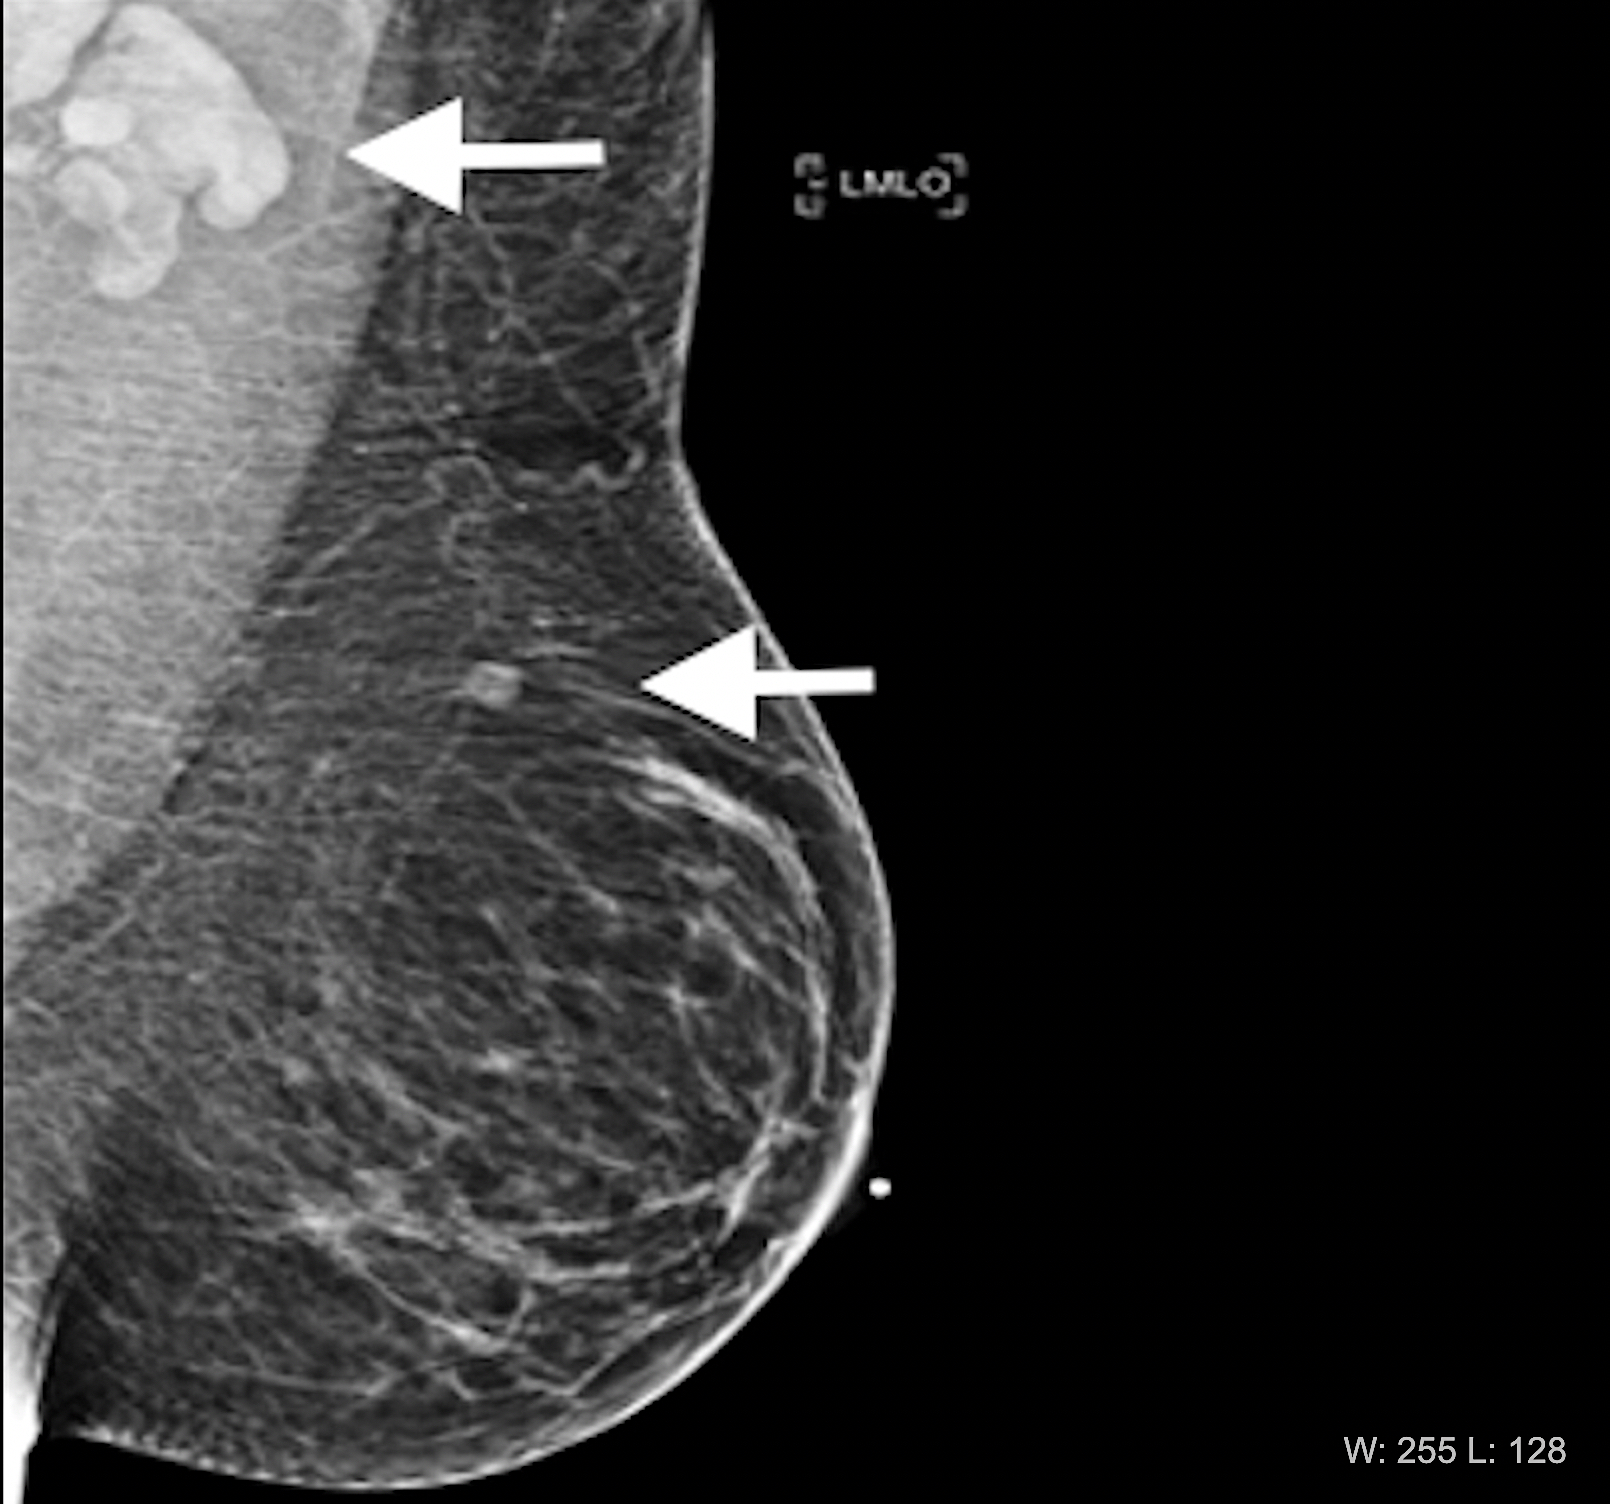
The COVID vaccines were found in early 2020 shortly after they were released they can cause immune response that mimics cancer on mammograms. Image in 37-year-old woman with palpable left supraclavicular adenopathy (swollen lymph node). Diagnostic mediolateral oblique mammogram of left breast shows prominent left axillary adenopathy and intramammary lymph node (arrows). LMLO = left medio-lateral oblique. She received her first dose of the Moderna COVID-19 vaccine 12 days before the mammogram in the left arm. Image courtesy of RSNA.
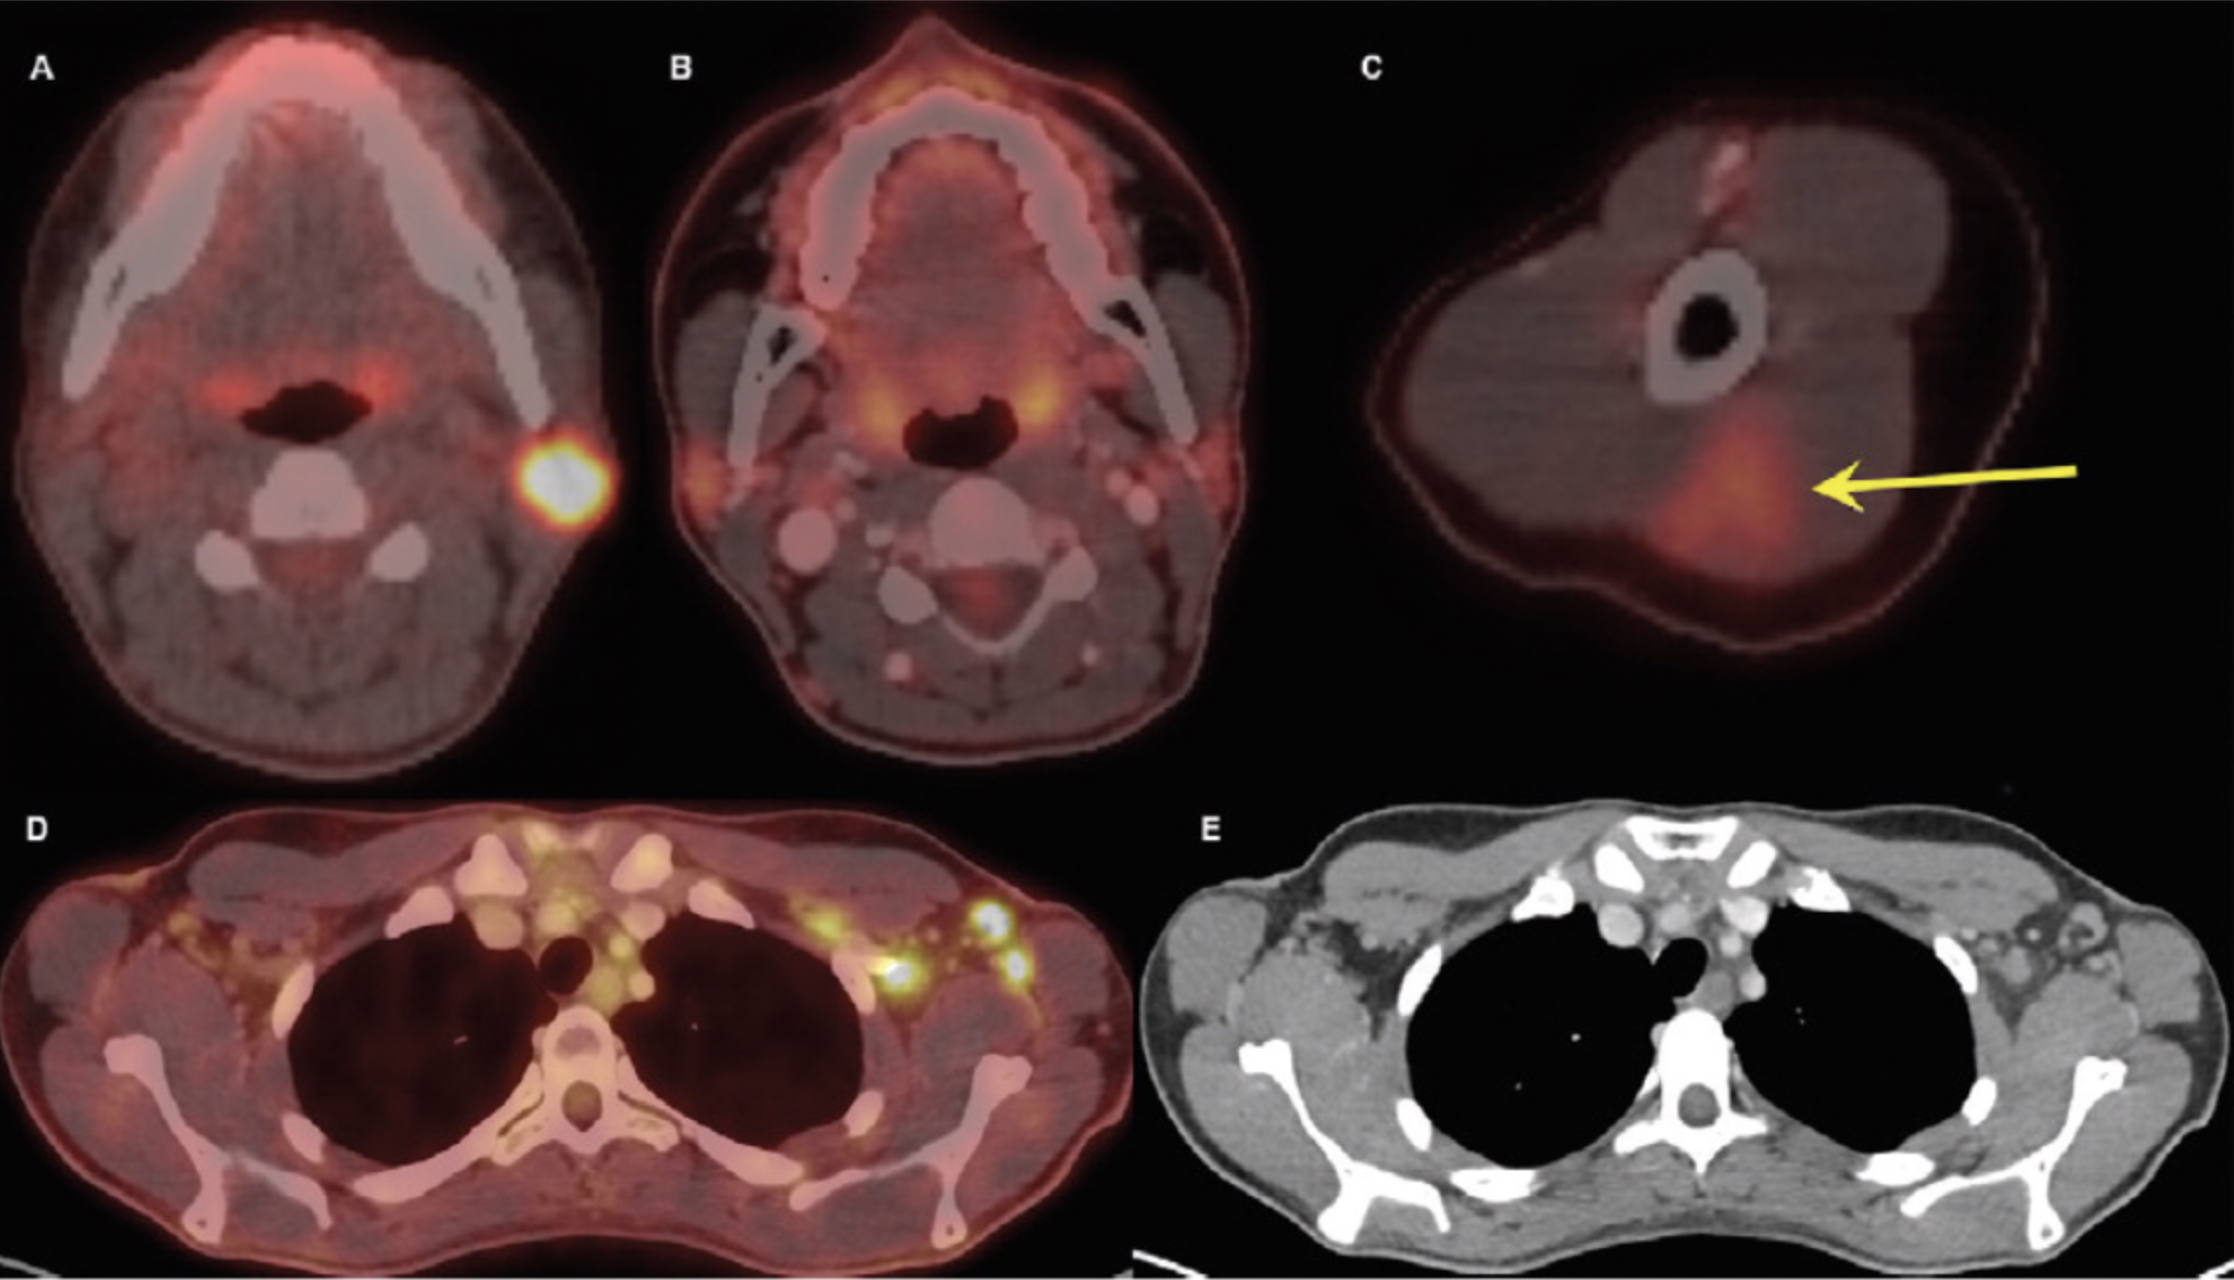
Top right nuclear image shows normal inflammation at the COVID vaccine injection site. A 32-year-old woman, A, axial fused 18F-FDG PET/CT shows hypermetabolic biopsy-proven intraparotid lymph node with metastatic malignant melanoma. B, Three-month follow-up axial fused 18F-FDG PET/CT shows complete resolution of neck mass following chemotherapy, while, C, left arm shows hypermetabolic triangular-shaped inflammation (arrow) at COVID-19 vaccine injection site. D, Axial fused images at axilla level shows multiple new hypermetabolic lymph nodes. E, Axial contrast-enhanced CT demonstrates mild fat stranding surrounding ovoid lymph nodes with preserved fatty hilum. Image courtesy of RSNA. Read more on this case.
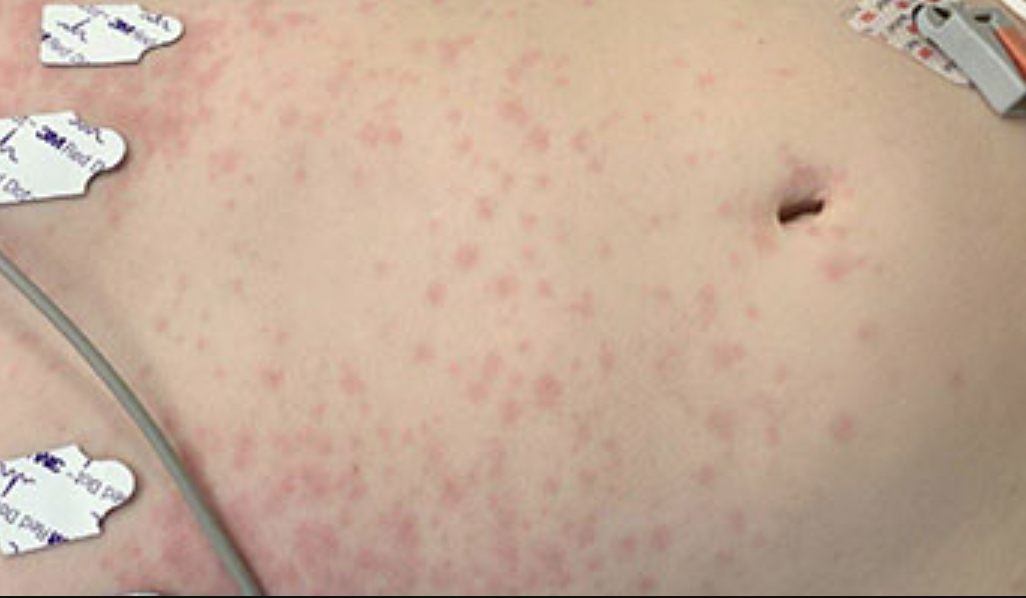
Rash on the torso of a pediatric patient with multi-system inflammatory syndrome in children (MIS-C). The rash is caused by hyperinflammation caused by the post-infectious complication of COVID infection. The syndrome effects a very small percentage of pediatric patients infected with COVID, including those who had completely asymptomatic infections. MIS-C results in an array of symptoms, including fever, gastrointestinal distress, rash and sometimes cardiac involvement. Image from Children’s Hospital of Philadelphia. Read more.
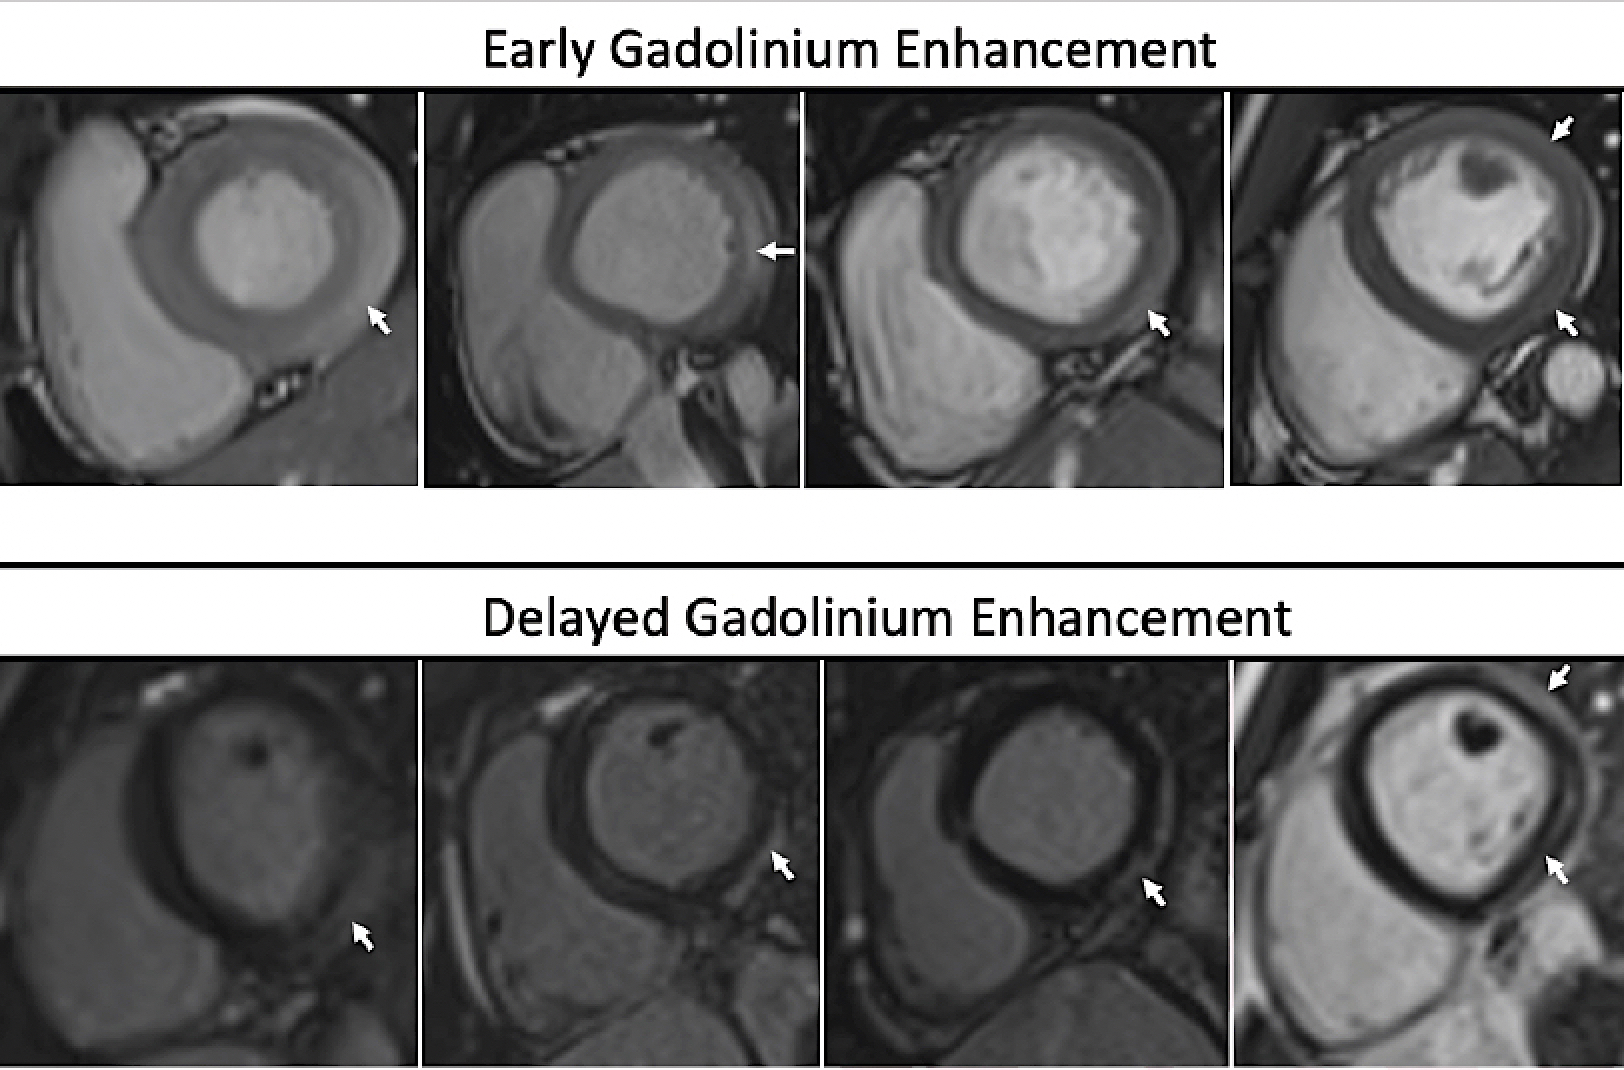
Myocarditis as seen on cardiac MRI in patients who recently received COVID-19 messenger RNA vaccination from a November 2021 imaging study. Myocarditis from the COVID vaccine is rare, but raised concerns, COVID itself caused much larger numbers and more dangerous cases of myocarditis. Image courtesy of the American Journal of Roentgenology (AJR)
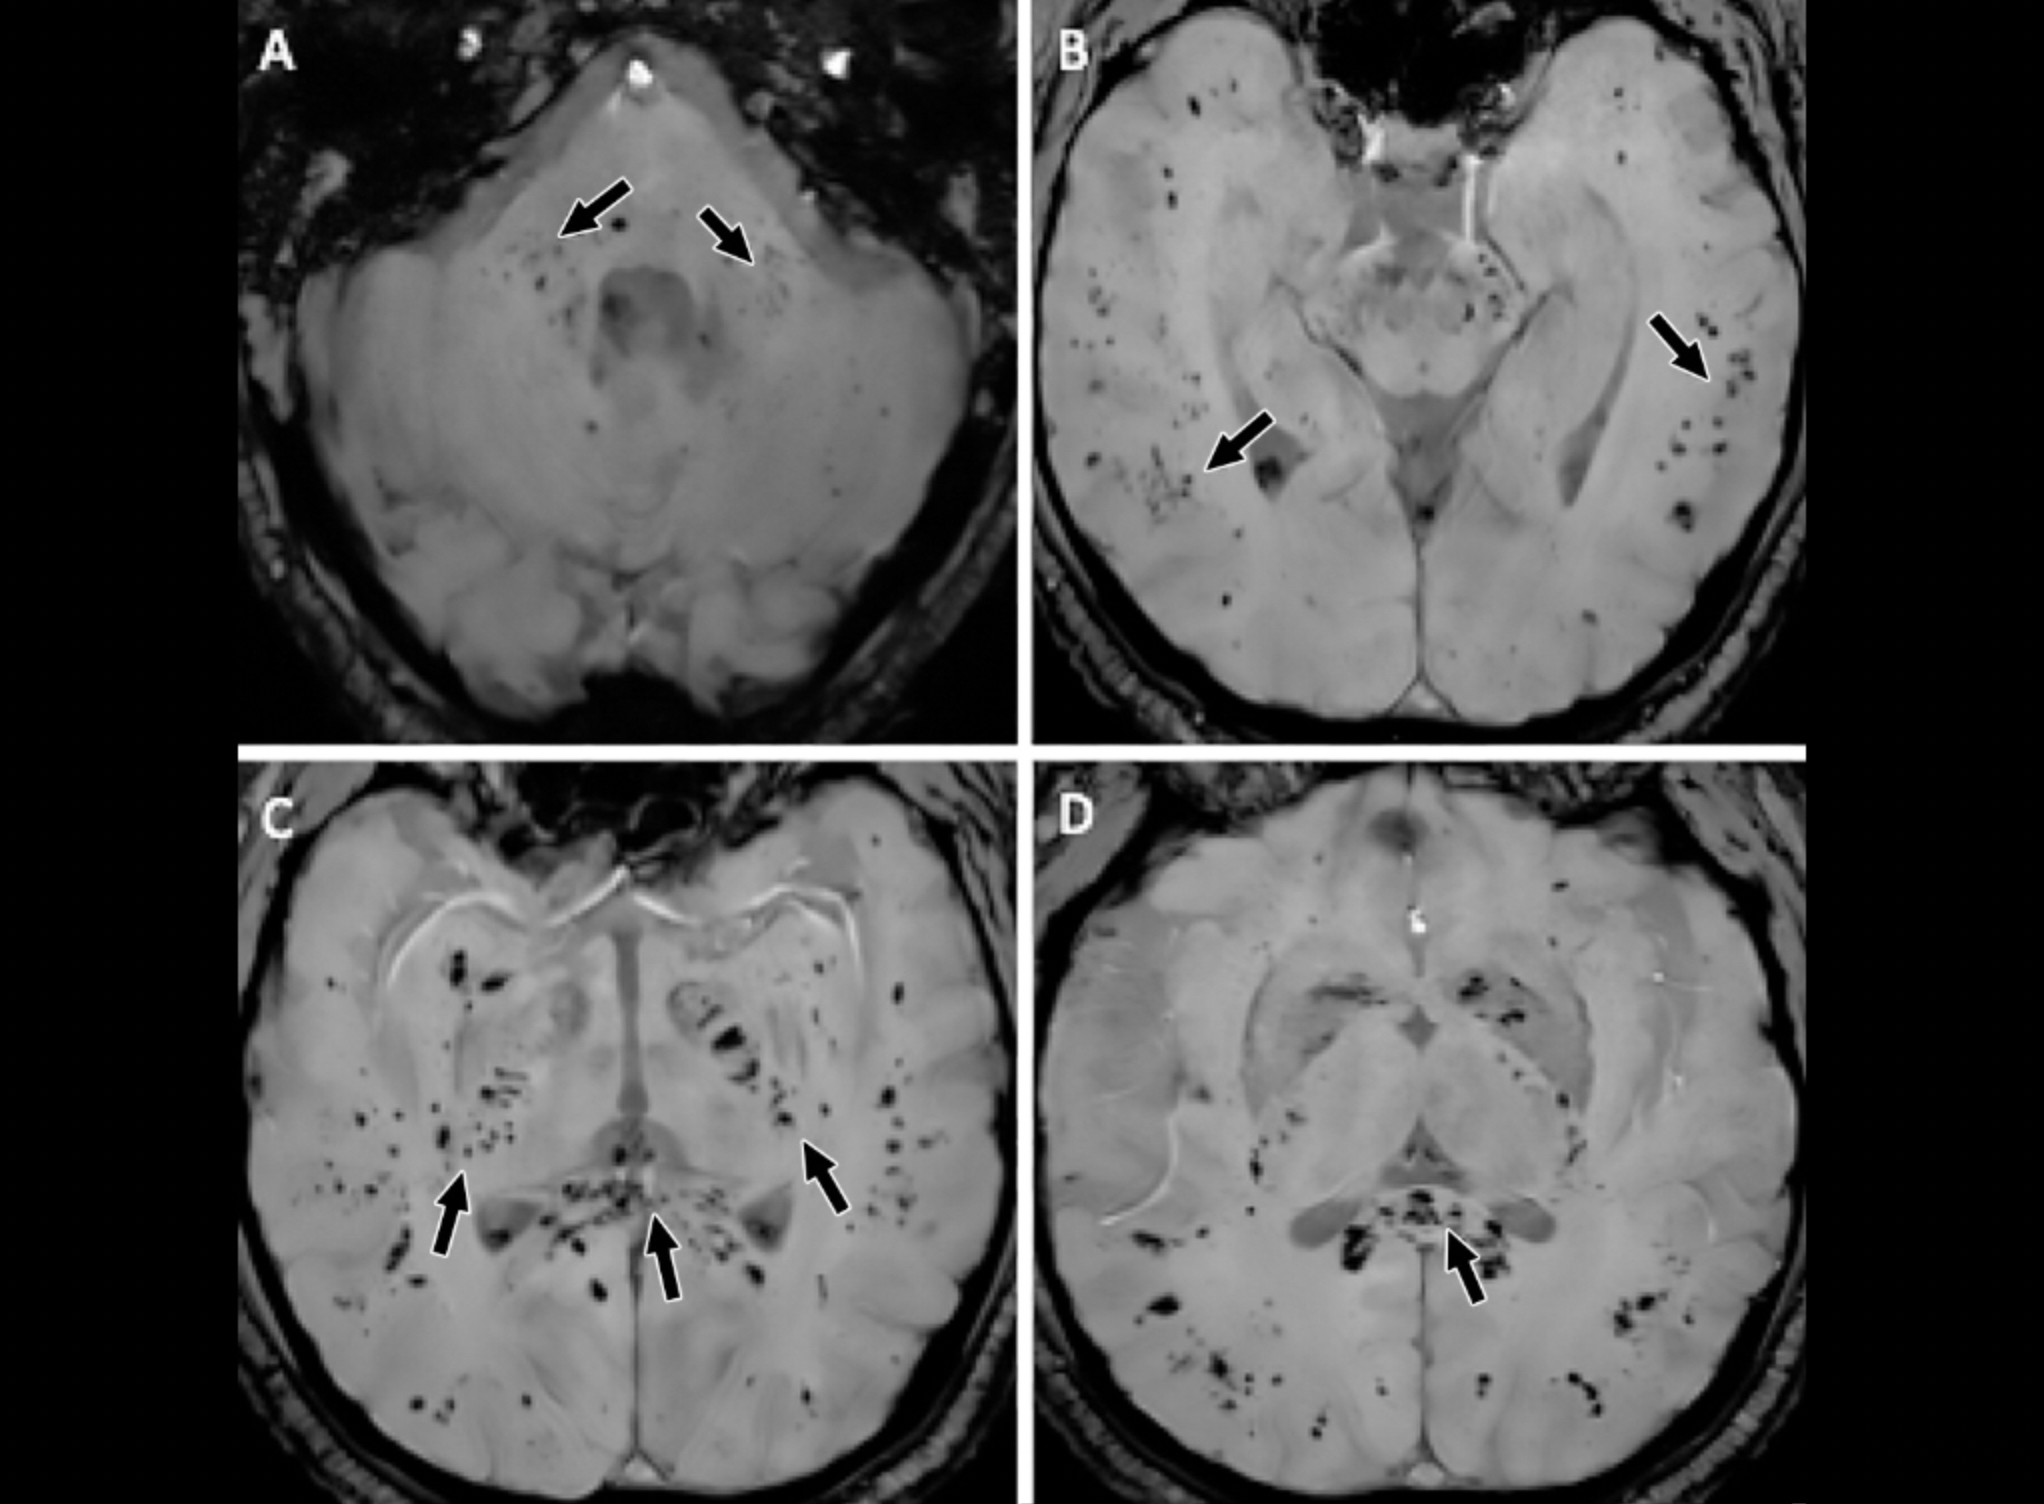
Intracranial cytokine storms can result in blood-brain barrier breakdown, but without direct viral invasion. MRI axial susceptibility-weighted images in a 57-year-old man with abnormal wakefulness after sedation show extensive and isolated white matter microhemorrhages mainly affecting the, A, cerebellar peduncles, B, subcortical white matter, C, internal capsule, and, D, corpus callosum. Image courtesy of RSNA. Read more.
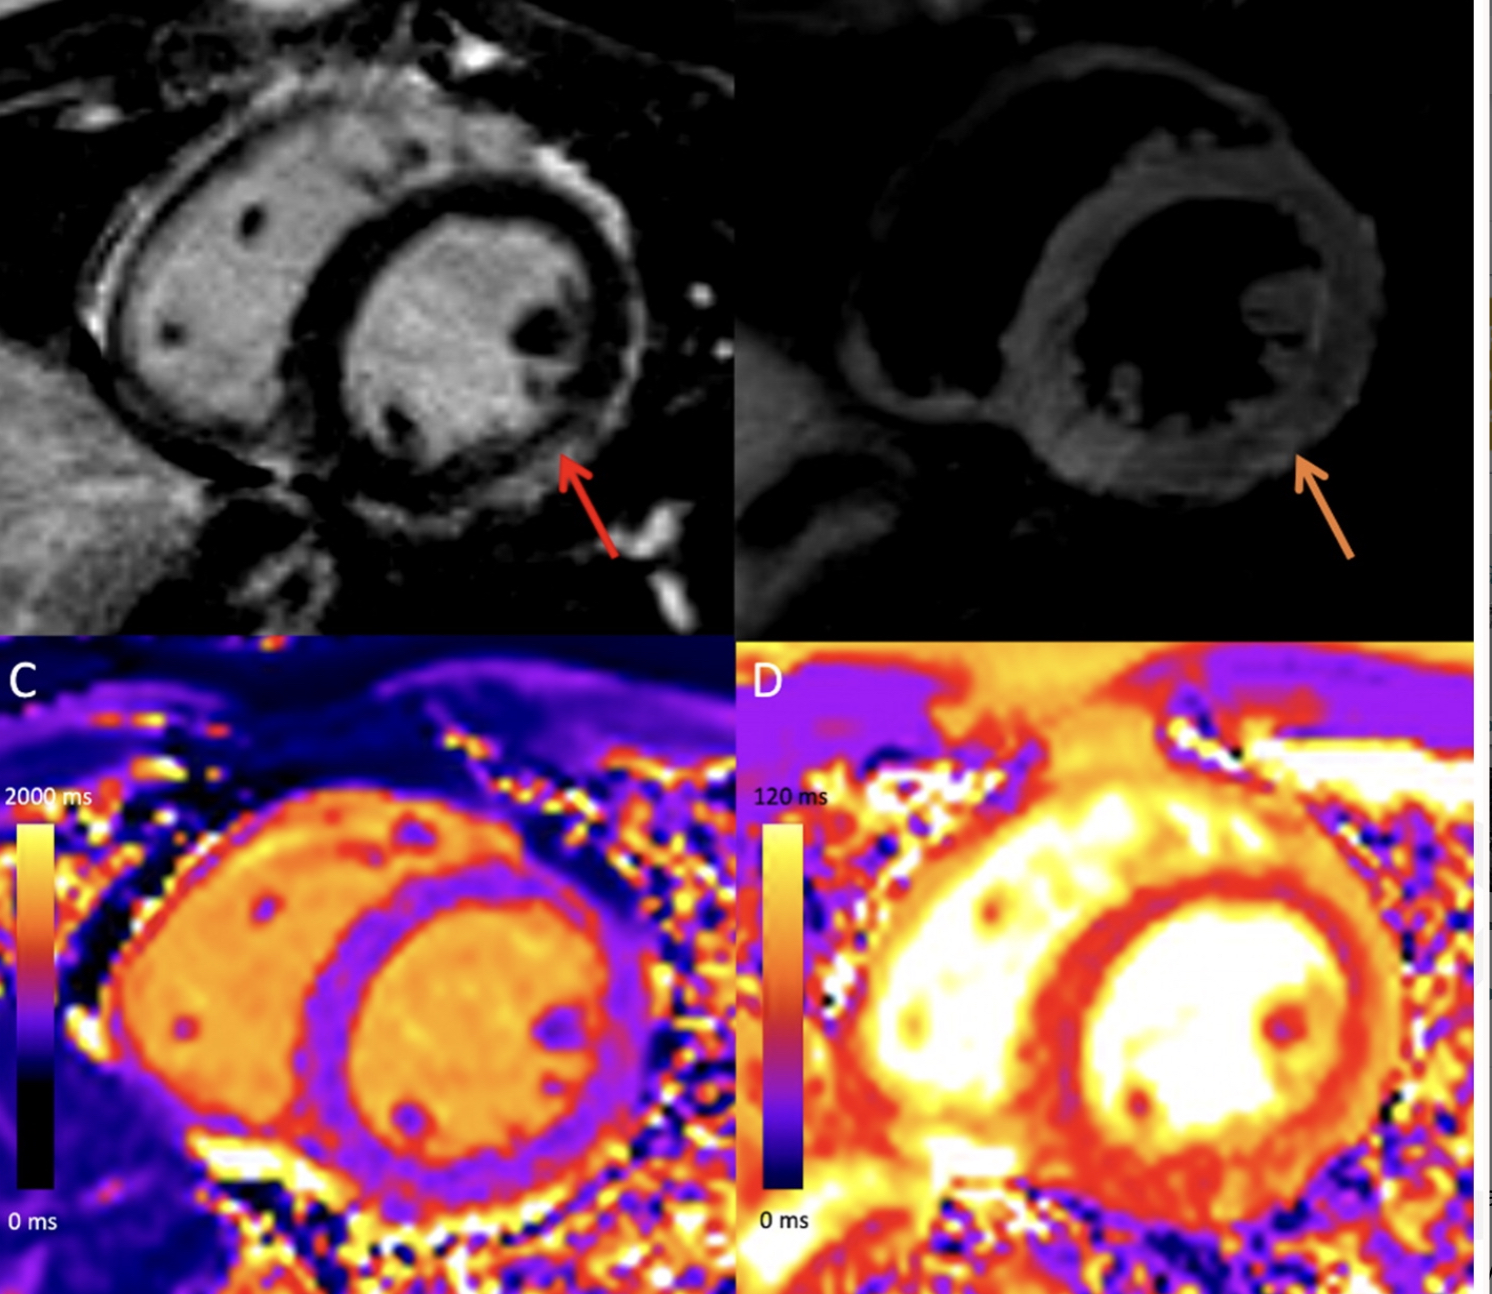
COVID-19 vaccine associated myocarditis on short-axis 1.5T MRI images of a 19-year-old man who presented with chest pain three days following the second dose of an mRNA COVID-19 vaccine. Cardiac MRI performed two days after symptom onset demonstrates mid wall to subepicardial late gadolinium enhancement (LGE) at the basal to mid inferior lateral wall with adjacent pericardial enhancement (red arrows), corresponding hyperintensity on T2-weighted imaging (orange arrows. He was admitted and was discharged after two days following complete resolution of his symptoms. Image courtesy of RSNA. Read more.

Examples of thrombus formation after COVID-19 vaccinations. While rare, clots in these images were determined to be from the vaccine itself. Images in a 56-year-old man with sudden loss of consciousness 2 weeks after vaccination for COVID-19 and subsequently diagnosed with VITT. (A) Axial contrast enhanced CT venogram Maximum Intensity Projection shows occlusive thrombus within the left transverse sinus (white arrow) and adjacent large volume parenchymal hemorrhage in the left parietal lobe (red arrow). Subsequent whole body imaging was performed. (B) Axial CT pulmonary angiogram showing a segmental PE (white arrow) and peripheral upper lobe infarct (red arrow) and in (C) Coronal contrast enhanced abdominal CT showing large volume main and right portal vein thrombosis (white arrow) and hepatic vein thrombosis (red arrow) confirmed in (D) an axial image from the same study showing hepatic vein thrombus in both the middle and right hepatic veins. Read more. Images courtesy of RSNA.
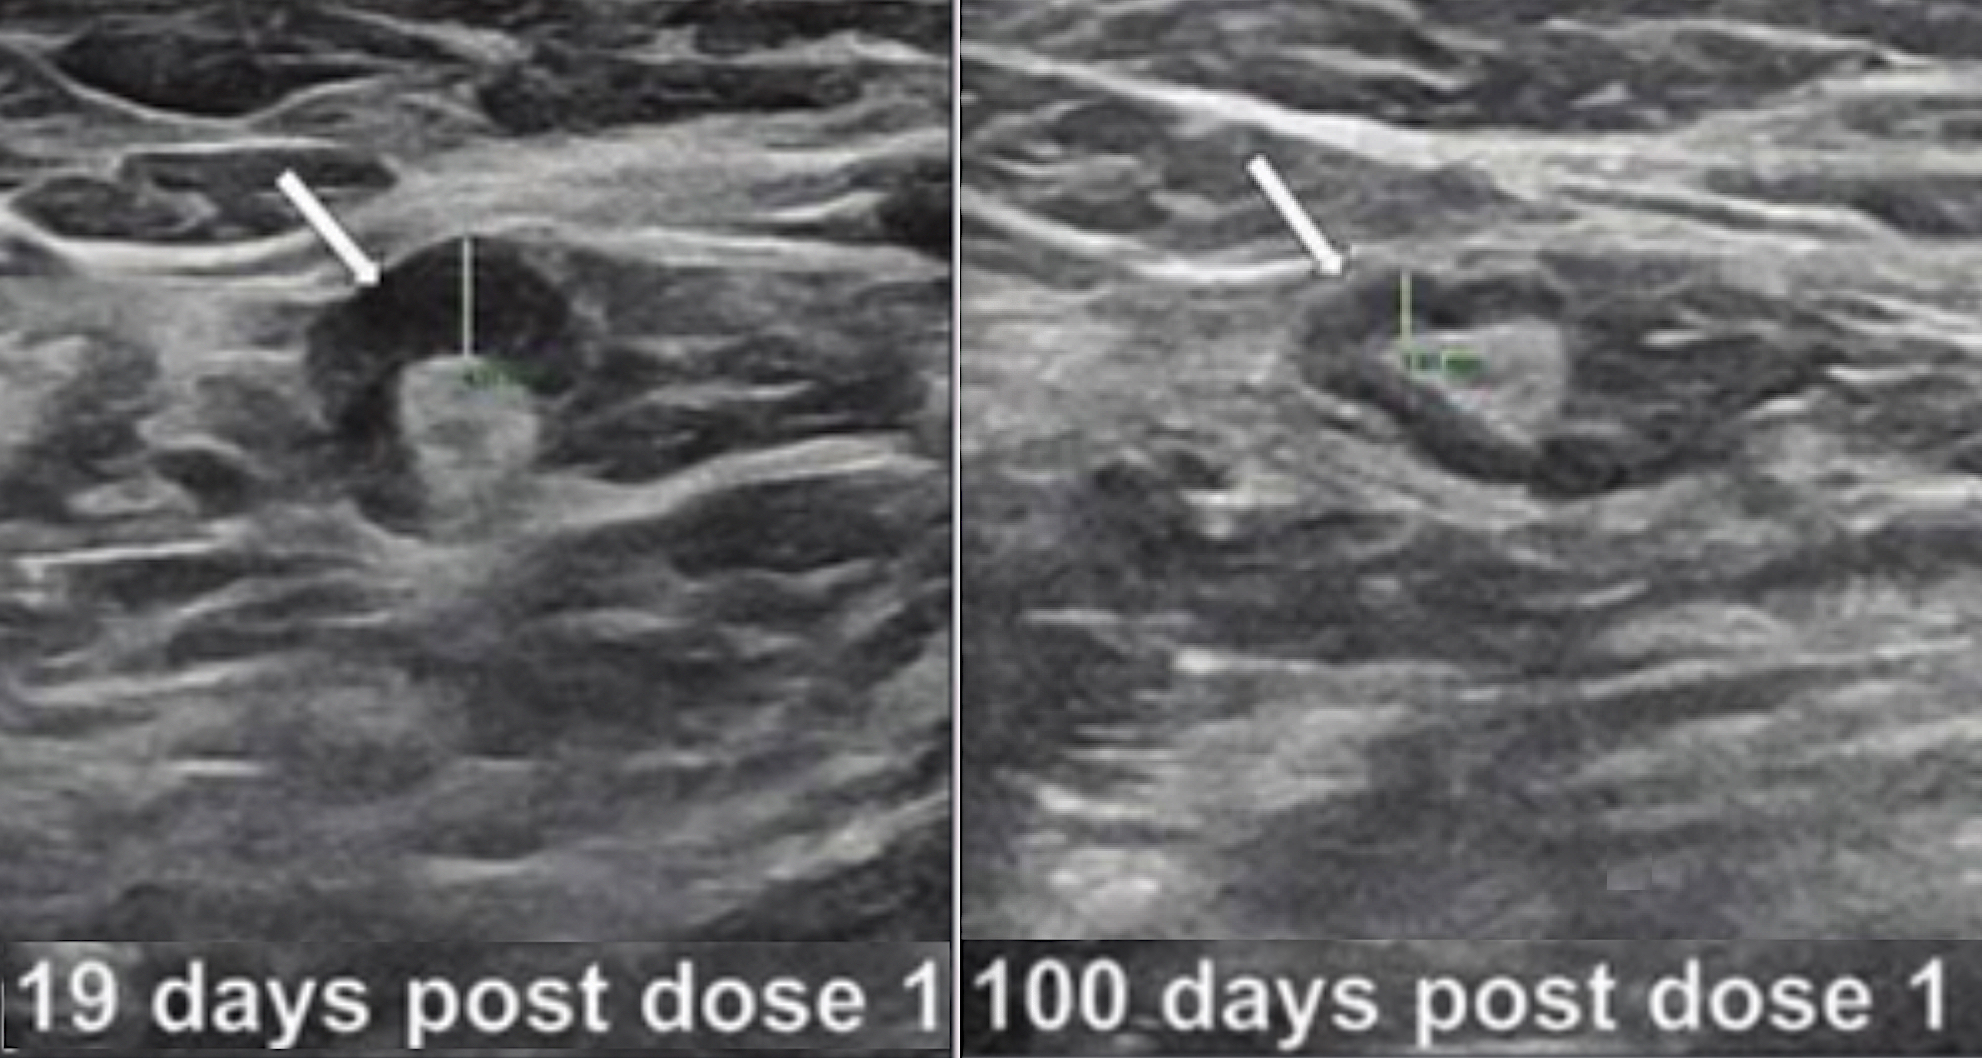
Left, transverse image of left axilla on initial breast ultrasound, 19 days after first dose of Pfizer COVID-19 vaccination to left upper extremity in a 37-year-old women who came in for bilateral screening breast ultrasound. Shows increased cortical thickness of 4 mm (arrow). Right, transverse image of left axilla on follow-up ultrasound, 100 days after first COVID-19 vaccine dose, demonstrates cortical thickness of 2 mm (arrow), consistent with resolution of left axillary lymphadenopathy (arrow). Patient underwent second dose 2 days after initial ultrasound. Image Courtesy of AJR. Read more on this case.

MRI of the foot in a patient with severe COVID-19. The grey part of the foot is gangrene. The 57-year-old male with prolonged hospitalization for COVID-19 and multi-organ failure was imaged at Northwestern Medicine in Chicago. The post-contrast, T1-weighted fat saturated image demonstrates soft tissue enhancement of the proximal foot (dashed arrow) with non-enhancing devitalized tissue distally (gray tissue by toes), compatible with gangrene. Multifocal bone marrow edema pattern is compatible with associated osteonecrosis. MRI can show edema and inflammatory changes of the tissues (fluid, swelling) from COVID infection, even in some patients who were otherwise asymptomatic. Read the Northwestern study.
High resolution non-contrast chest CT findings in a 72-yr-old man with COVID-19 pneumonia over a 1-year follow-up. (A) Baseline axial section shows extensive hazy GGO with dark bronchogram signs in the lower lung lobes (lung severity score of 12/20). (B) Incomplete recovery of GGO areas and the presence of reticulation and multiple medullary traction bronchiectasis/bronchiolectasis (black arrows) with “corkscrew” features suggestive of architectural fibrotic distortion, as for an overlapping fibrosing organizing pneumonia/nonspecific interstitial pneumonia pattern, are appreciable at 1-year follow-up. Image courtesy of RSNA. Read more.
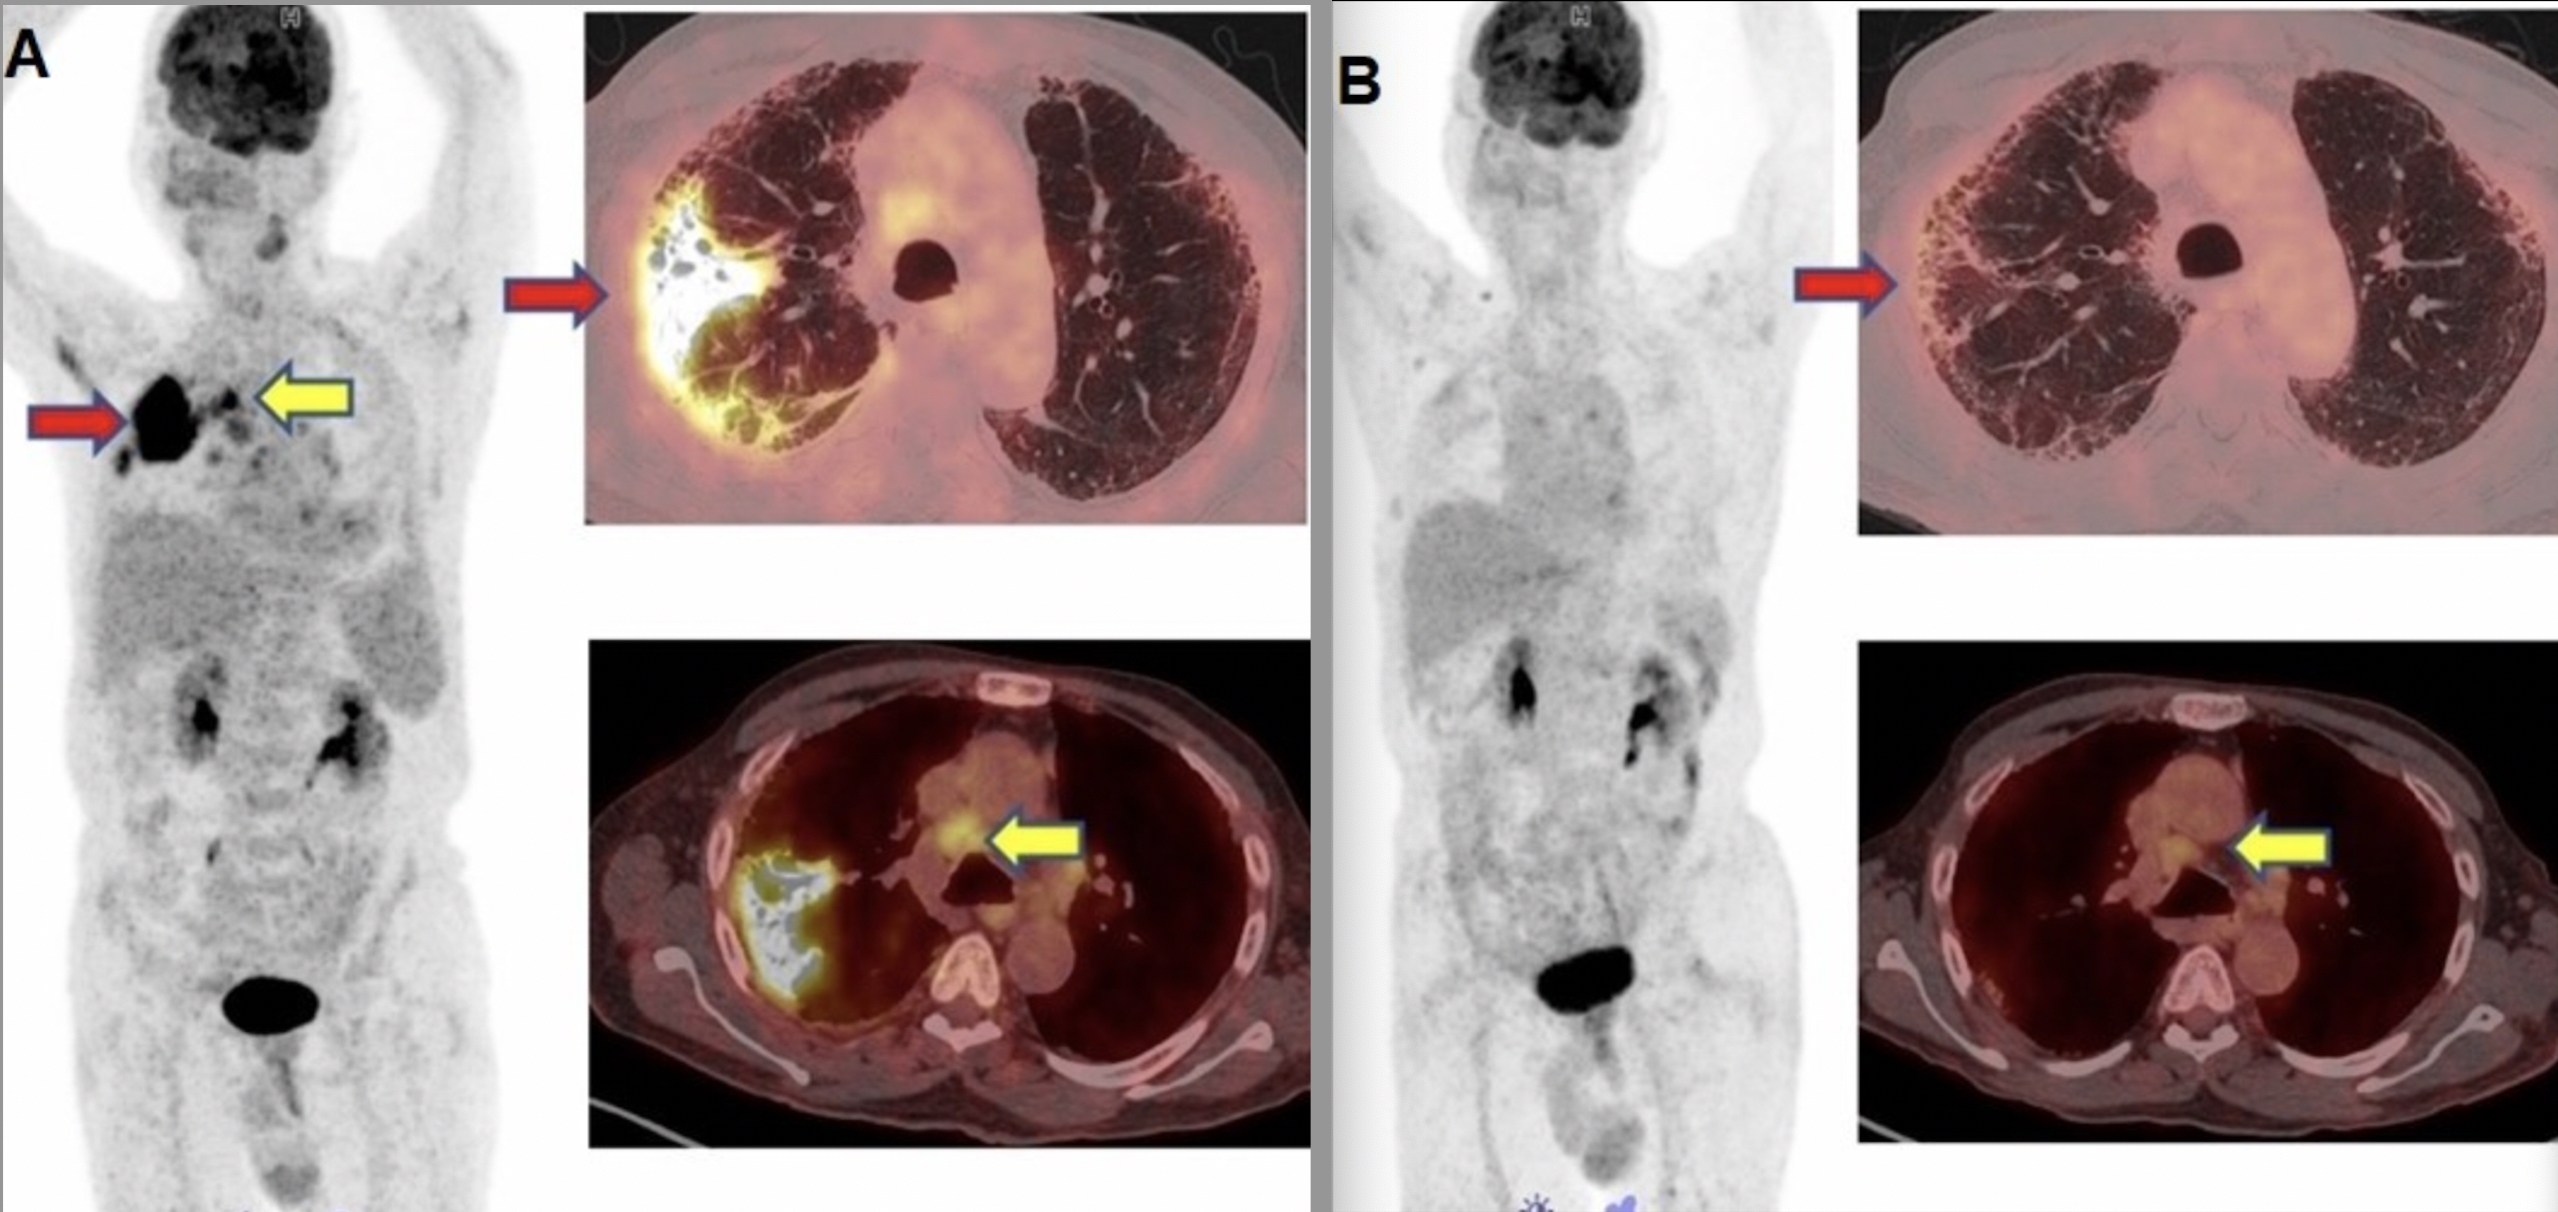
A 71-year-old male was diagnosed with COVID-19 in October 2020. He was treated and discharged from the hospital. He was readmitted to the hospital for respiratory failure in January 2021. He underwent 18F-FDG PET/CT. (A) MIP whole-body image and axial fused PET/CT show FDG-avid (SUV max – 12.7) consolidation in the right lung (red arrow). Non-tracer-avid changes are noted in both lungs on CT. FDG-avid mediastinal lymph nodes (SUV max – 4.4) (yellow arrow) were also noted. The patient was given steroids and Pirfenidone for two months. He showed significant improvement in symptoms with no O2 requirement. (B) Follow-up PET/CT reveals complete resolution of the lung lesion and non-avid residual fibrotic changes in both lungs (red arrow). Mediastinal lymph nodes also show a decrease in avidity (SUV max – 2.5). Image from SNMMI. Read more.
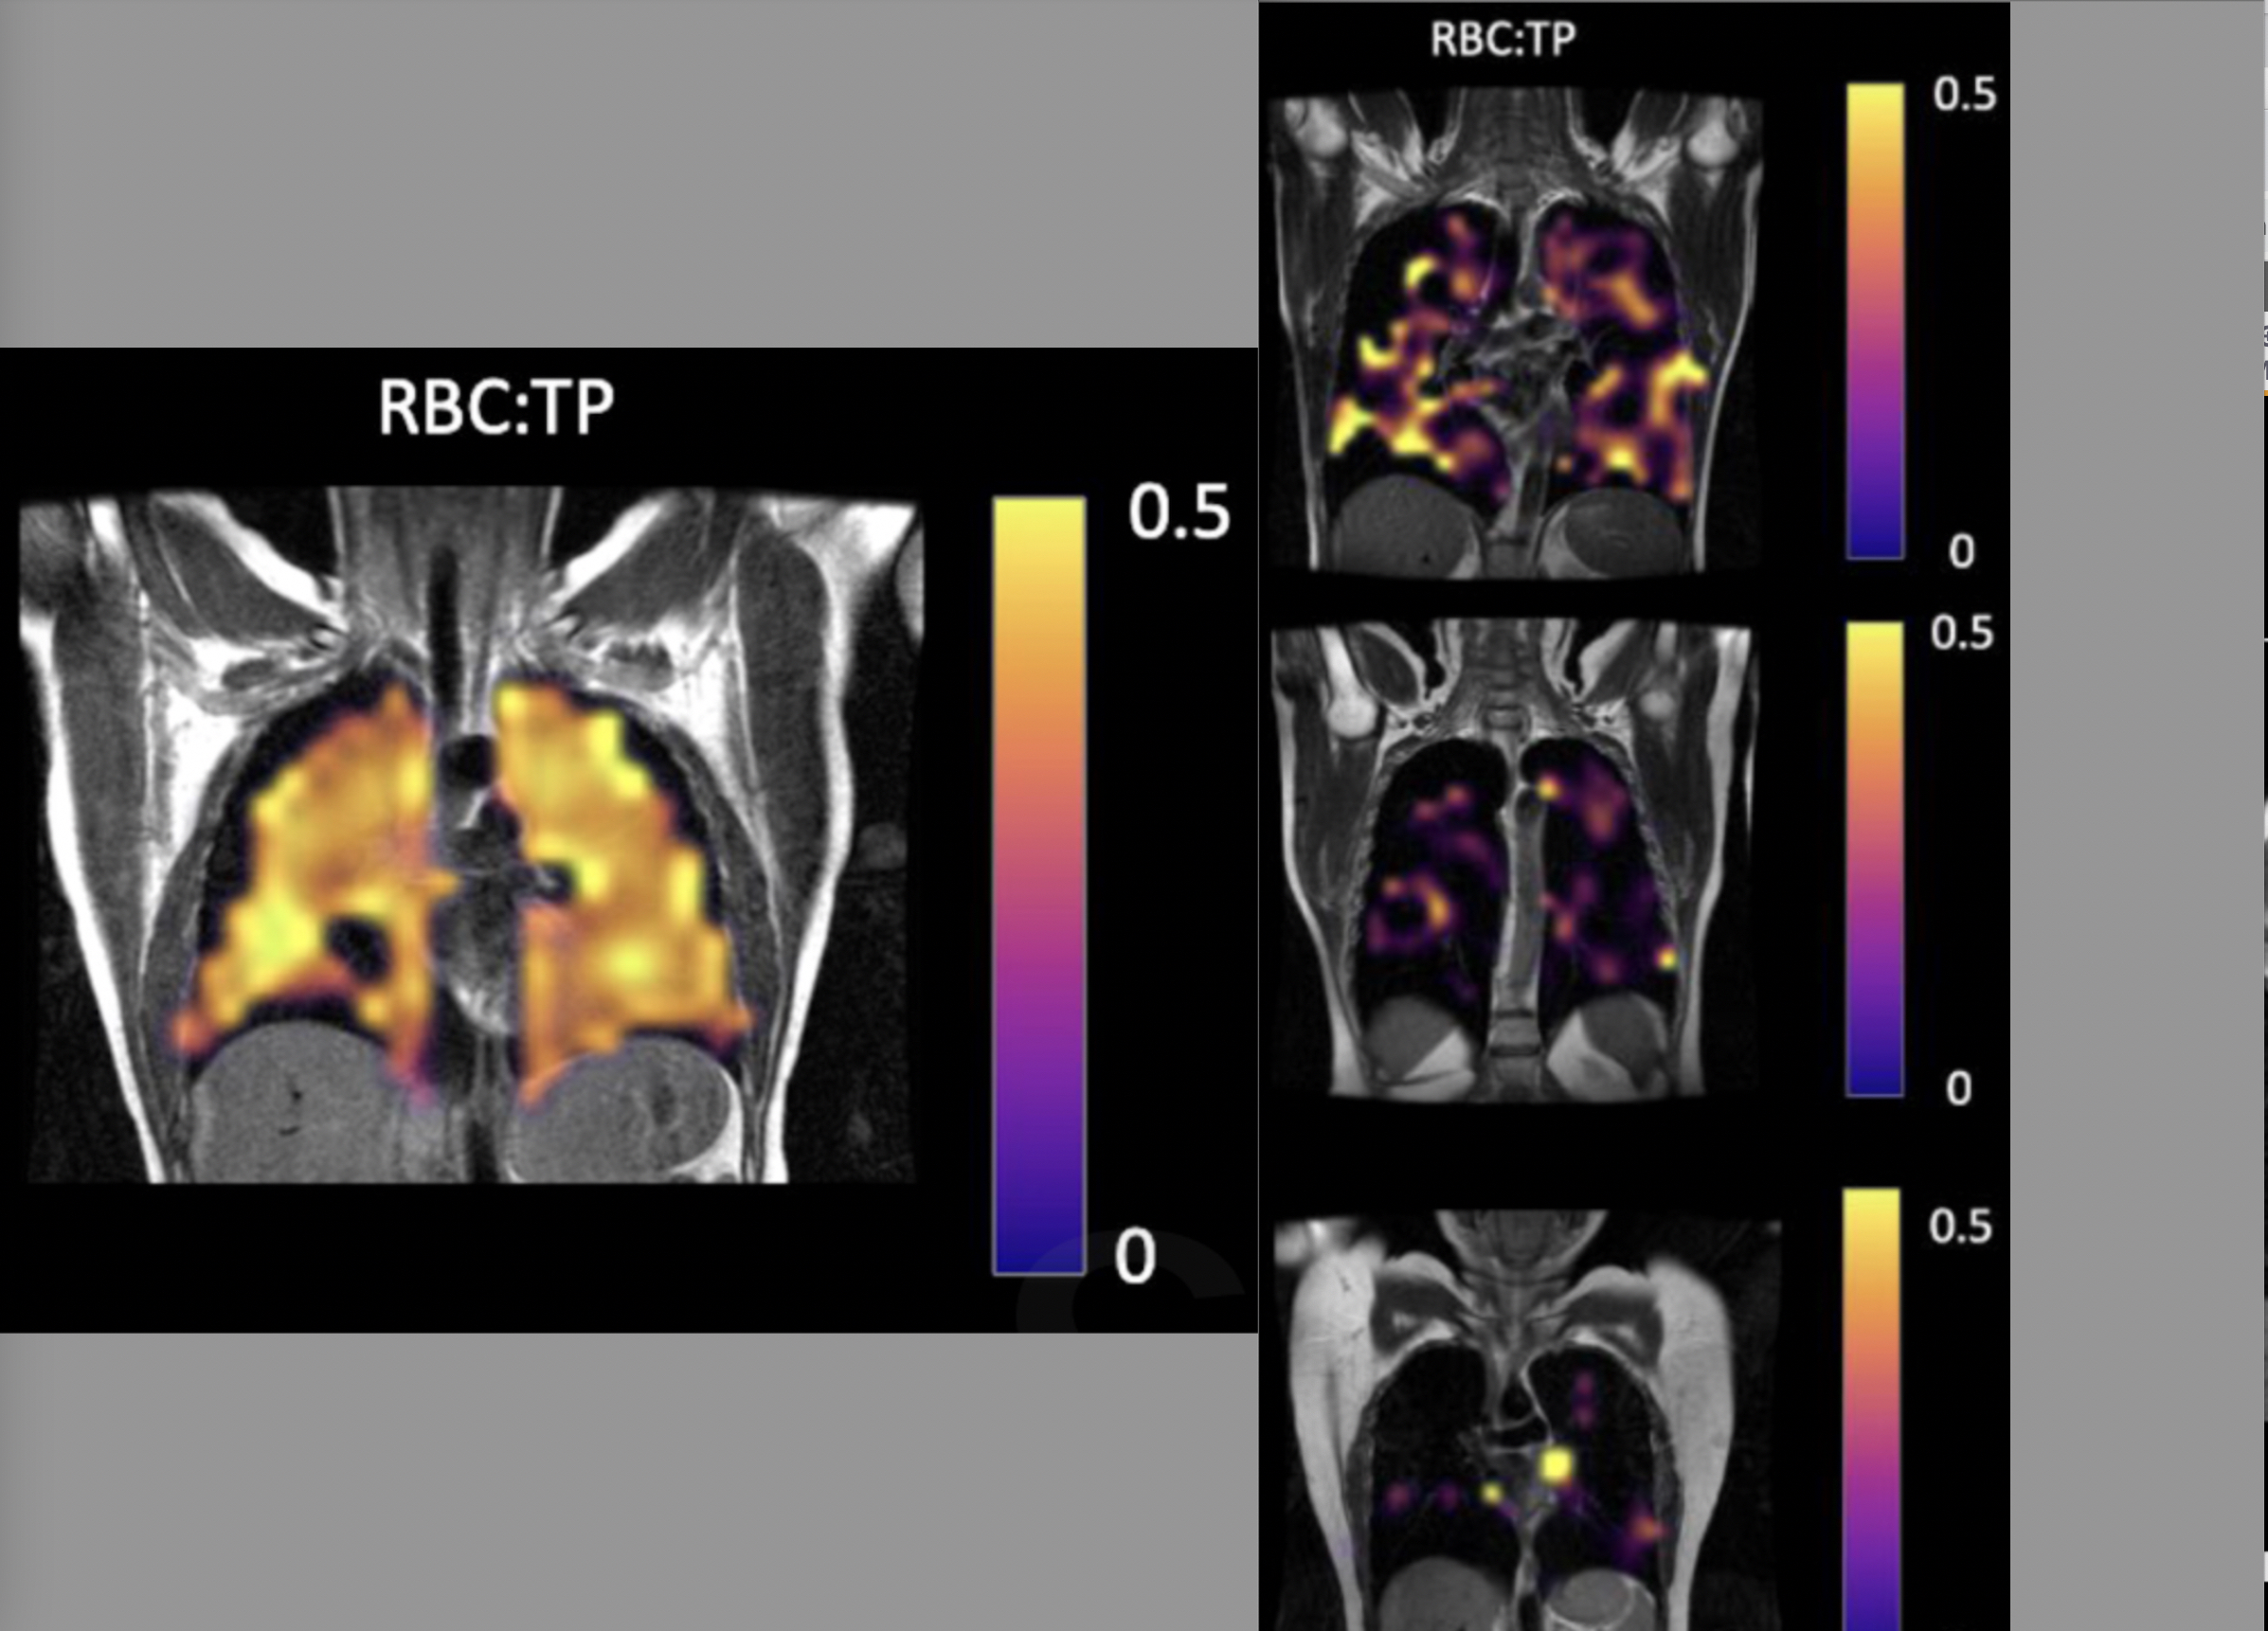
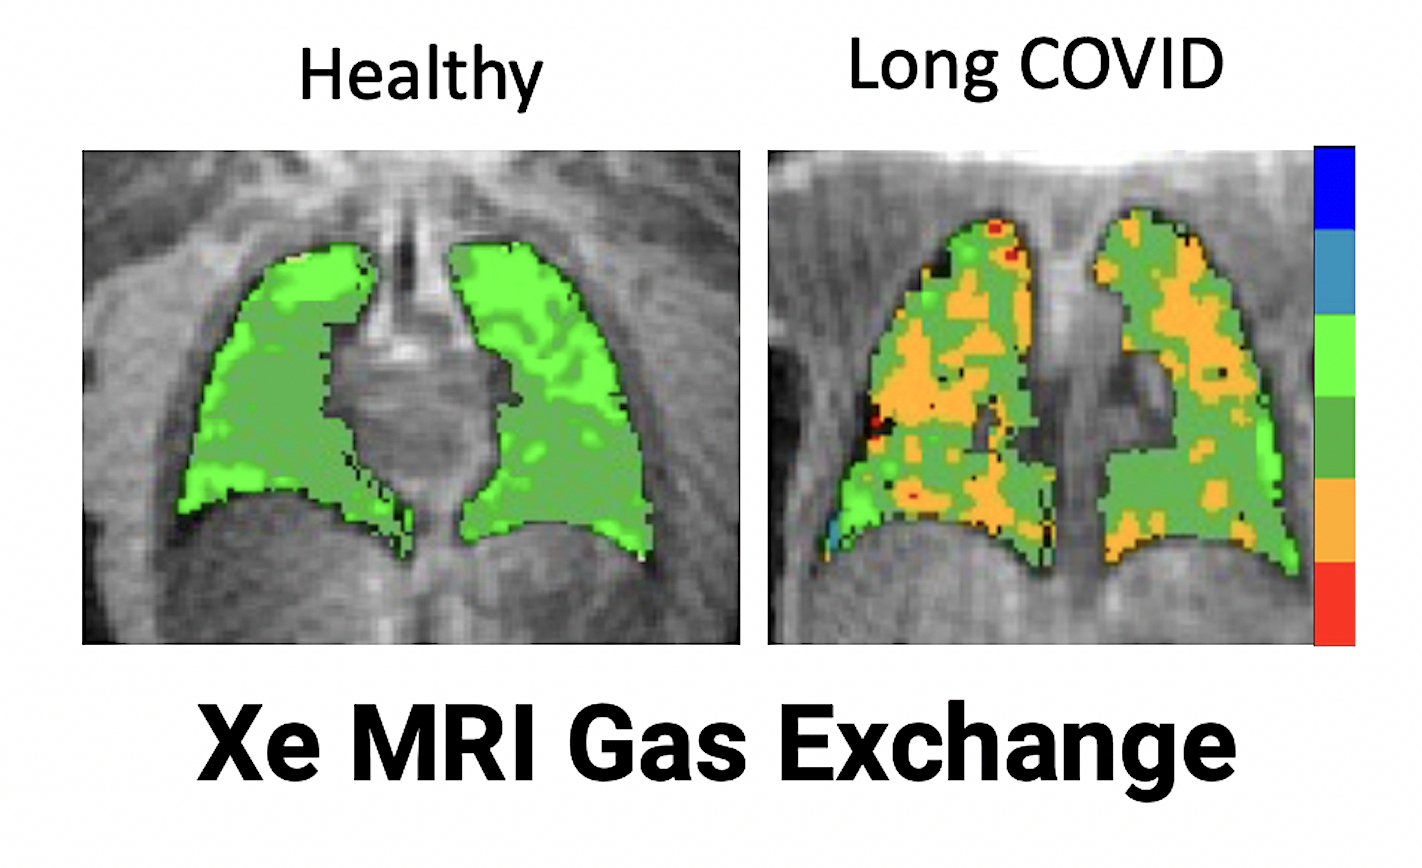
Comparison of a normal, healthy patient's lung gas exchange capacity (left) compared to three previously hospitalized COVID patients (right) who still stay they have problems breathing, despite having normal looking CT scans. Hyperpolarized xenon-129 gas MRI imaging shows shows significantly impaired gas transfer in the lungs of the recovered COVID patients. Image courtesy of RSNA. Read more.
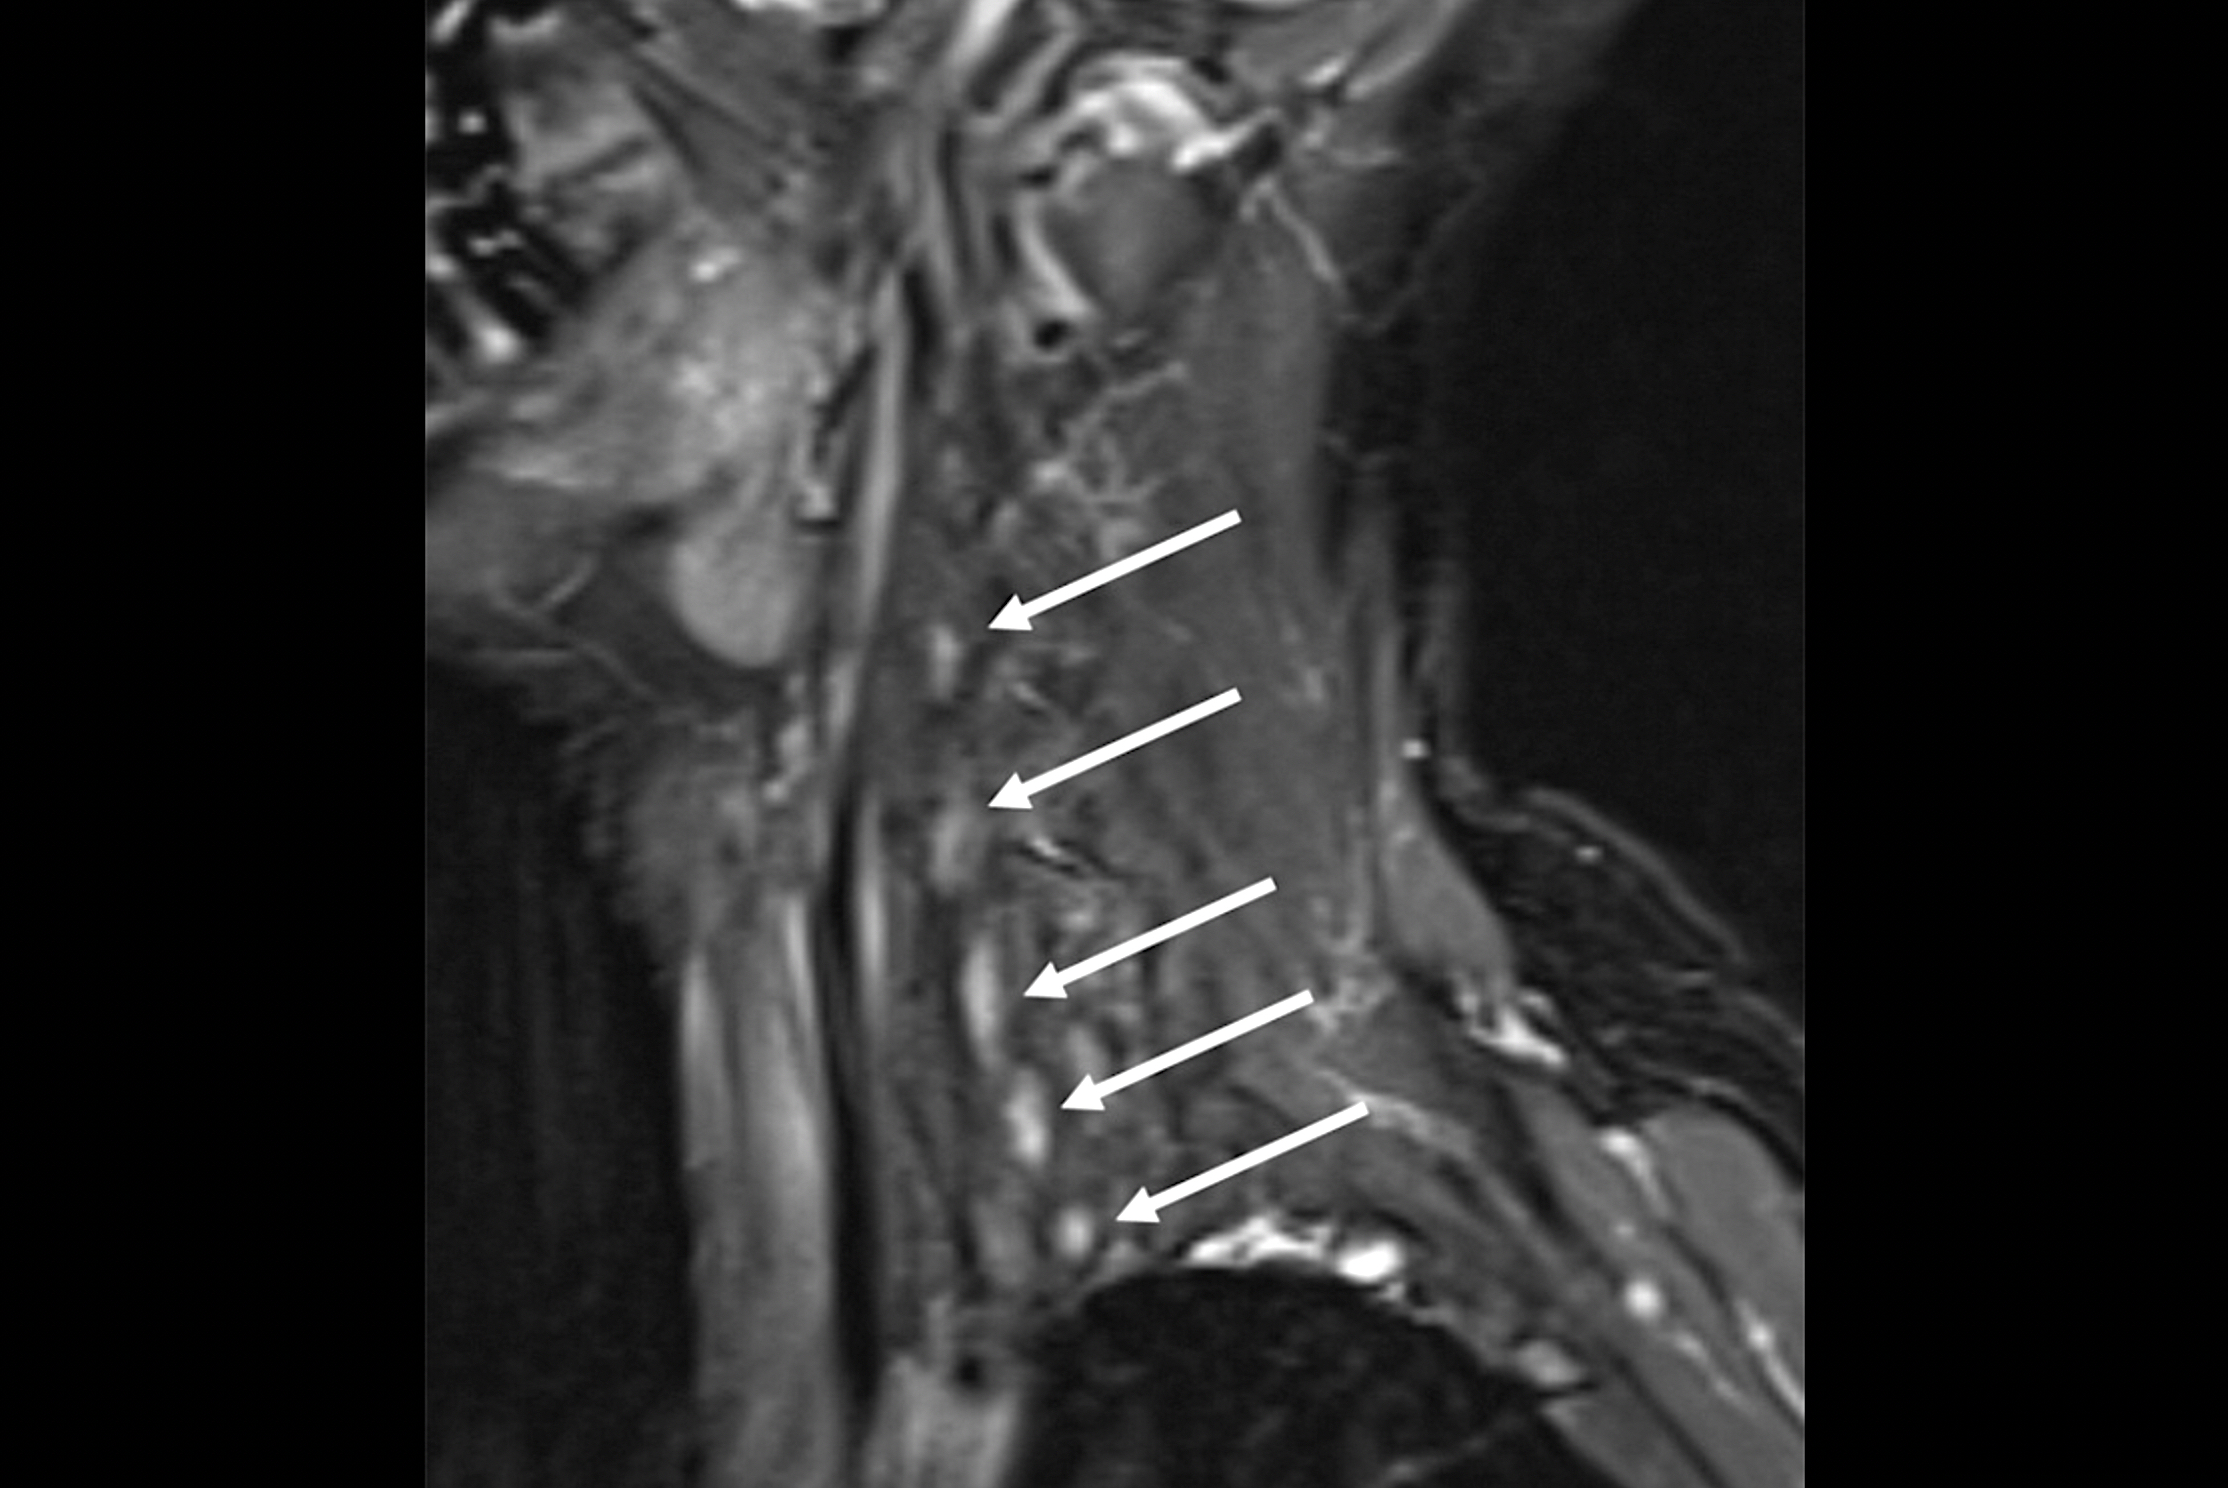
Neck MRI neurography showing nerve damage from Parsonage-Turner syndrome from suspected COVID. The 58-year-old woman had sudden-onset severe right upper extremity pain and weakness. Had two episodes of respiratory viral infection in month preceding onset of symptoms (COVID testing not performed). Clinical suspicion was for Parsonage-Turner syndrome and MR neurography of brachial plexus was performed. Sagittal T2-weighted fat-saturated image demonstrates diffuse signal hyperintensity of brachial plexus nerve roots (arrows). MR neurography findings supported clinical diagnosis of Parsonage-Turner syndrome, and patient was treated with gabapentin. Image courtesy of RSNA. Read more.
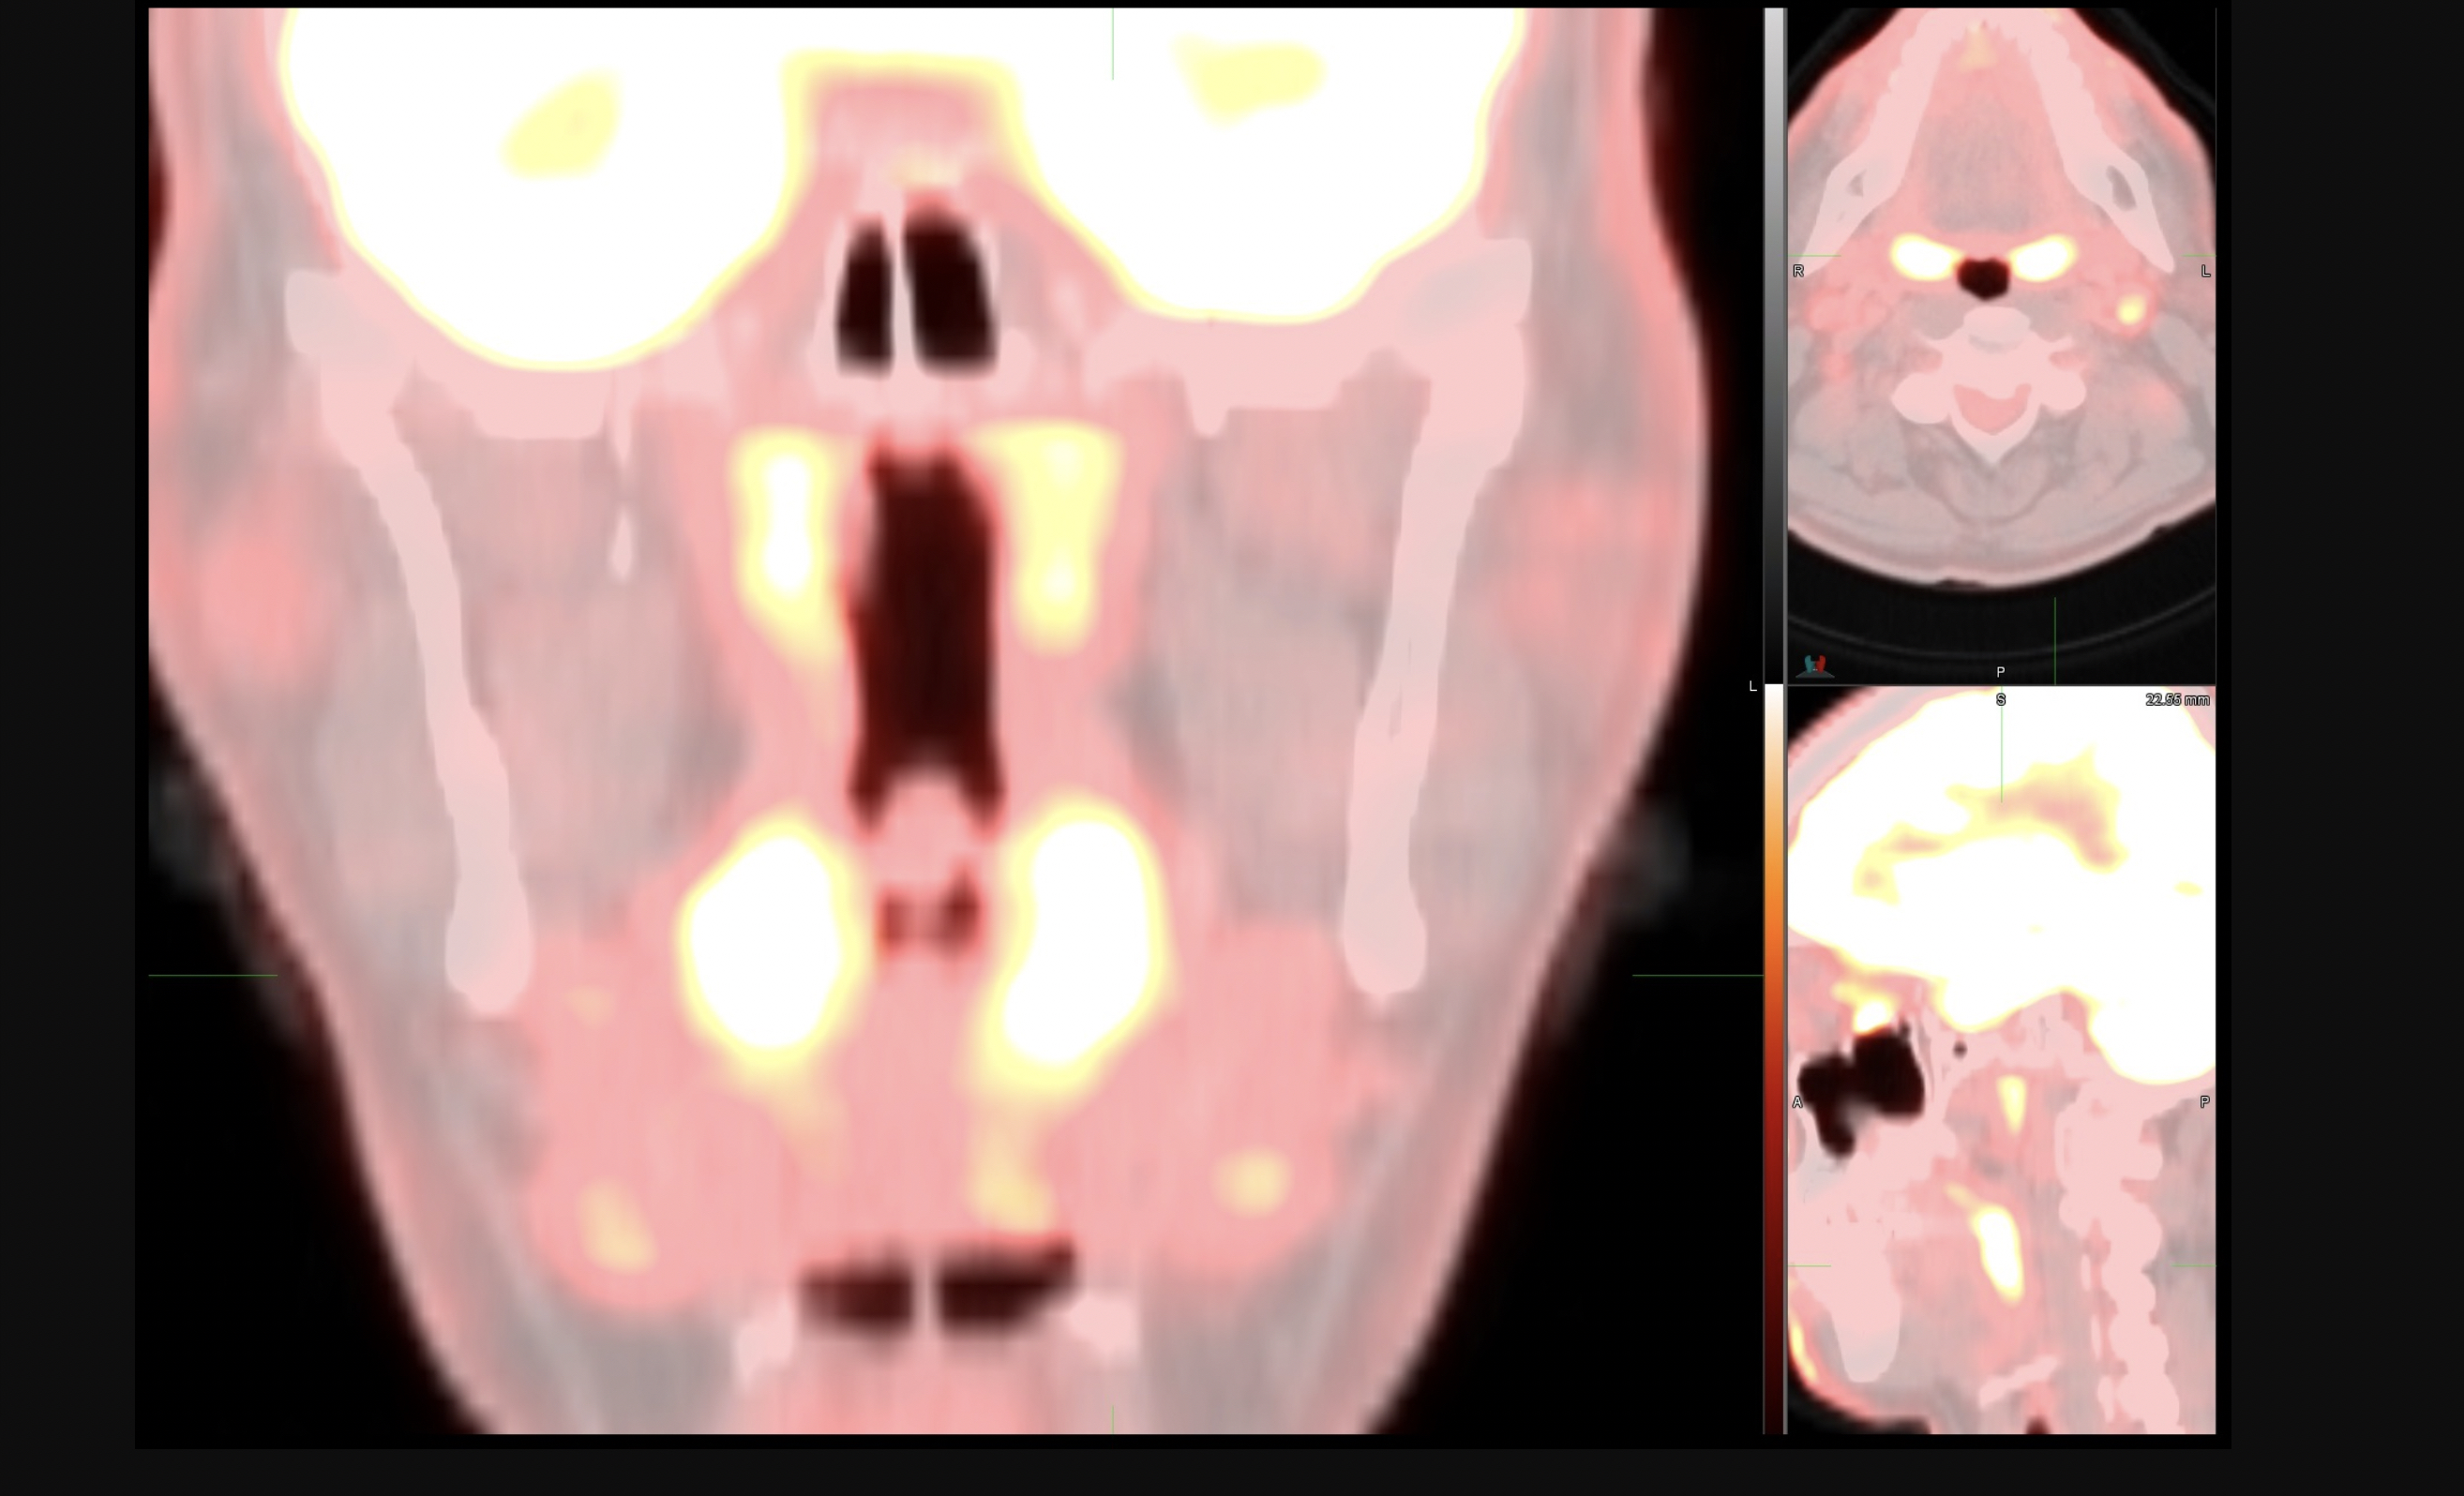
SNMMI images of unusual imaging pattern observed on FDG PET/CT or FDG PET/MR that may be due to Omicron COVID-19 infection. Unlike the FDG PET/CT pattern seen with infections from previous strains of COVID-19, with principal involvement of the lungs, this new array of findings is primarily centered in the upper aerodigestive tract and cervical lymph nodes. Specifically, there is prominent, symmetric FDG uptake throughout the nasopharynx, oropharynx and tonsils with or without associated FDG-avid cervical lymphadenopathy, particularly in the suprahyoid neck. Read more

Barotruama over 39 days: 56 year old female with RT-PCR confirmed COVID-19 and a history of ulcerative colitis intubated 1 day post admission. (A) Frontal chest radiograph on presentation demonstrates bilateral opacities (arrows) in a basilar predominant pattern, compatible with COVID-19 pneumonia. (B) Pneumomediastinum (arrowheads) and subcutaneous emphysema (arrows) developed 2 day post intubation. (C) New left and increasing right small pneumothoraces (arrows) 8 days post intubation resulting in right chest tube placement. (D) Recurrent large right pneumothorax (arrow) 34 days post intubation with bilateral chest tubes in place. The patient died 5 days later (39 days after intubation) without resolution of barotrauma. Image courtesy of Clinical Imaging. Read more.
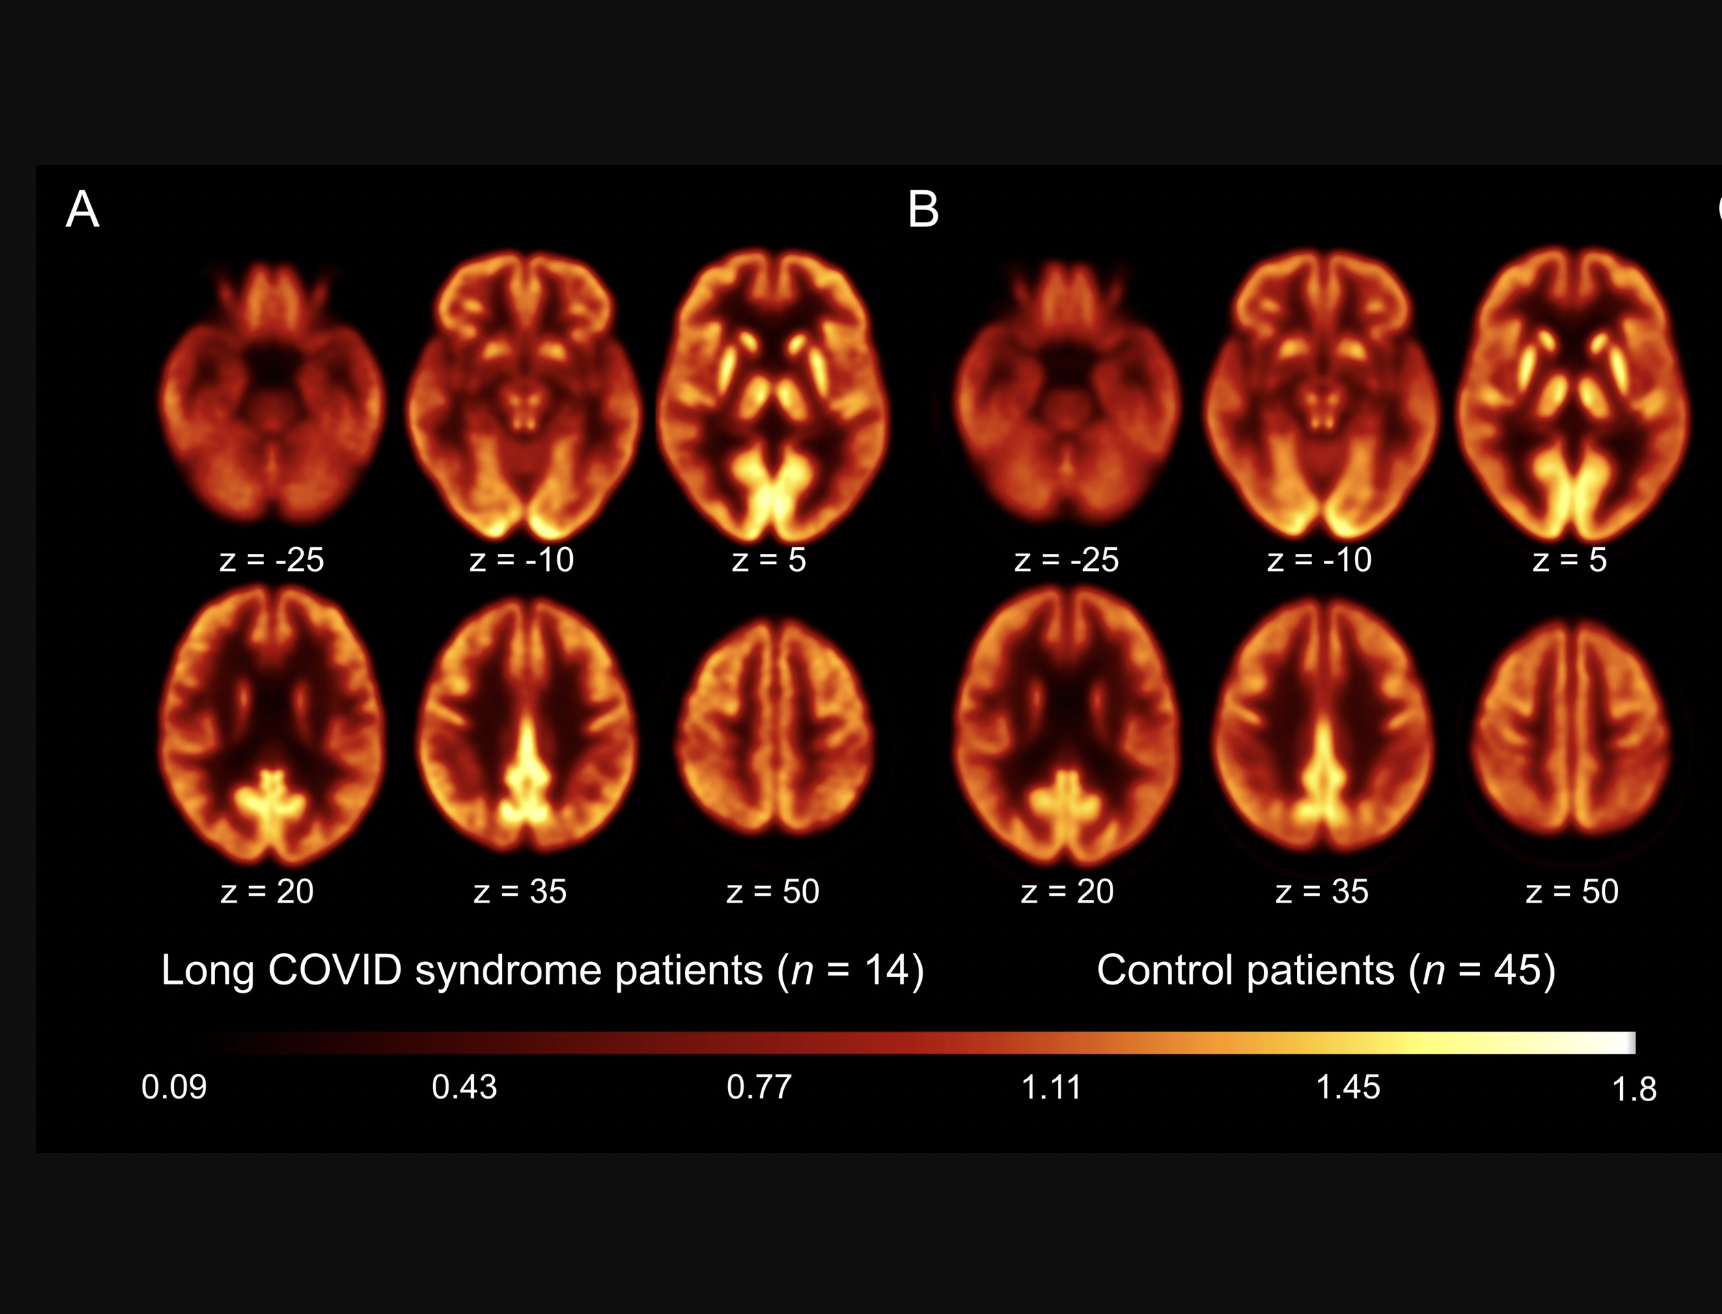
Brain 18F-FDG PET imaging of patients with long-COVID syndrome and control patients, showing no significant differences. The molecular imaging suggests long-COVID symptoms may be caused by fatigue, not regional brain dysfunction. A and B: Transaxial sections of group averaged, spatially normalized 18F-FDG PET scans in patients with long-COVID syndrome (A) and control patients (B). Image courtesy of SNMMI. Read more.

CT scan showing COVID remnants of pneumonia 12 months after infection. A study found 93% of patients’ lung abnormalities had cleared up on follow-up chest CT scans one year after infection. Image courtesy of RSNA.
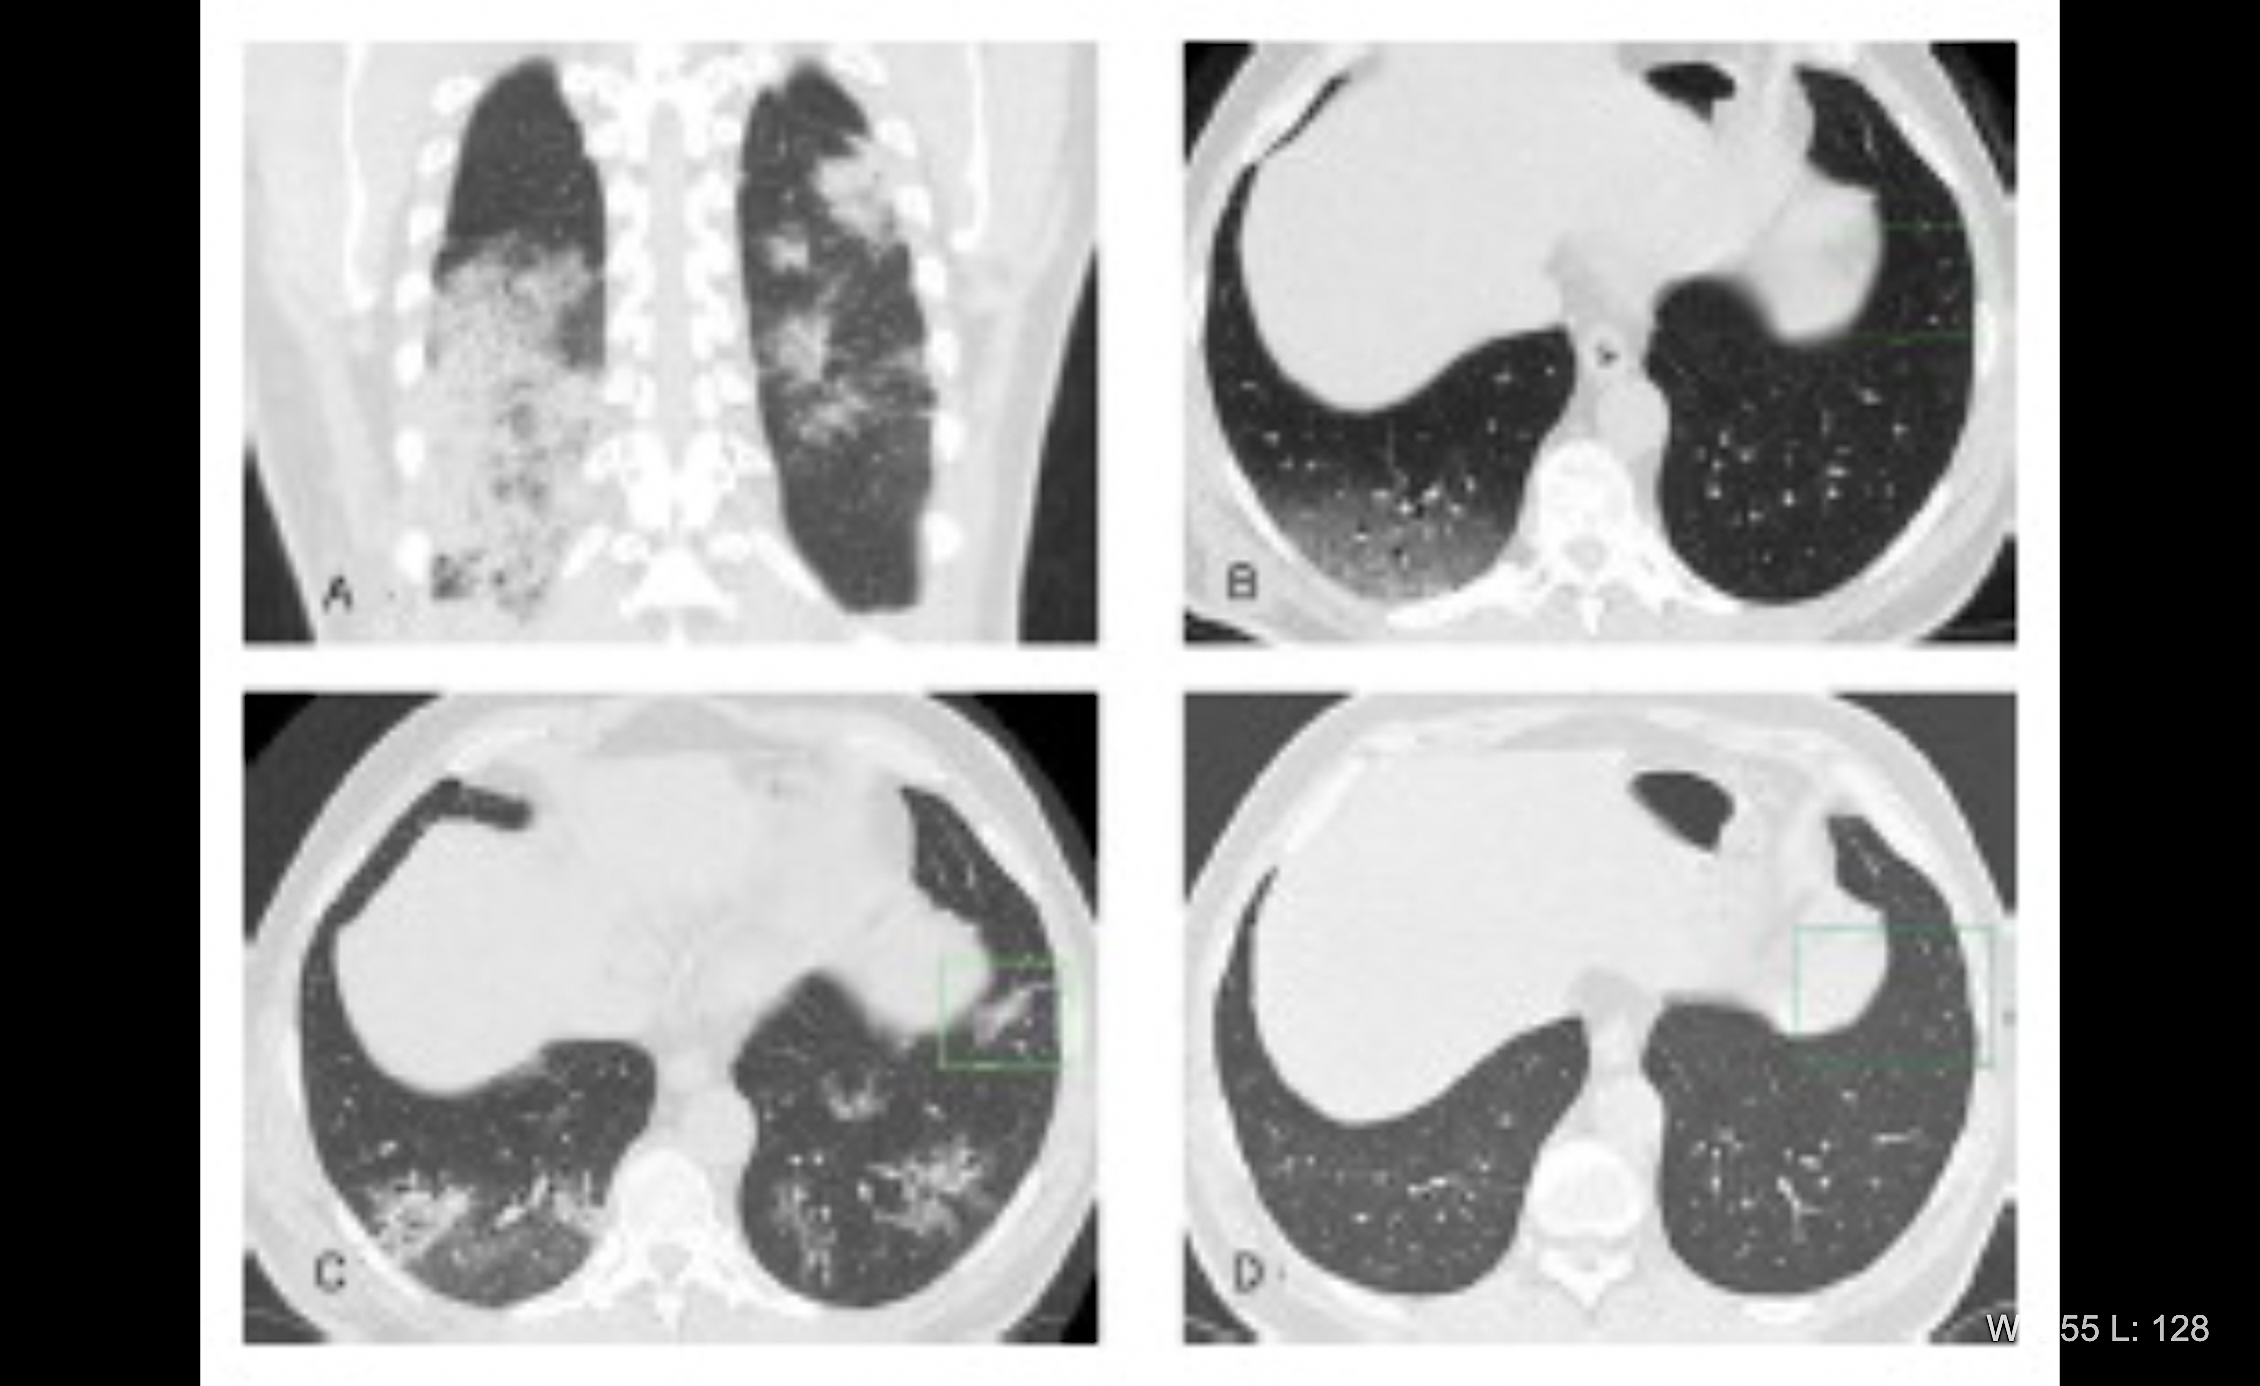
CT scans in a 60-year-old man diagnosed with COVID-19 pneumonia show typical CT findings over time for participants with complete resolution. (A) Eleven days after symptom onset, CT scan shows bilateral, predominantly subpleural, ground-glass opacity (GGO) with foci of consolidation and “crazy paving” appearance (*). (B) Twenty-four days after symptom onset, enlarged areas of bilateral subpleural consolidation (*) and “crazy paving” appearance (arrows) are shown. (C) Thirty-six days after symptom onset, CT scan at discharge shows apparent absorption of consolidation, leaving residual and extensive GGOs (*) with blurry linear opacities (arrows) parallel to pleura. (D) Three months after symptom onset, CT scan shows continued resolution with residual GGOs (*) bilaterally. (E) Seven months after symptom onset, CT scan shows complete resolution of abnormalities. (F) 12 months after symptom onset, CT scan shows no other delayed sequelae. All images have same window level. Image courtesy of RSNA. Read more.
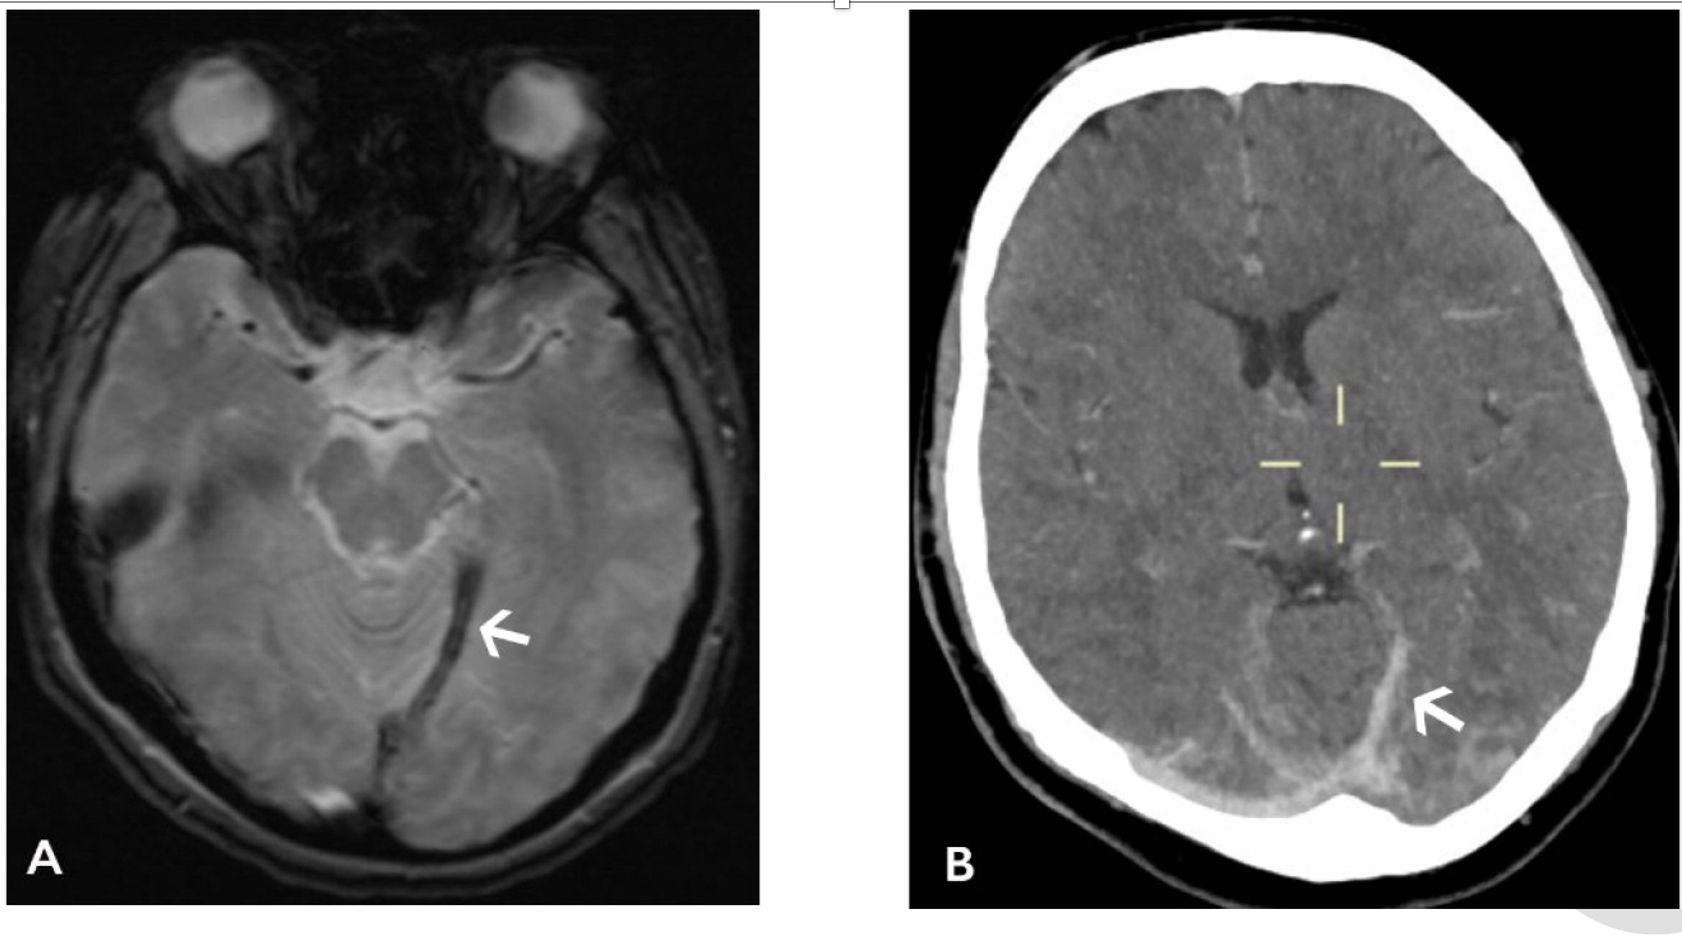
A 28-year-old woman who presented with headache and subsequent collapse. Cerebral venous sinus thrombosis was diagnosed and whole-body imaging demonstrated large volume splanchnic vein thrombosis. (A) Susceptibility weighted axial brain MRI showing a thrombosed internal cerebral vein branch leading to the straight sinus (arrow). (B) Unenhanced axial head CT showing hyperattenuating clot within the cortical vein and transverse sinuses (arrow). Images courtesy of RSNA. Read more
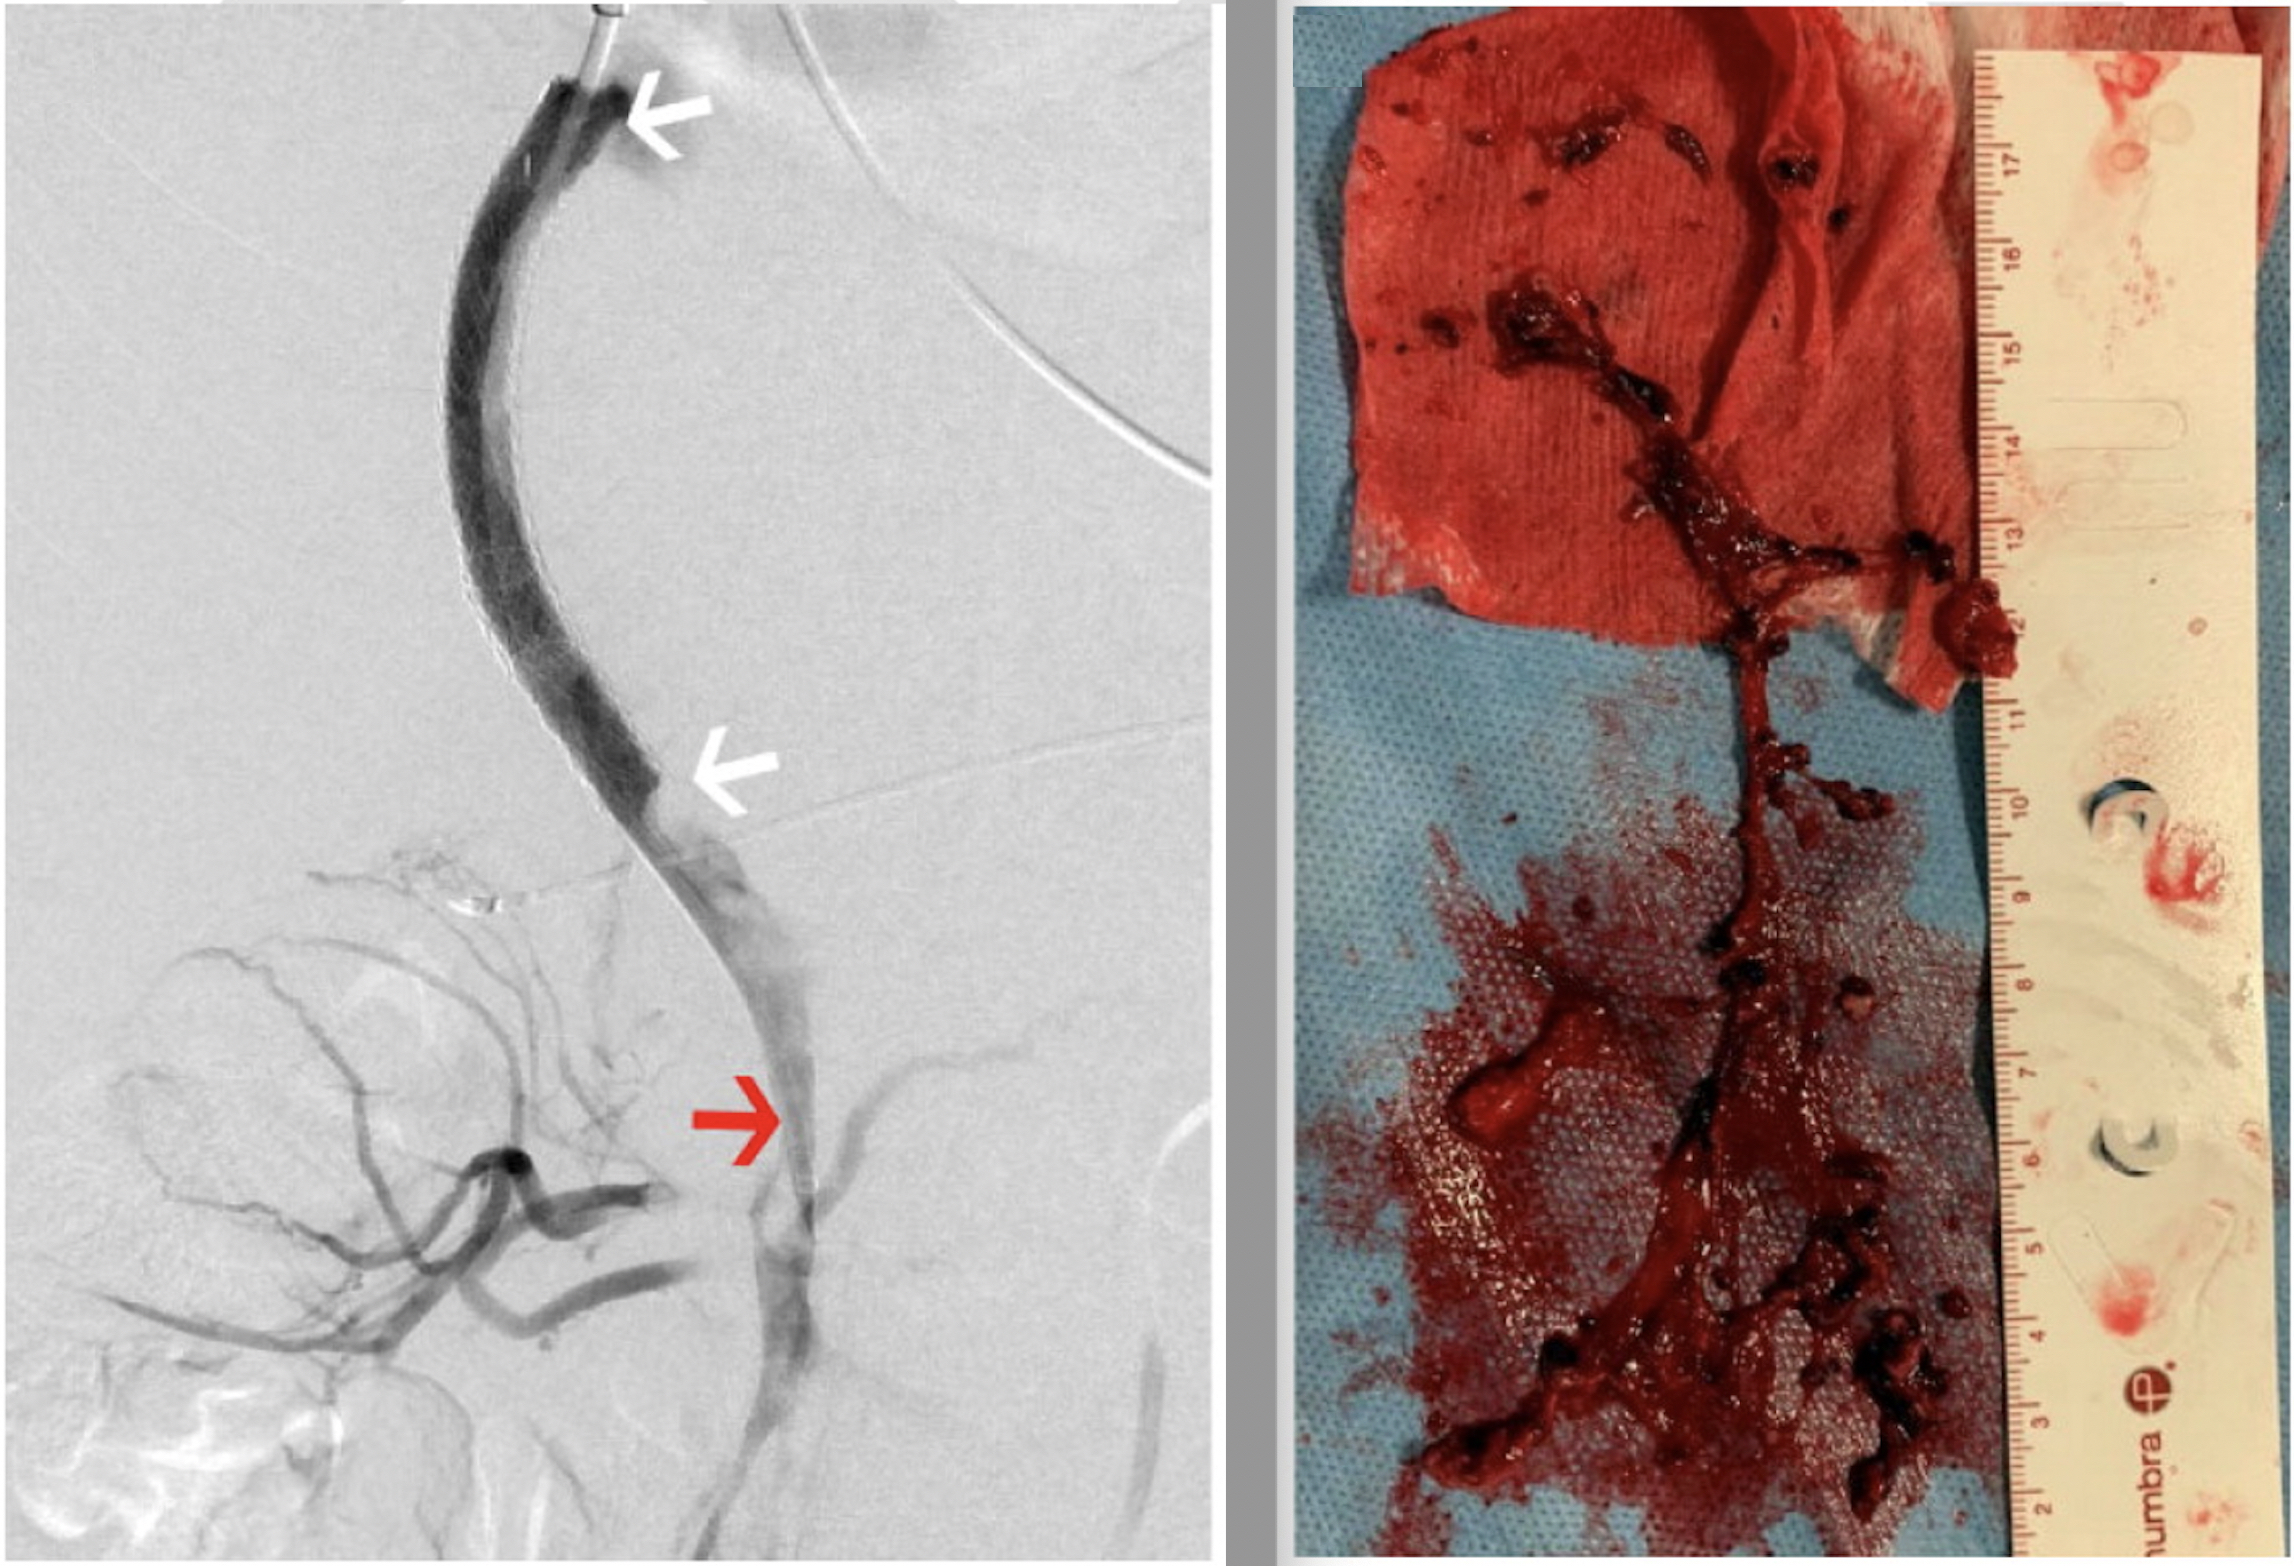
Left, fluoroscopic angiogram images taken of a 20-year-old woman who had immune response to COVID vaccine, causing systemic clotting. mage shows from a thromboaspiration catheter (red arrow) within the partially occluded superior mesenteric vein through a transjugular intrahepatic portosystemic shunt (between the white arrow). Contrast can be seen filling some segmental superior mesenteric vein branches with several filling defects in the confluence of the portal vein. Right, photograph of the thrombus cast of the superior mesenteric vein and portal vein aspirated from the splanchnic system via the portosystemic shunt using an aspiration thrombectomy catheter. Images courtesy of RSNA. Read more

While less common, the coronavirus can affect your skin. For some people, this may be the only sign of a coronavirus infection. Patients who test positive for the coronavirus can develop discolored and swollen toes that turn red or purple. Image courtesy of the American Academy of Dermatology. Read more
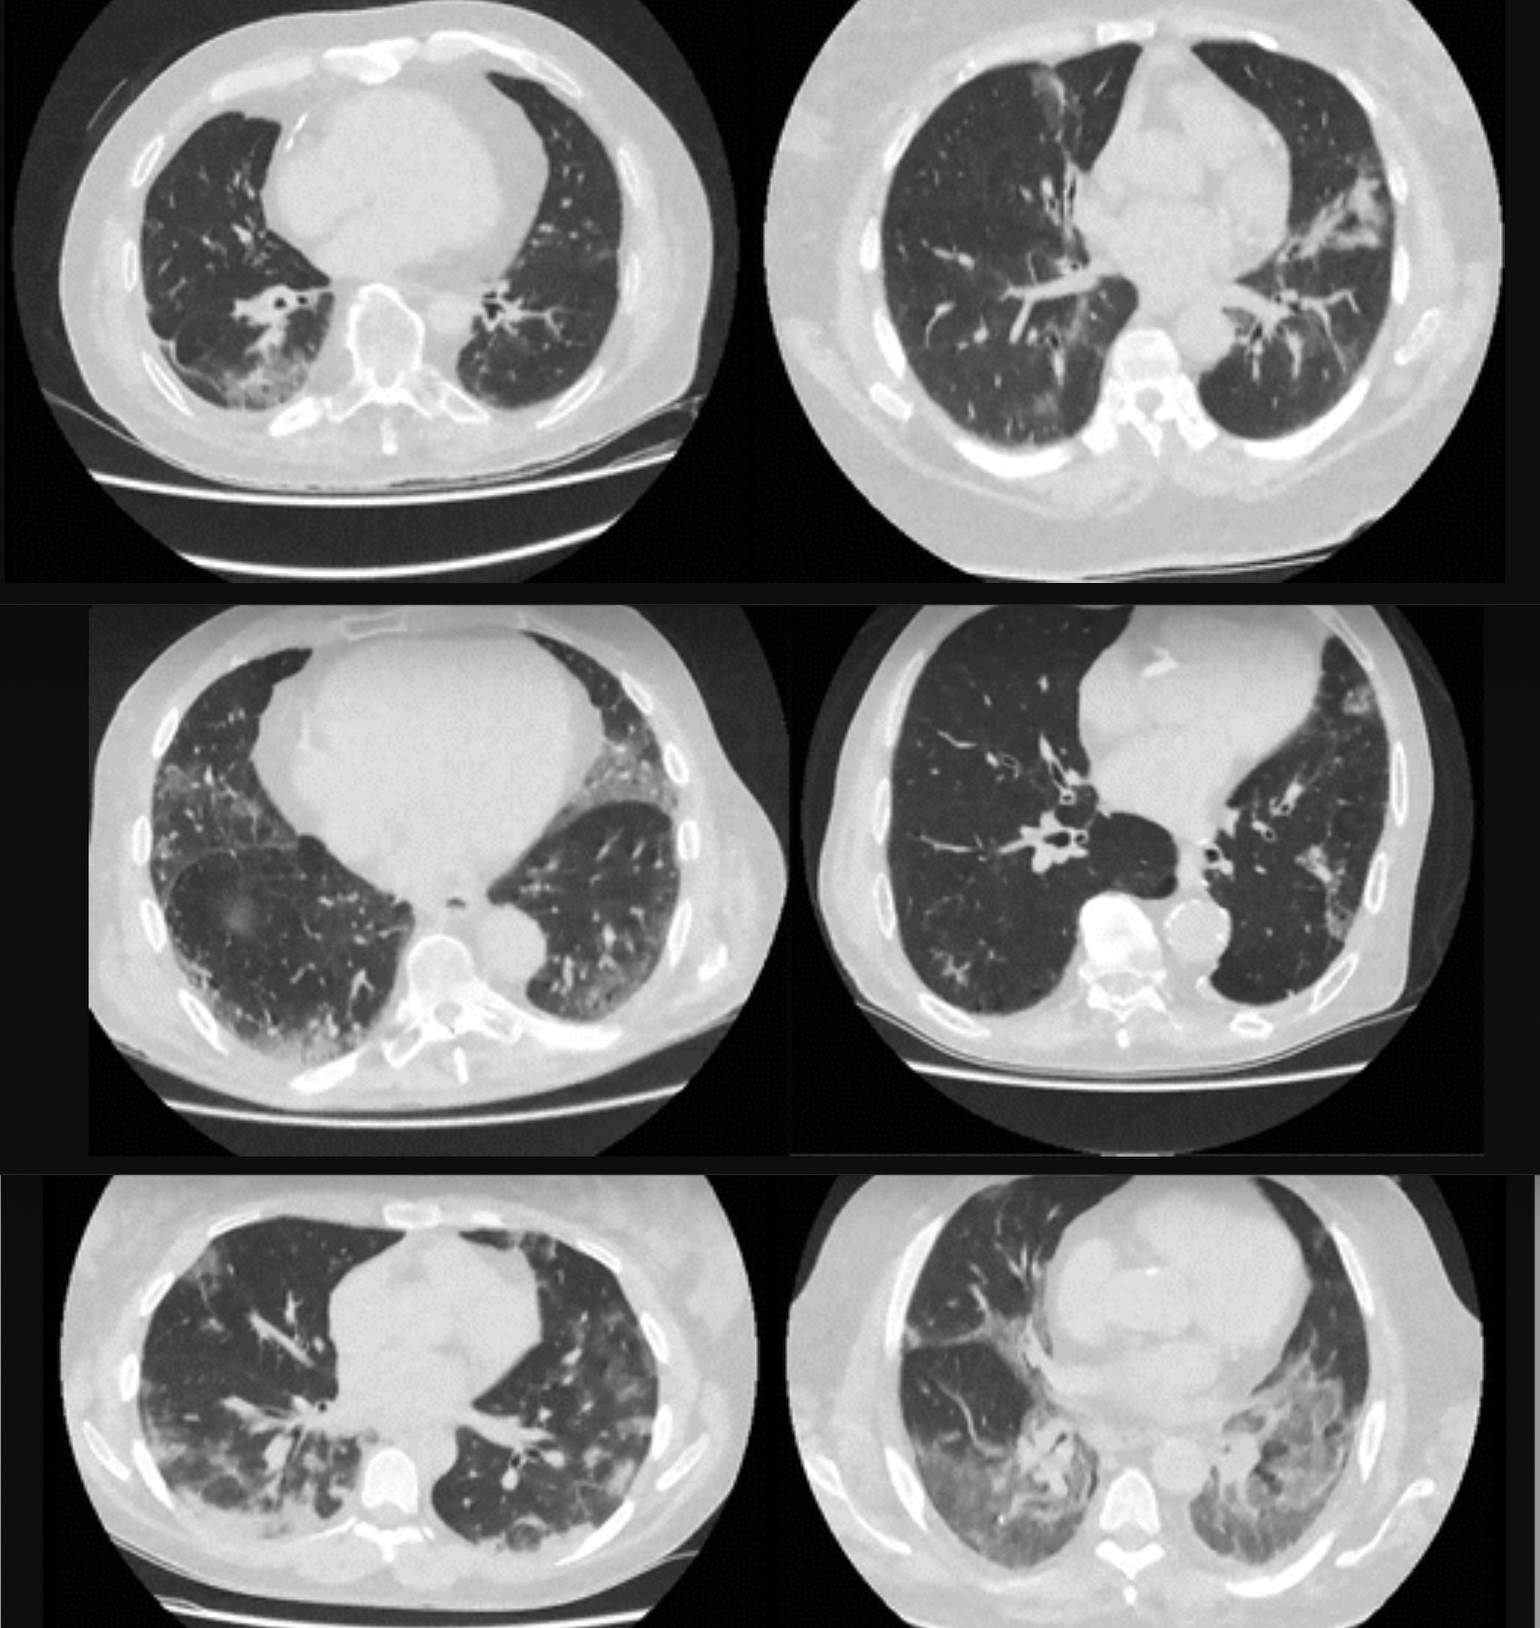
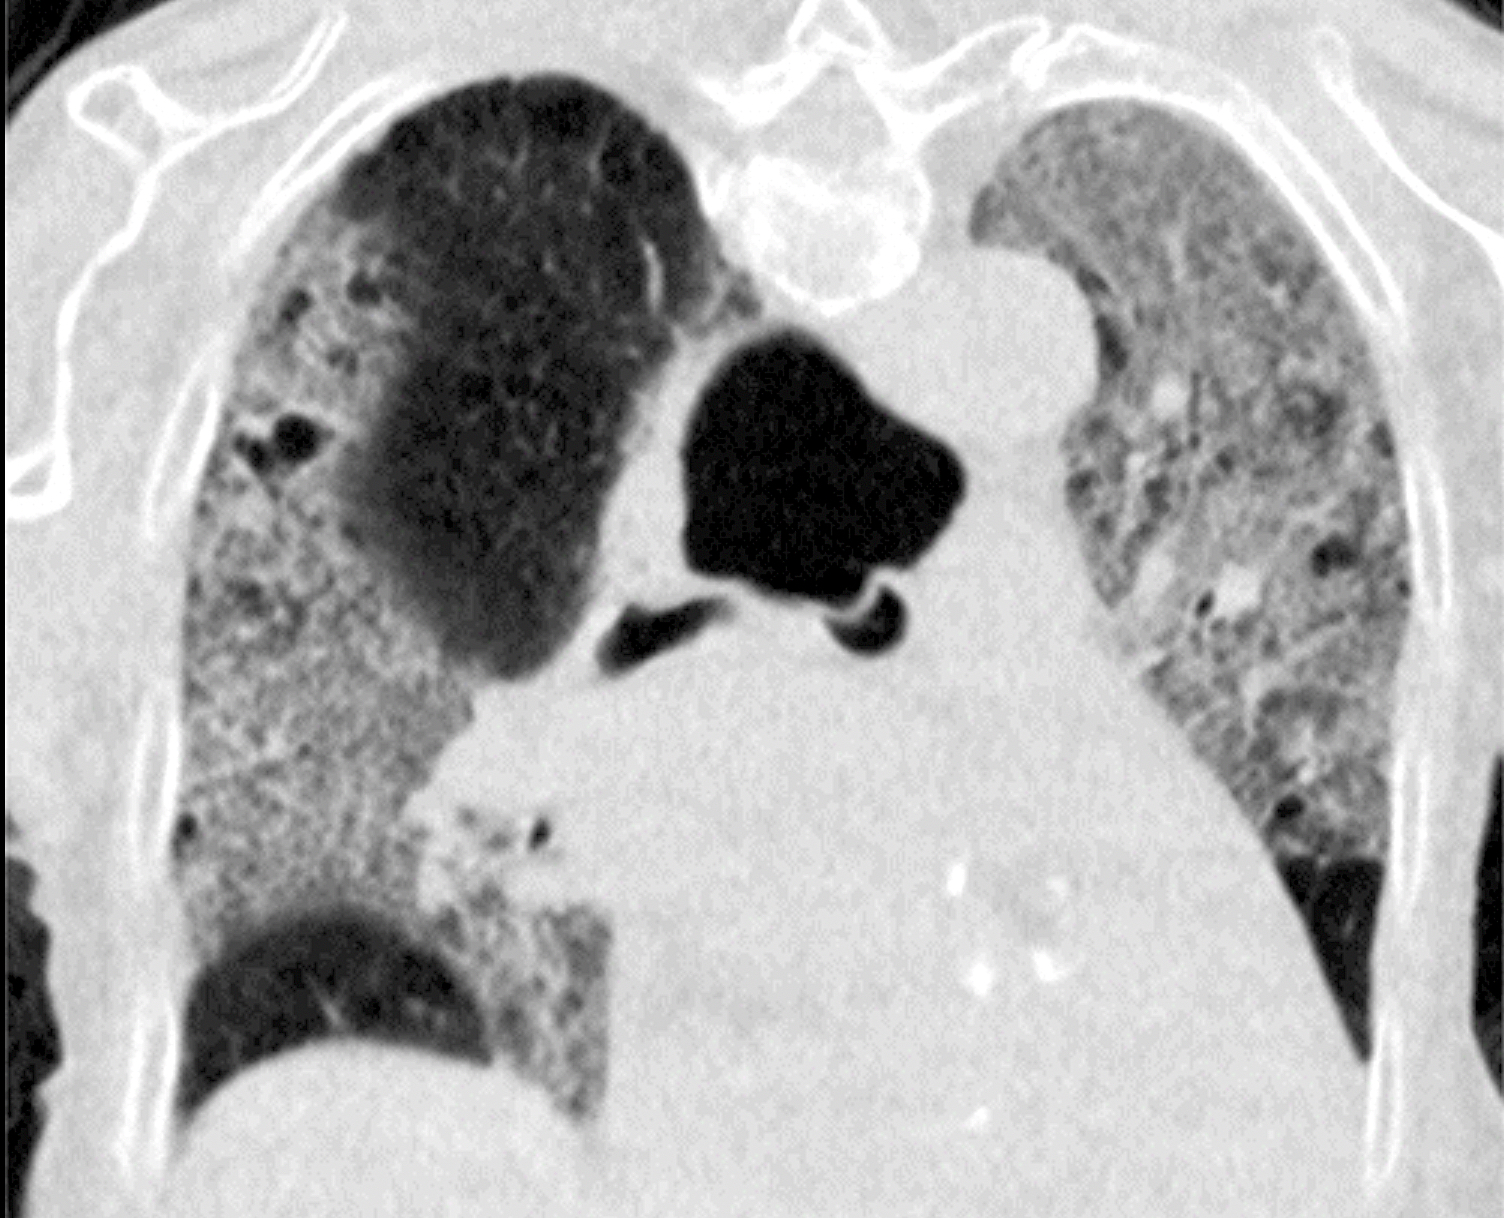
In the spring of 2020 as the pandemic spread around the world, radiology developed the COVID-19 Reporting and Data System (CO-RADS) to standardize assessment of pulmonary involvement of COVID-19 on unenhanced chest CT images. The scoring system also was designed to standardize reports and help increase interobserver agreement. This image shows the the more severe categories. Top, CO-RADS 3, middle CO-RADS 4 and bottom CO-RADS 5. The COVID pneumonia appears as foggy lighter areas within the lungs, which should normally be black. Images courtesy of RSNA. Read more.
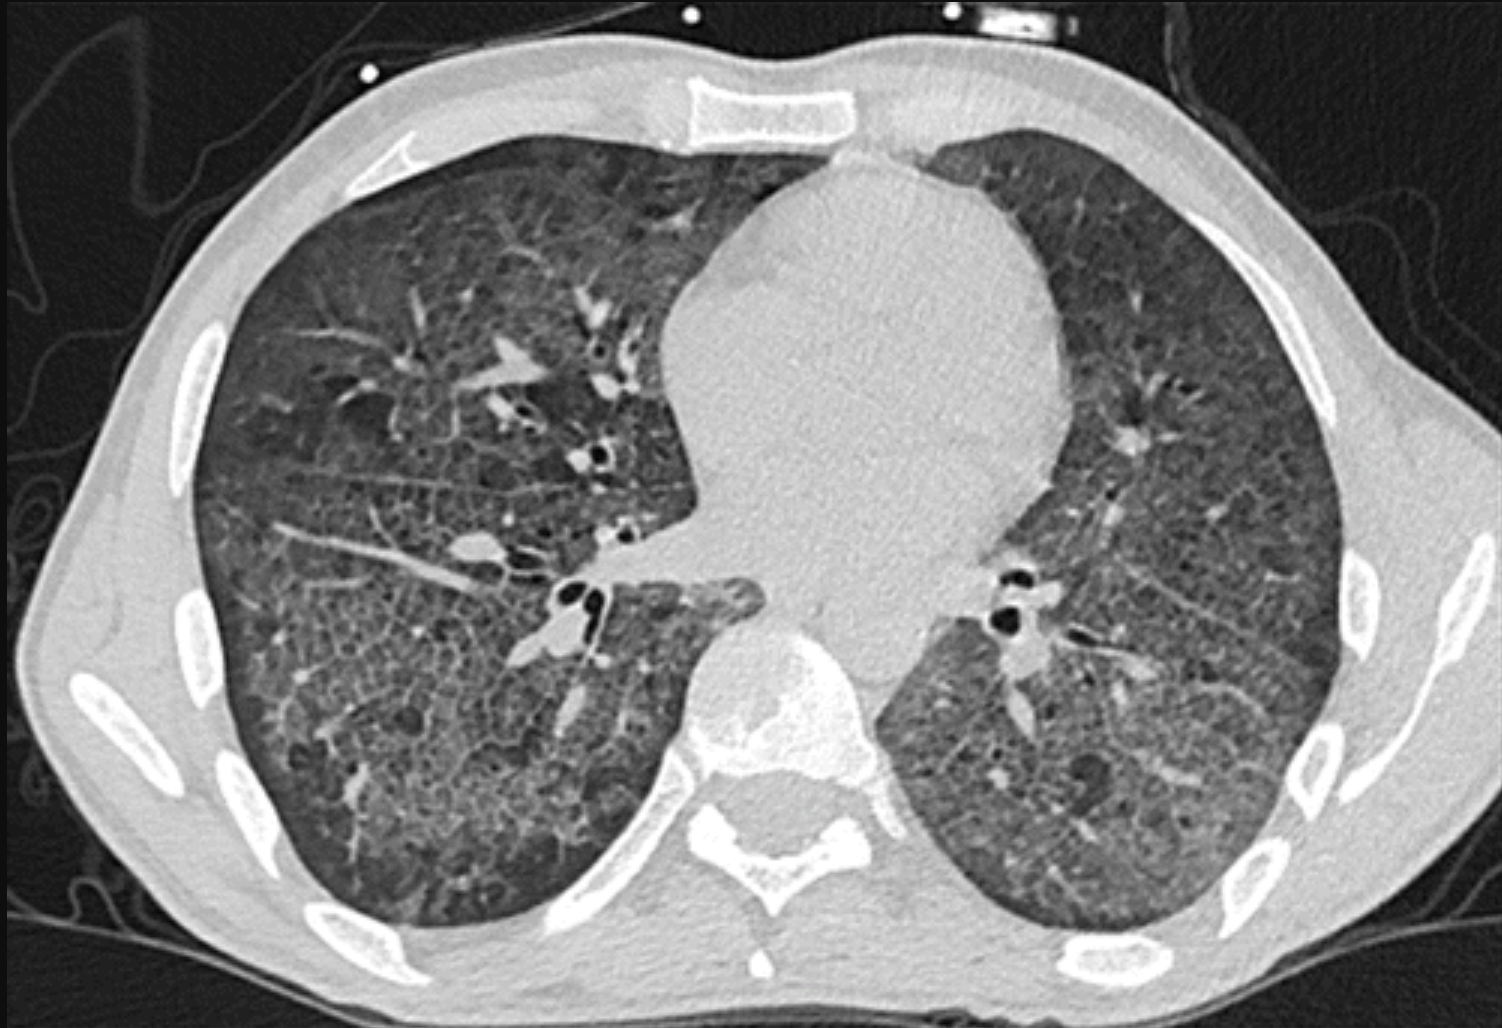
79-year-old woman with 9 days of symptoms. Scans show diffuse ground-glass opacities close to visceral pleural surfaces but superimposed on emphysematous changes. Coronavirus disease 2019 (COVID-19) Reporting and Data System (CO-RADS) score of 4. Image courtesy of RSNA. Read more.
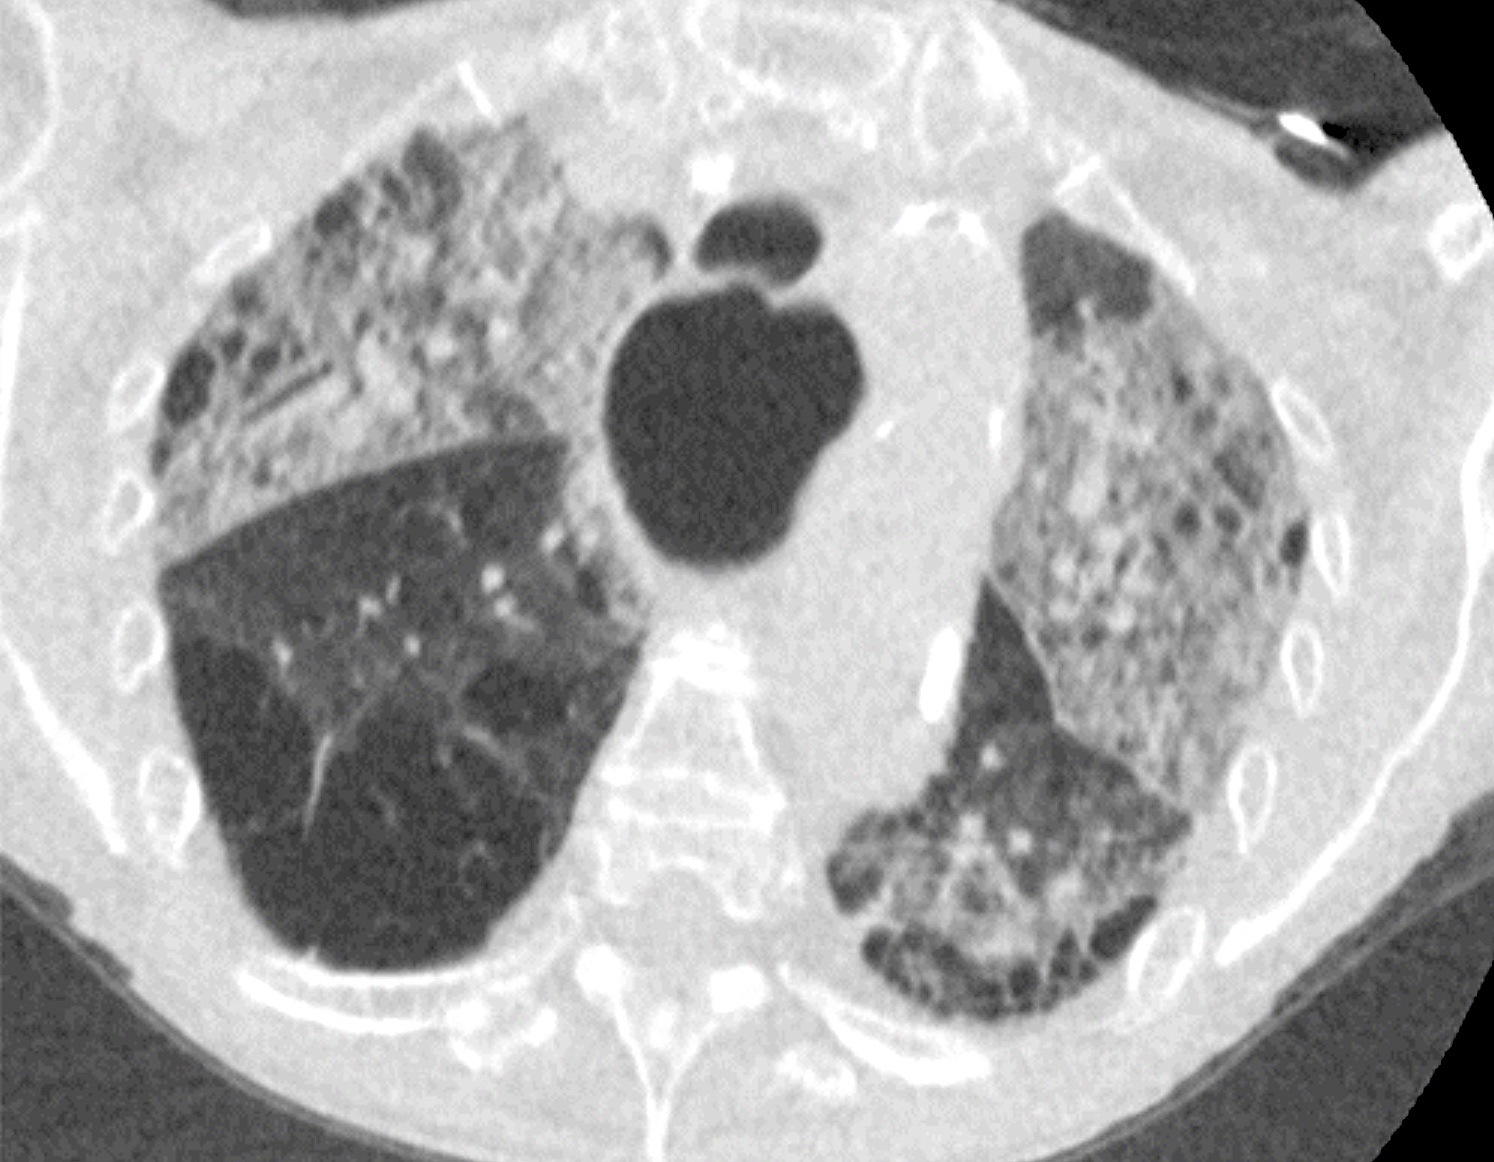
Example chest CT from a 69-year-old man with 7 days of symptoms. CO-RADS score of 5. Scan shows COVID pneumonia bilateral multifocal areas of ground-glass opacity (GGO) and consolidation in the vicinity of the visceral pleural surface. In addition, few thickened vessels in areas of ground glass are observed. Image courtesy of RSNA. Read more.
79-year-old woman with 9 days of symptoms. Scans show diffuse ground-glass opacities close to visceral pleural surfaces but superimposed on emphysematous changes. Coronavirus disease 2019 (COVID-19) Reporting and Data System (CO-RADS) score of 4. Image courtesy of RSNA. Read more.
Lung CT of a 42-year-old man with more than 7 days of symptoms. Scans show COVID pneumonia with diffuse ground-glass opacities in close vicinity of visceral pleural surfaces. In addition, a crazy paving pattern is observed. Image courtesy of RSNA. Read more.
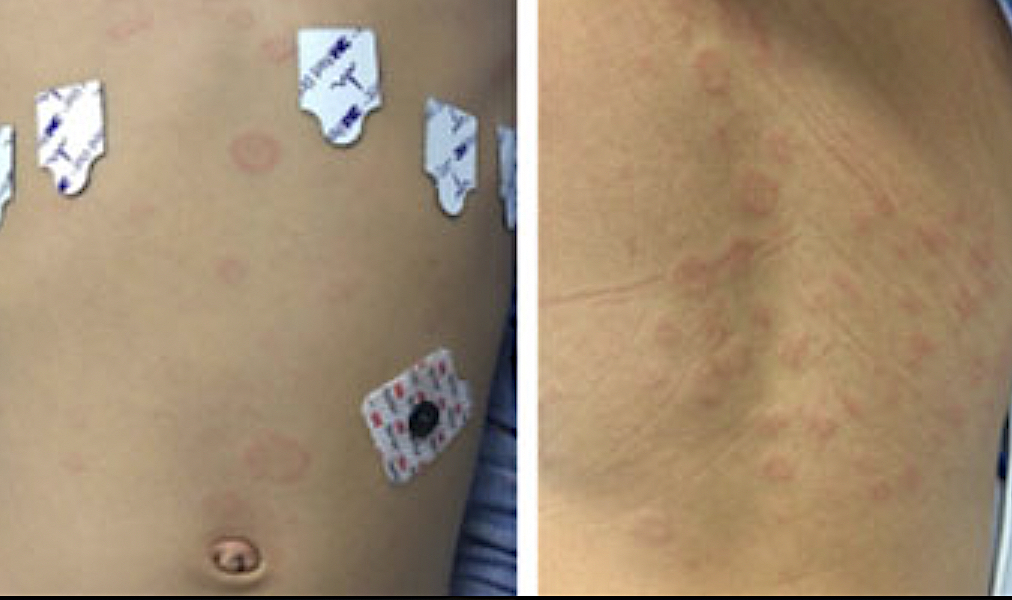
Rash caused by hyperinflammation caused by the post-infectious complication of COVID infection, multi-system inflammatory syndrome in children (MIS-C). Annular plaques on the torso (L) and back (R) of a patient with MIS-C. The syndrome effects a very small percentage of pediatric patients infected with COVID, including those who had completely asymptomatic infections. MIS-C results in an array of symptoms, including fever, gastrointestinal distress, rash and sometimes cardiac involvement. Image from Children’s Hospital of Philadelphia. Read more.
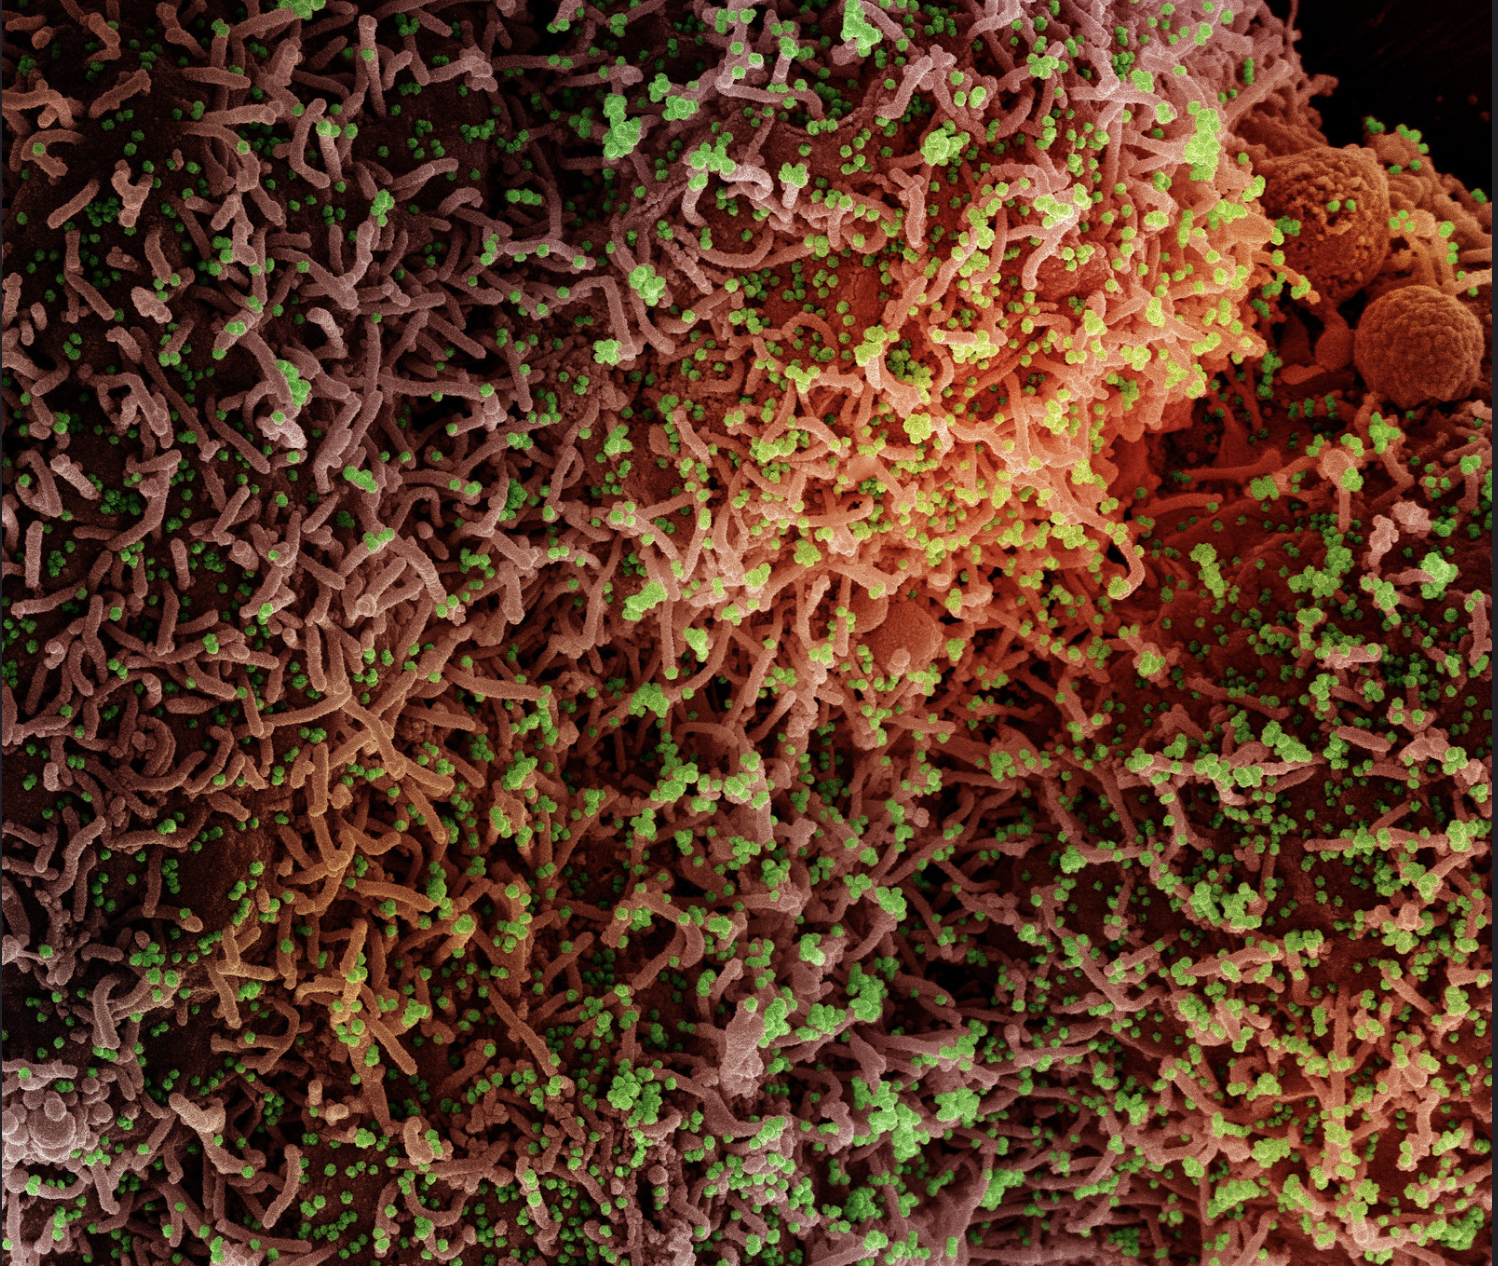
Colorized scanning electron micrograph of a cell infected with a variant strain of SARS-CoV-2 virus particles (green), isolated from a patient sample. Image captured at the NIAID Integrated Research Facility (IRF) in Fort Detrick, Maryland. Credit: NIAID
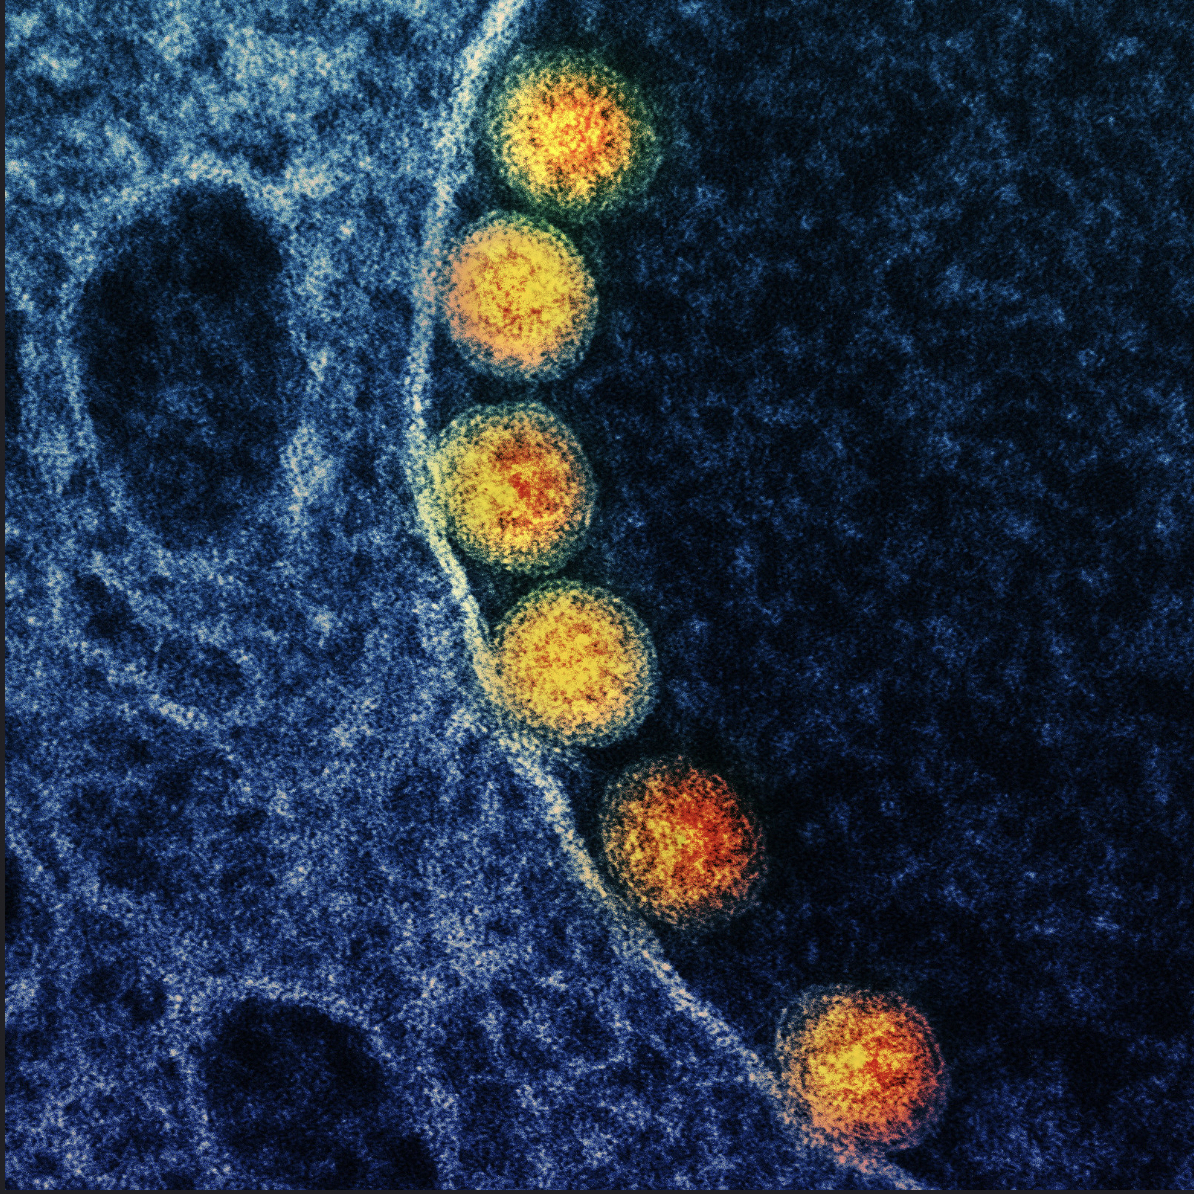
COVID increases cardiovascular events, especially in patients who are not blood type O. Image shows SARS-CoV-2 virus (gold) within endosomes of a heavily infected nasal olfactory epithelial cell. Image courtesy of NIAID.
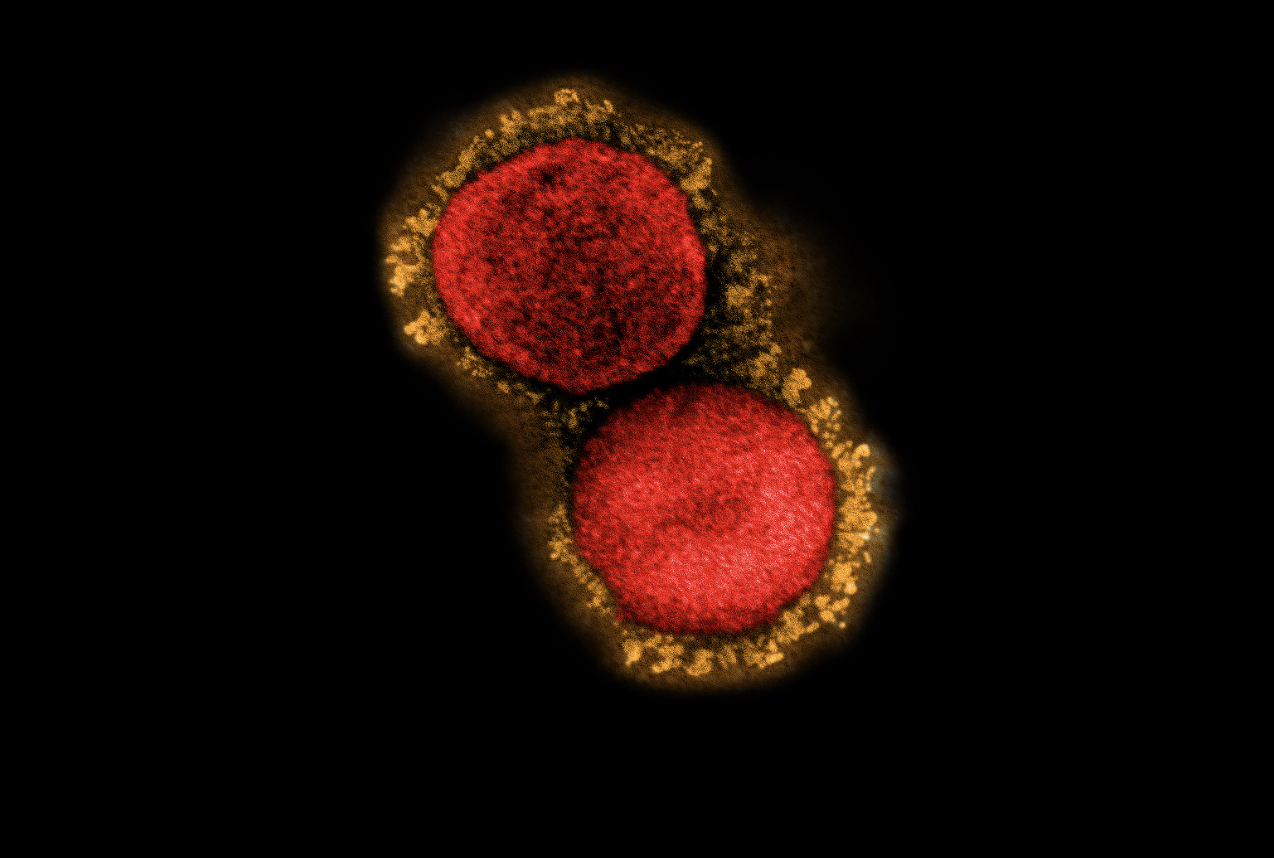
Electron microscope view of the COVID U.K. B.1.1.7 variant strain, showing the protein spikes in yellow that are used to attach to cells in a host's body. Image courtesy of NIAID
Electron microscope view of the COVID U.K. B.1.1.7 variant strain, showing the protein spikes in red that are used to attach to cells in a host's body. The electron microscope image colors can be changed to enhance the image or features like the spikes. for views can Image courtesy of NIAID
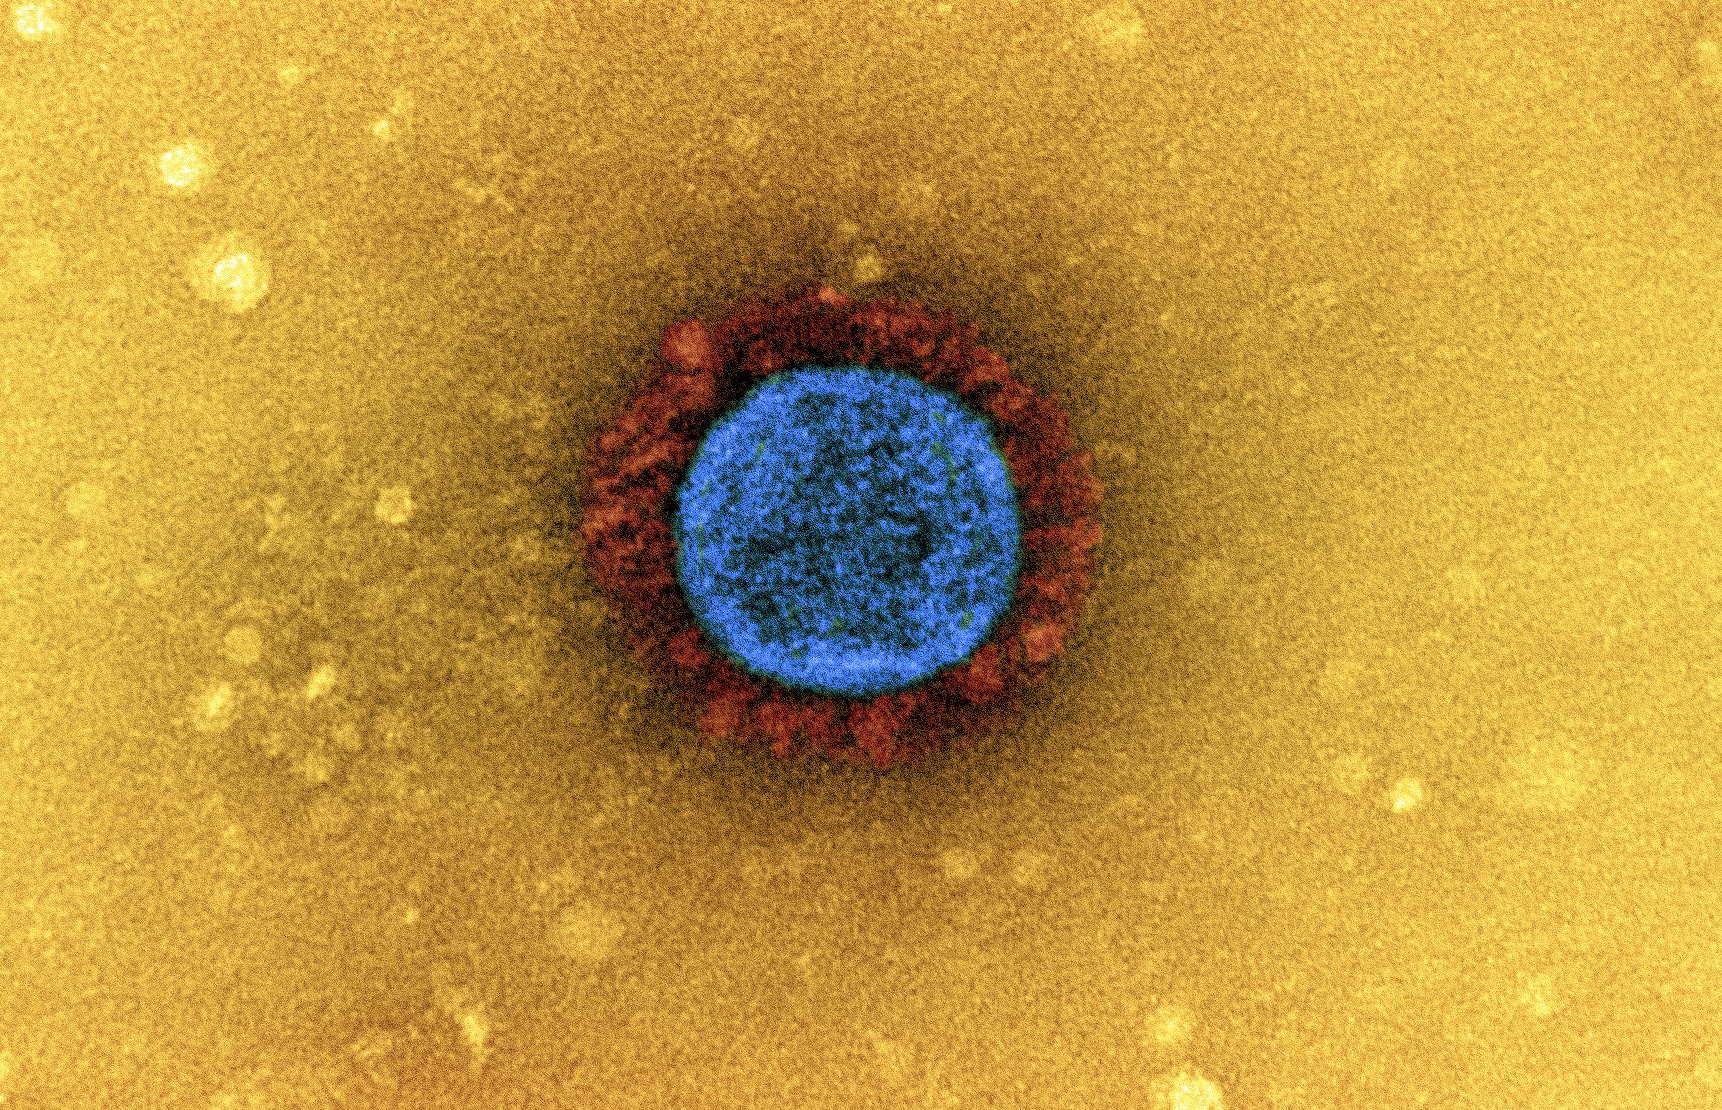
Electron microscope view of the COVID UK B.1.1.7 variant. Image courtesy of NIAID
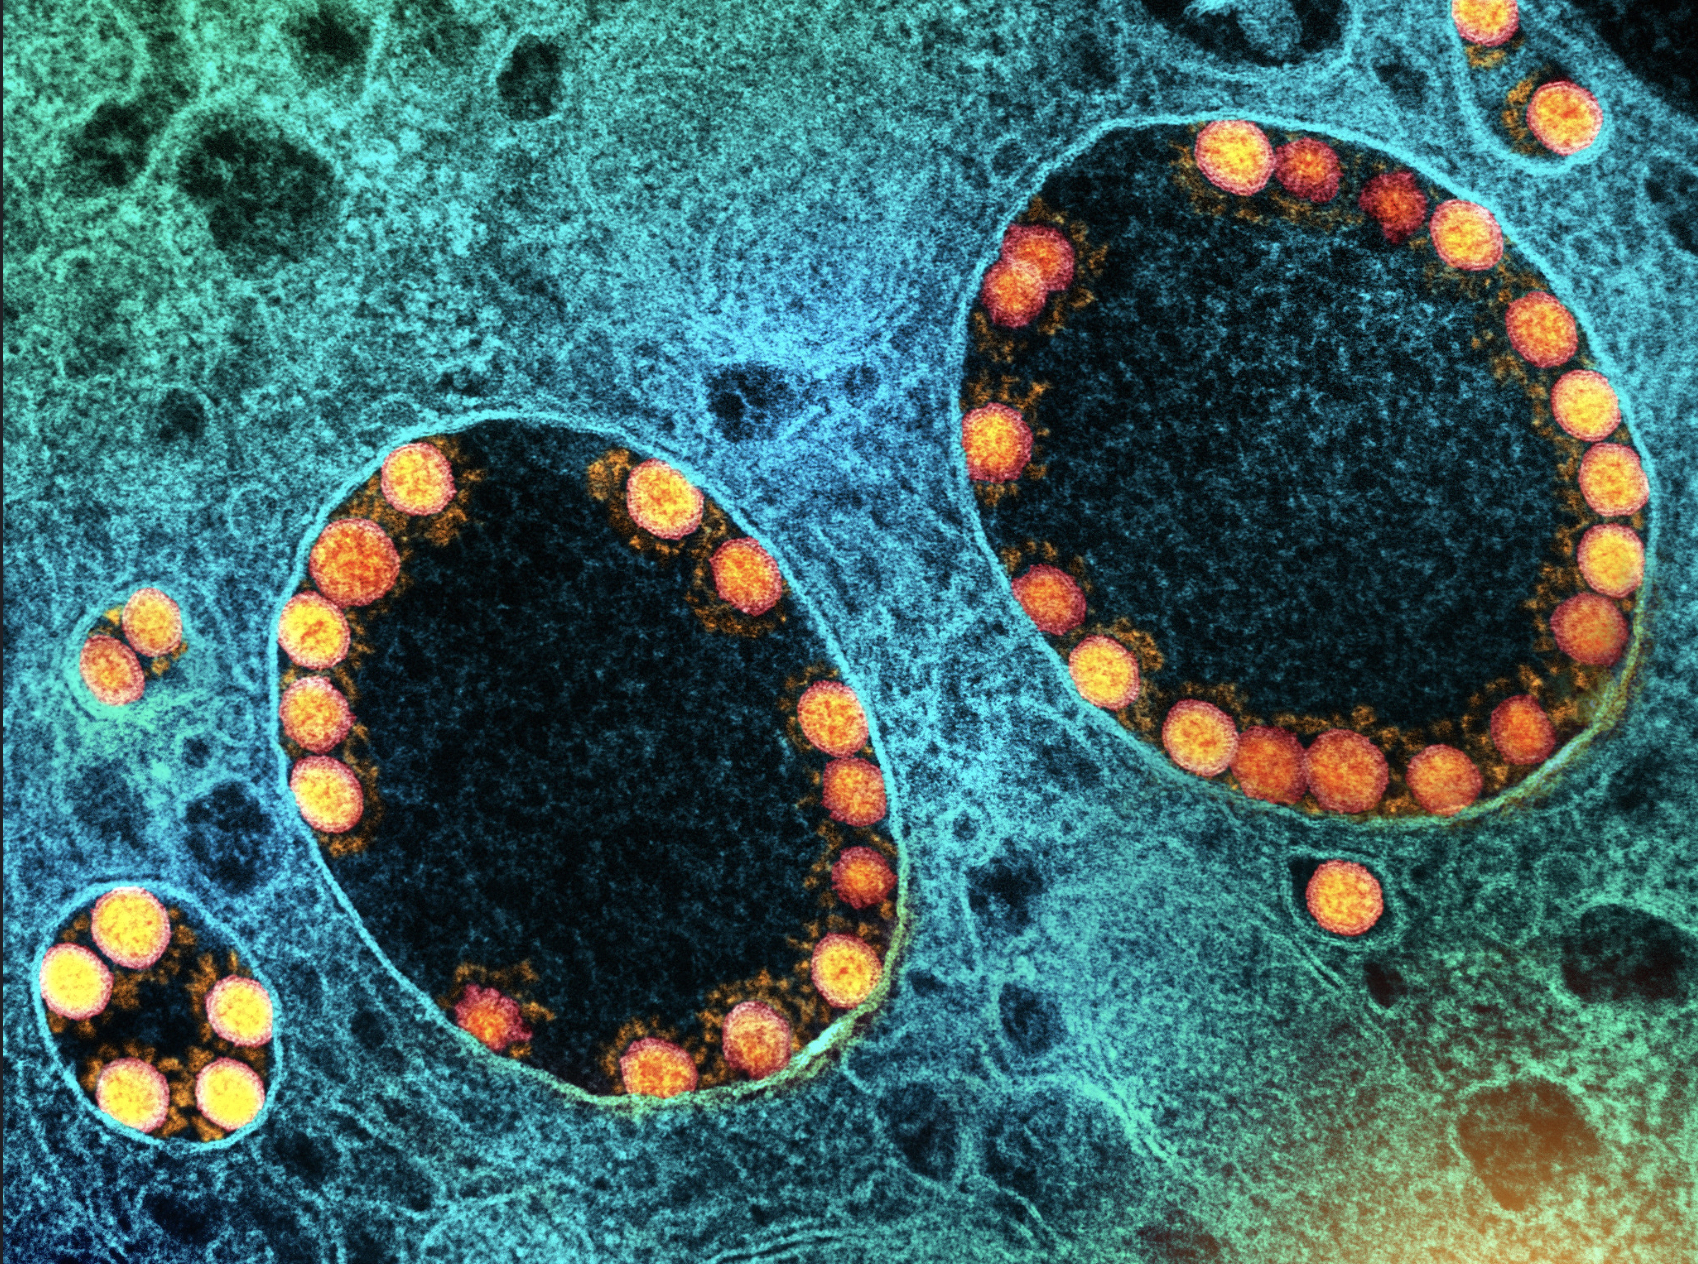
COVID sample taken from a patient's nasal passage. Transmission electron micrograph of SARS-CoV-2 virus particles (gold) within endosomes of a heavily infected nasal olfactory epithelial cell. Image captured at the NIAID Integrated Research Facility (IRF) in Fort Detrick, Maryland. Image courtesy of NIAID.
COVID causing scar tissue to form in the lungs. Images show progressive pulmonary fibrosis in a 67-year-old man with a history of relatively mild, stable, fibrotic hypersensitivity pneumonitis. (A) Baseline axial CT shows mild ground-glass and reticular abnormality. (B) Axial CT angiogram obtained 2 months after infection shows substantially increased reticular abnormality with mild traction bronchiectasis. (C) Axial CT obtained 2 months later shows increased traction bronchiectasis indicating progressive fibrosis. Image courtesy of RSNA. Read more.
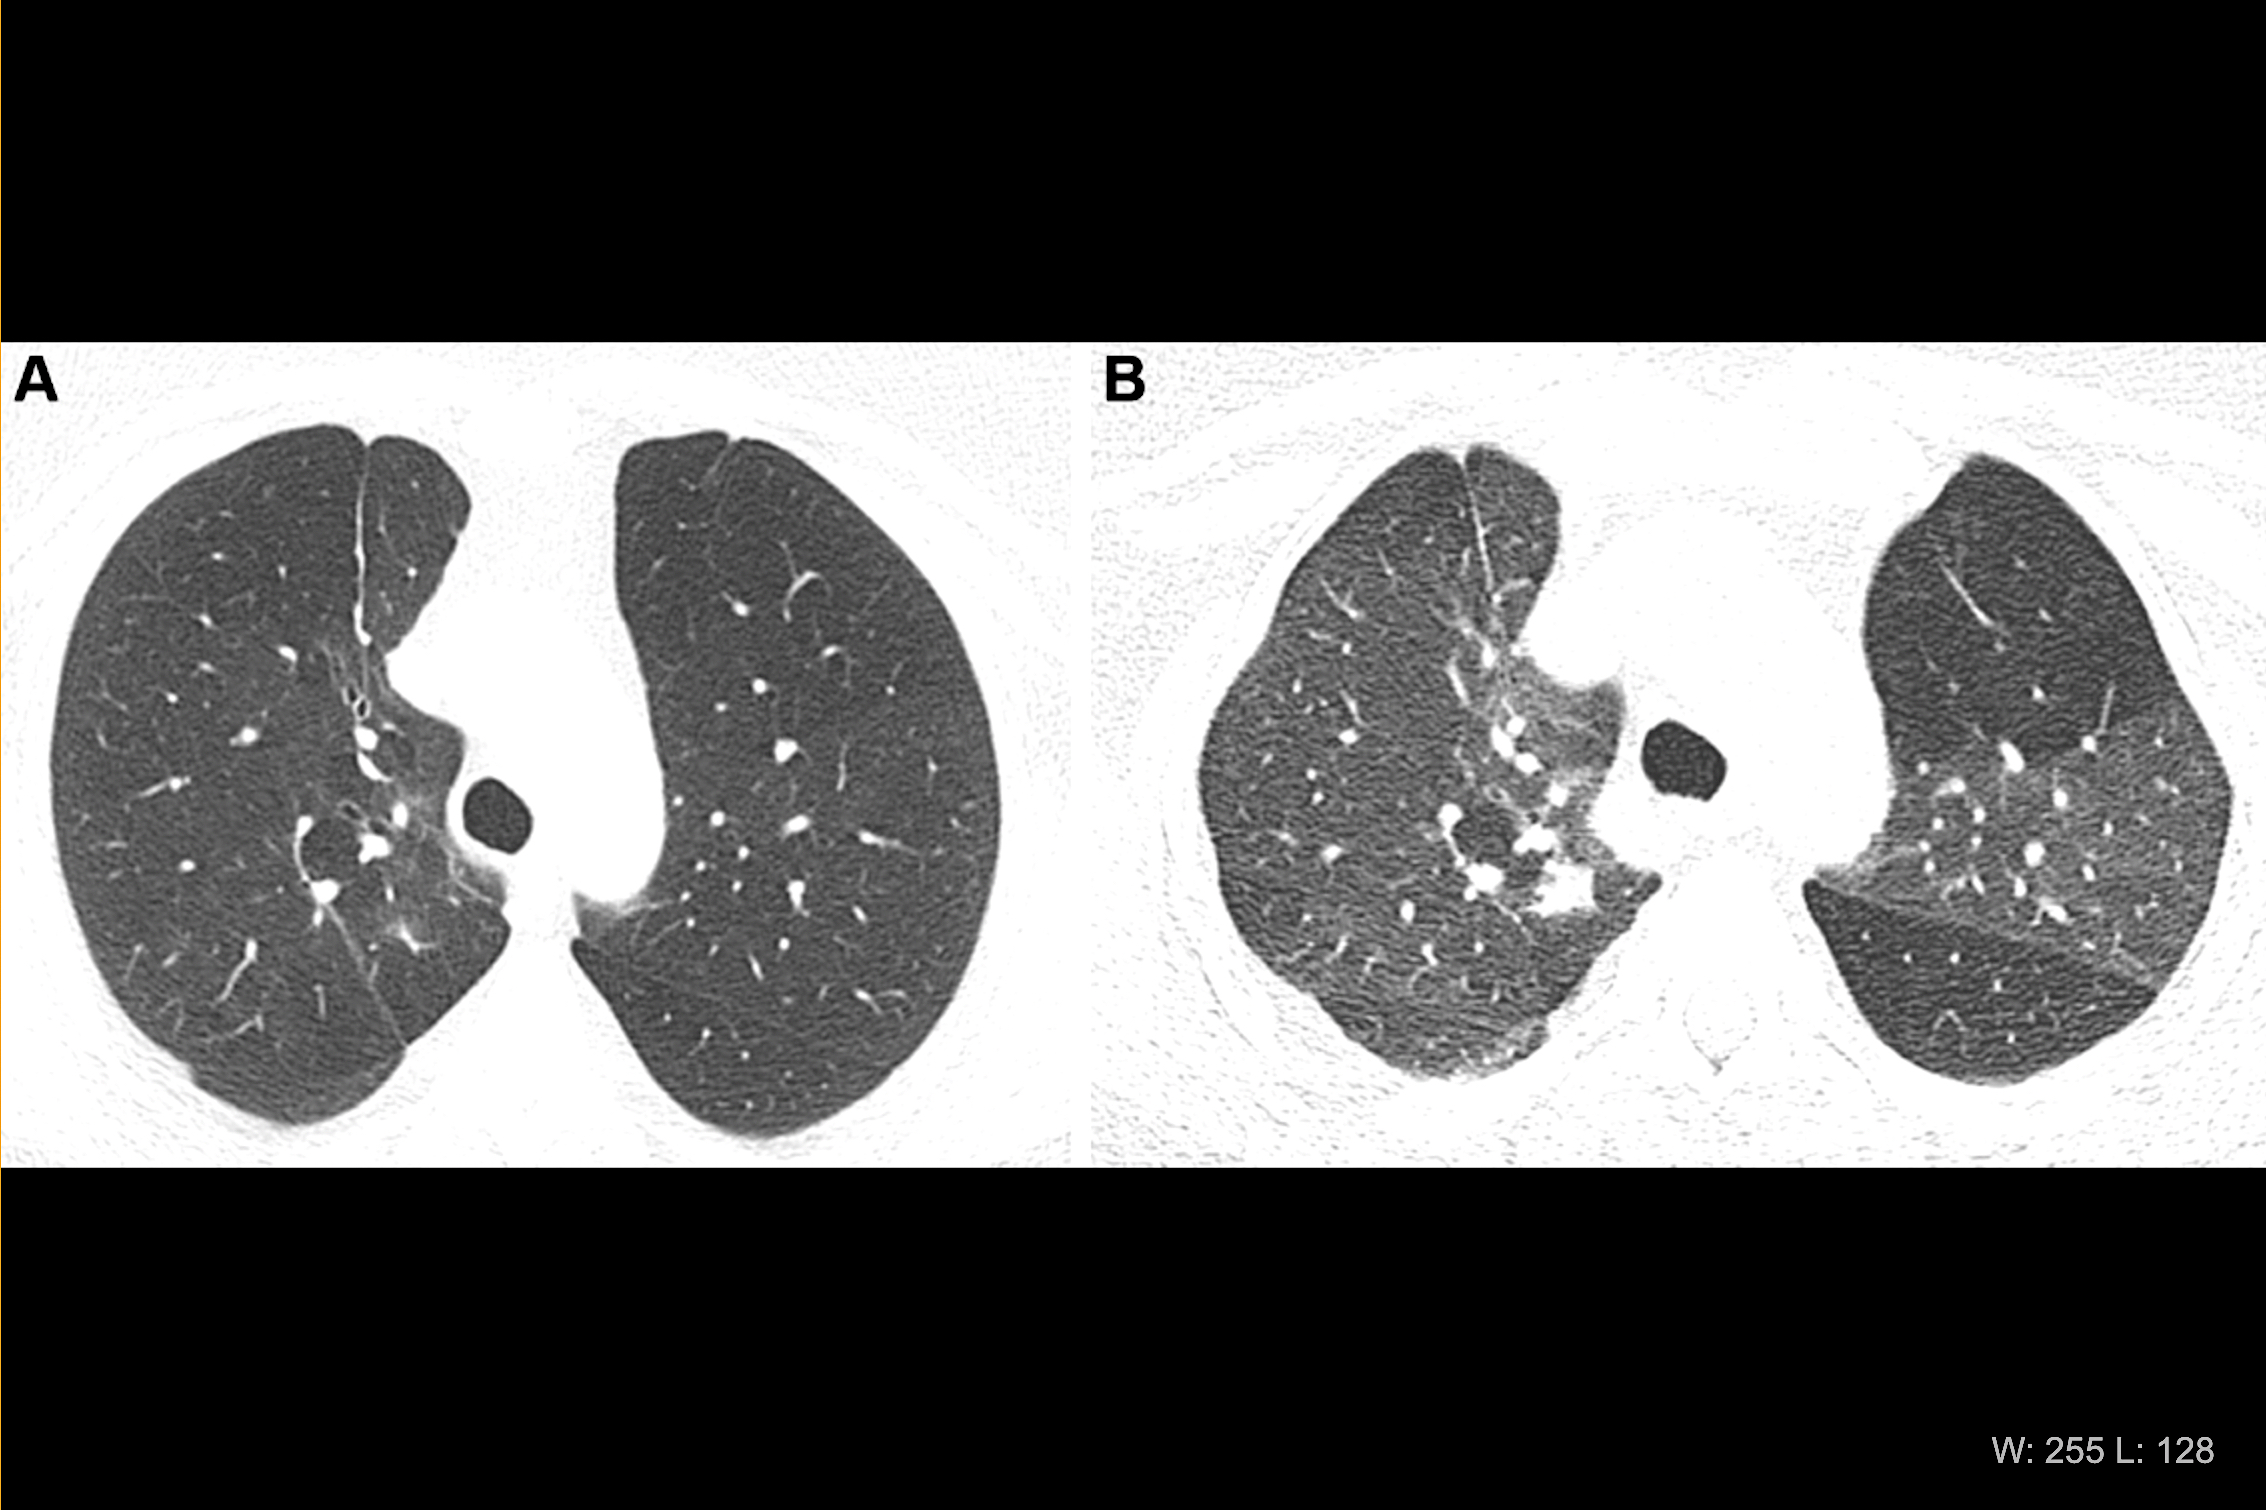
Respiratory complication following COVID. Images demonstrate obstructive lung disease after COVID-19 in a 60-year-old woman. (A) Axial inspiratory CT with persistent shortness of breath and chest tightness 8 months following COVID-19 infection shows subtle mosaic attenuation, best seen in anterior left upper lobe. (B) Axial expiratory CT confirms lobular air trapping, which was present on multiple images, indicating small airway obstruction. Image courtesy of RSNA. Read more.
Images depict pulmonary vascular disease after COVID-19 with blood clotting in the lungs. in a 63-year-old woman with persistent shortness of breath and elevated D-dimer level. (A) Axial CT pulmonary arteriogram with persistent shortness of breath and elevated D-dimer level, 7 weeks after onset of infection, shows obstructive thrombus in right interlobar pulmonary artery. (B) Axial CT with lung windows at lower level shows patchy ground-glass opacity and focal wedge-shaped consolidative abnormality in right middle lobe, typical for pulmonary infarct. (C) Three months later, large central thrombus had resolved, but nonocclusive linear webs were present in segmental vessels (arrows), typical for chronic thromboembolic disease. Image courtesy of RSNA. Read more.
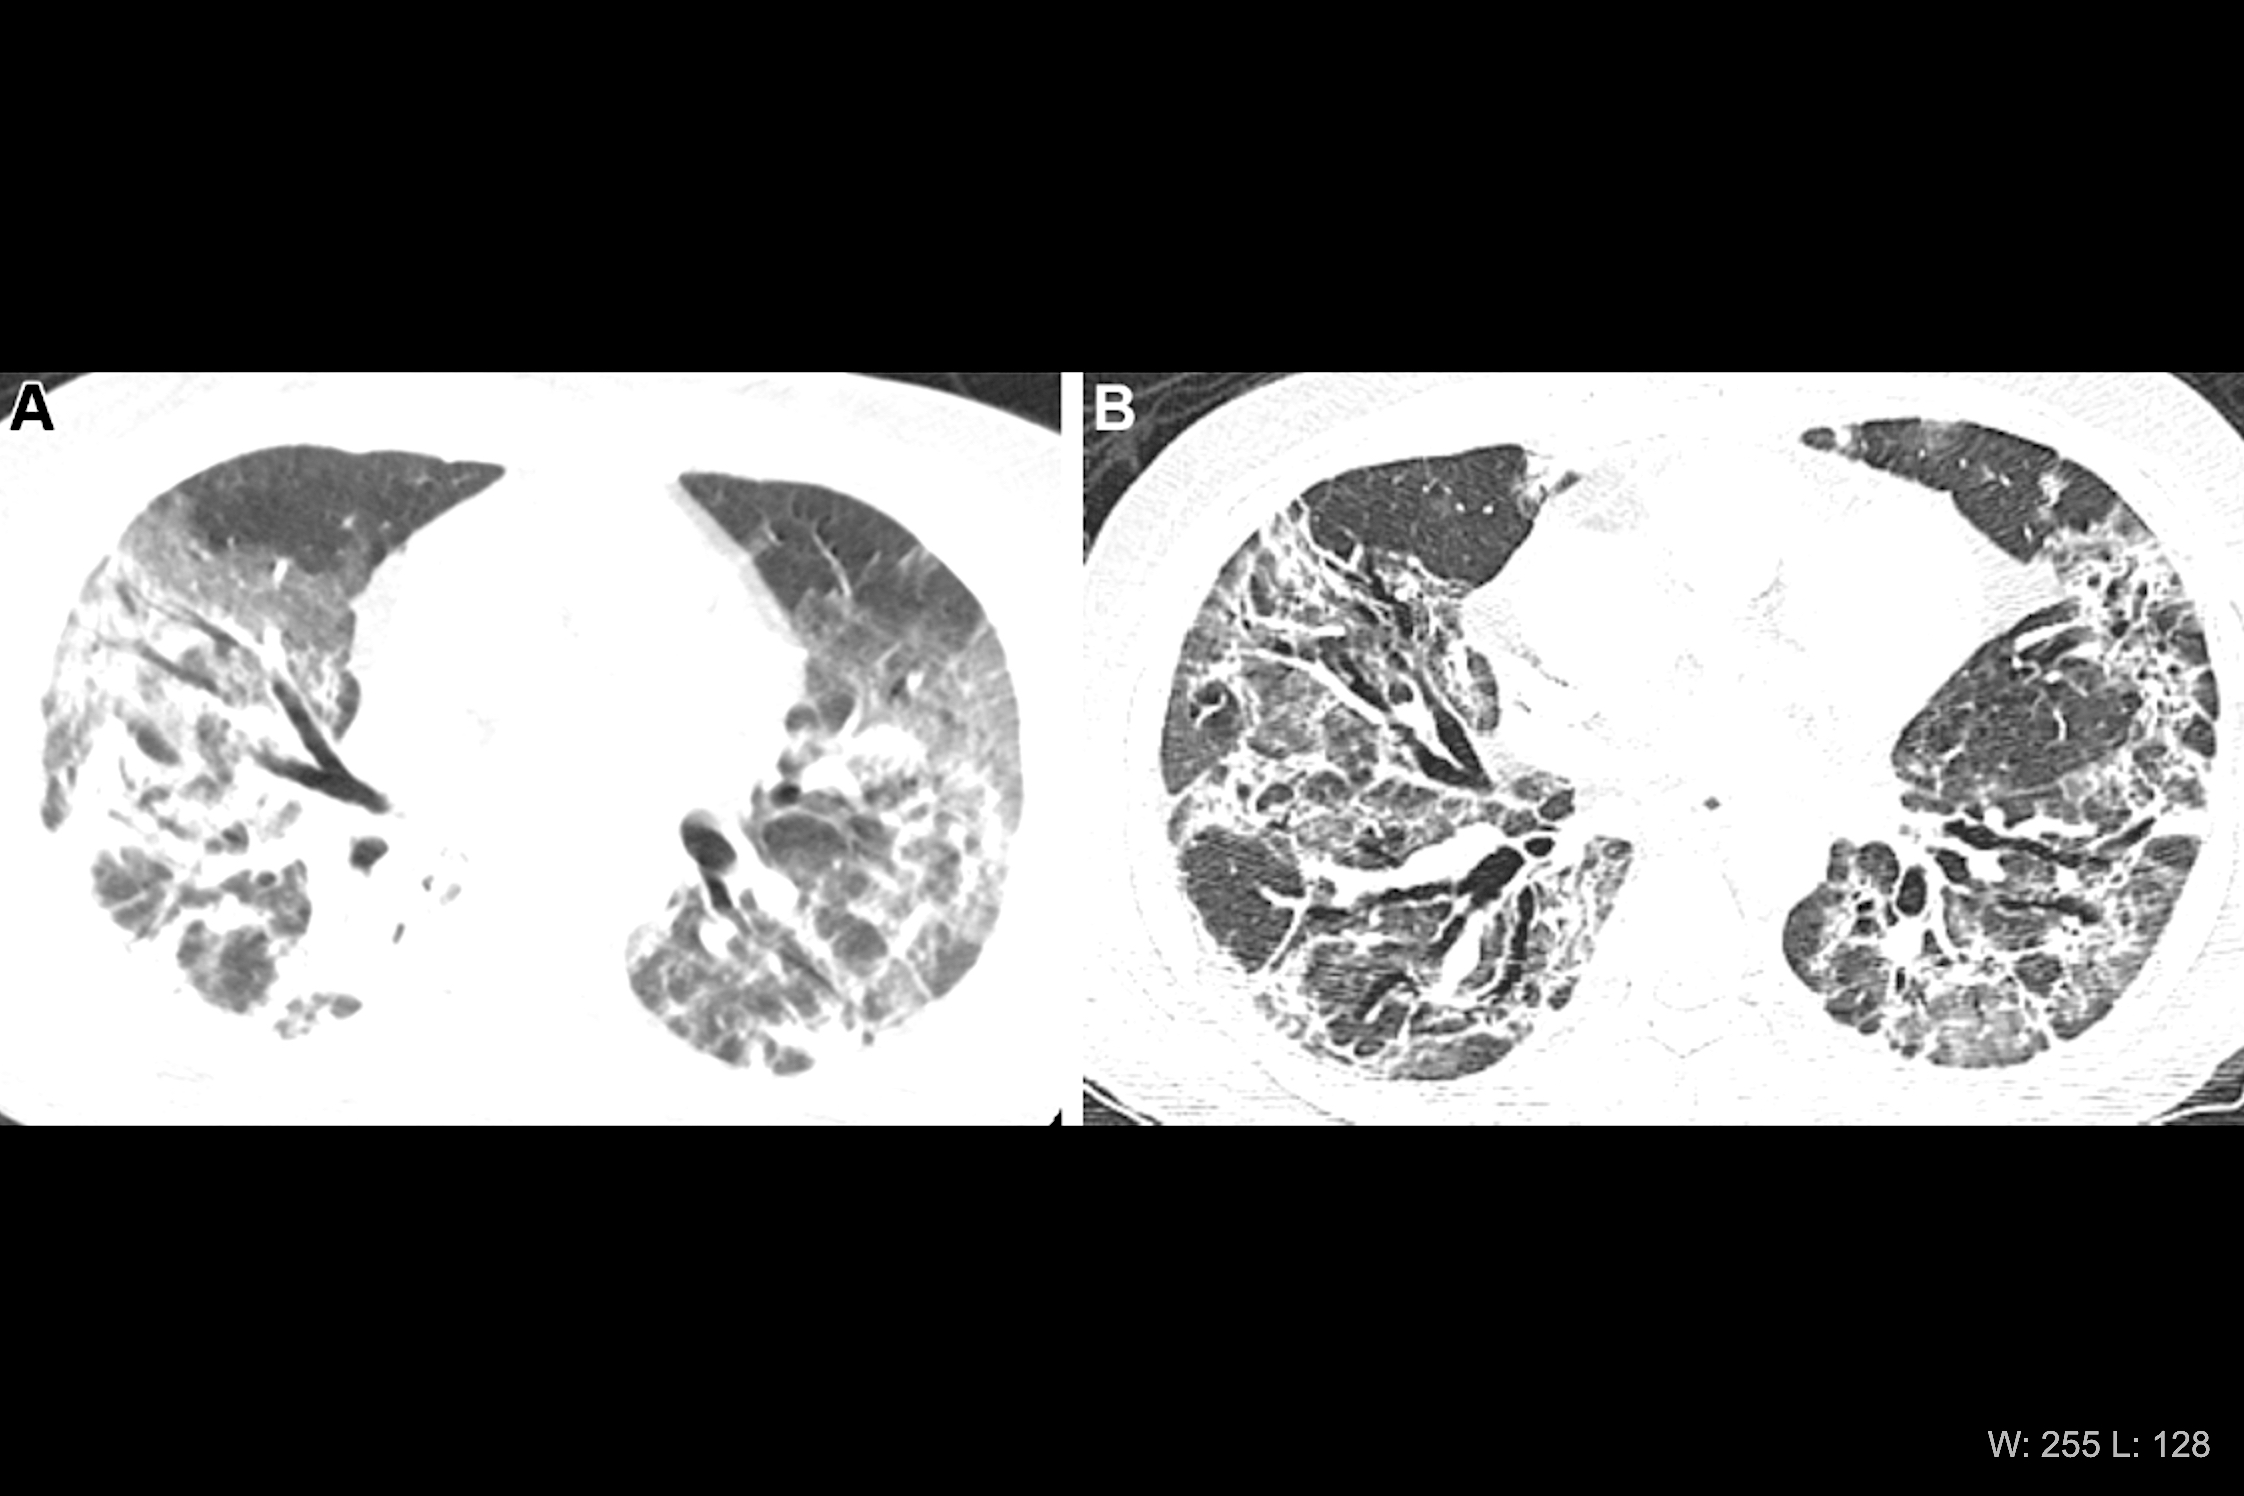
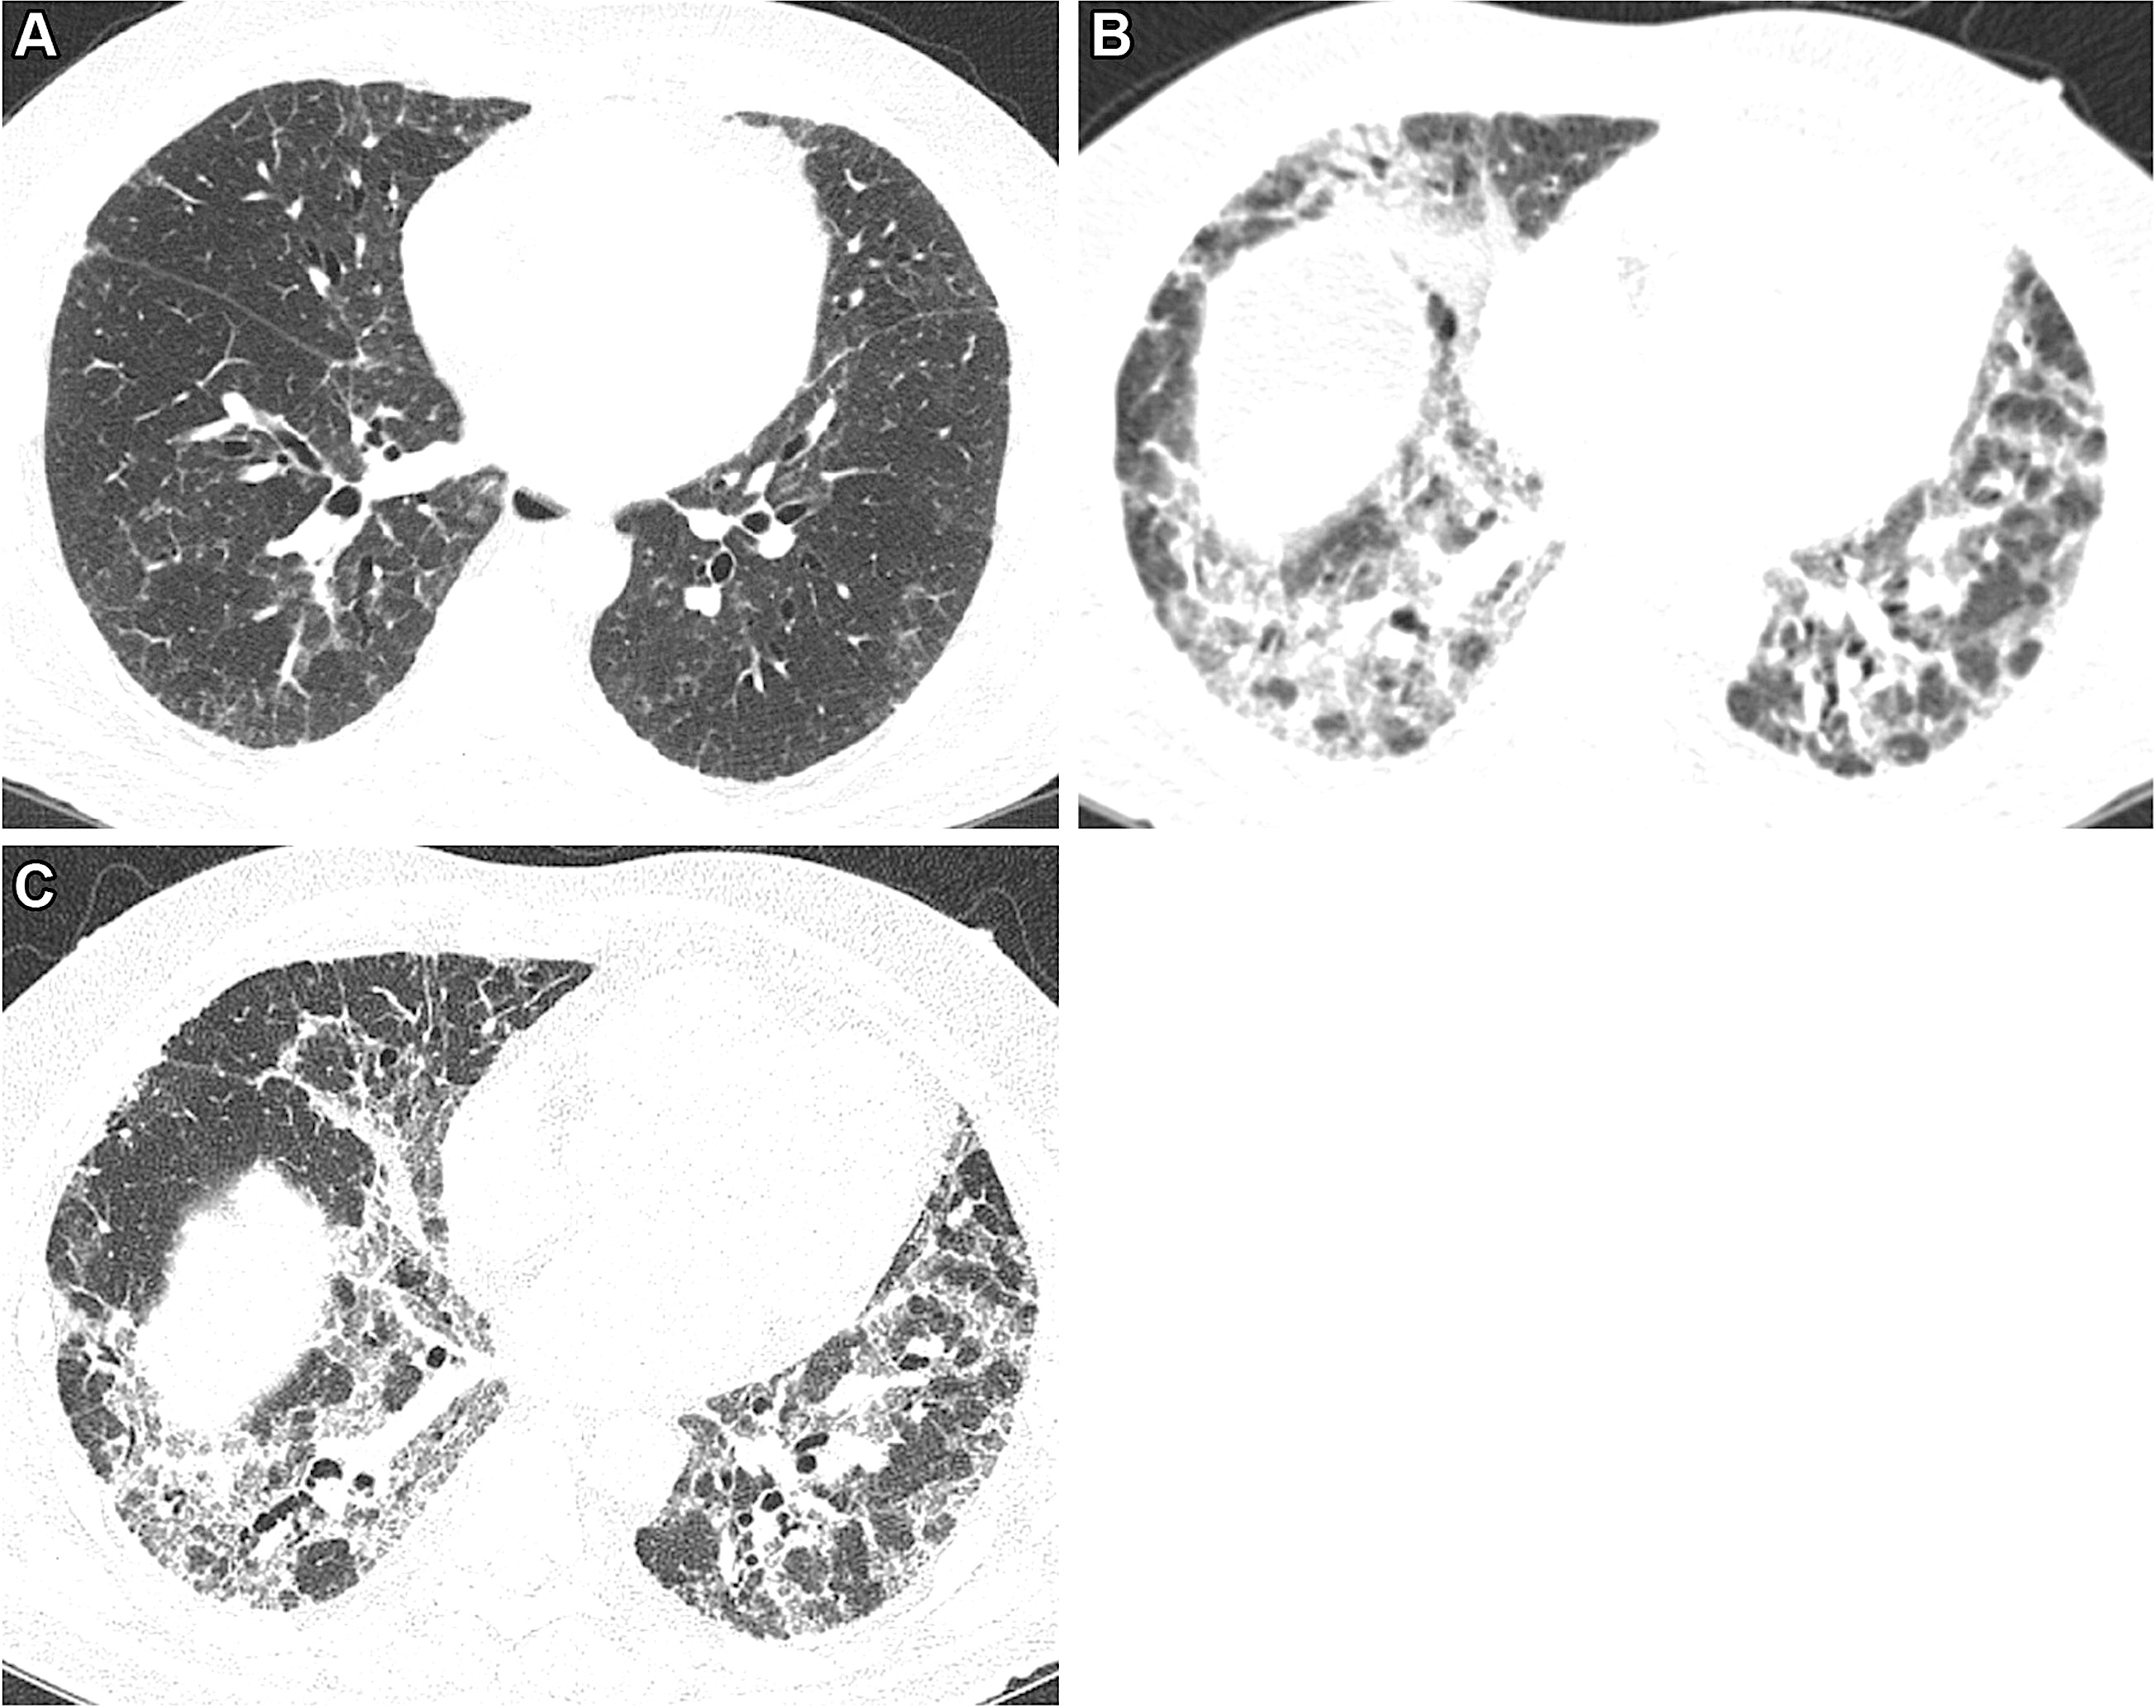
Patient with severe, long-term lung damage from COVID. Images in a 54-year-old man with COVID-19–related acute respiratory distress syndrome and subsequent fibrosis. (A) Axial CT 2 weeks after admission shows diffuse ground-glass opacity (GGO) with reticular abnormality and traction bronchiectasis in right middle lobe, indicating organizing phase of lung injury. (B) Axial CT 6 months after admission shows decreased GGO but extensive traction bronchiectasis and architectural distortion, suggesting fibrosis. Patient remained symptomatic with restricted pulmonary function. Image courtesy of RSNA. Read more. Read more.
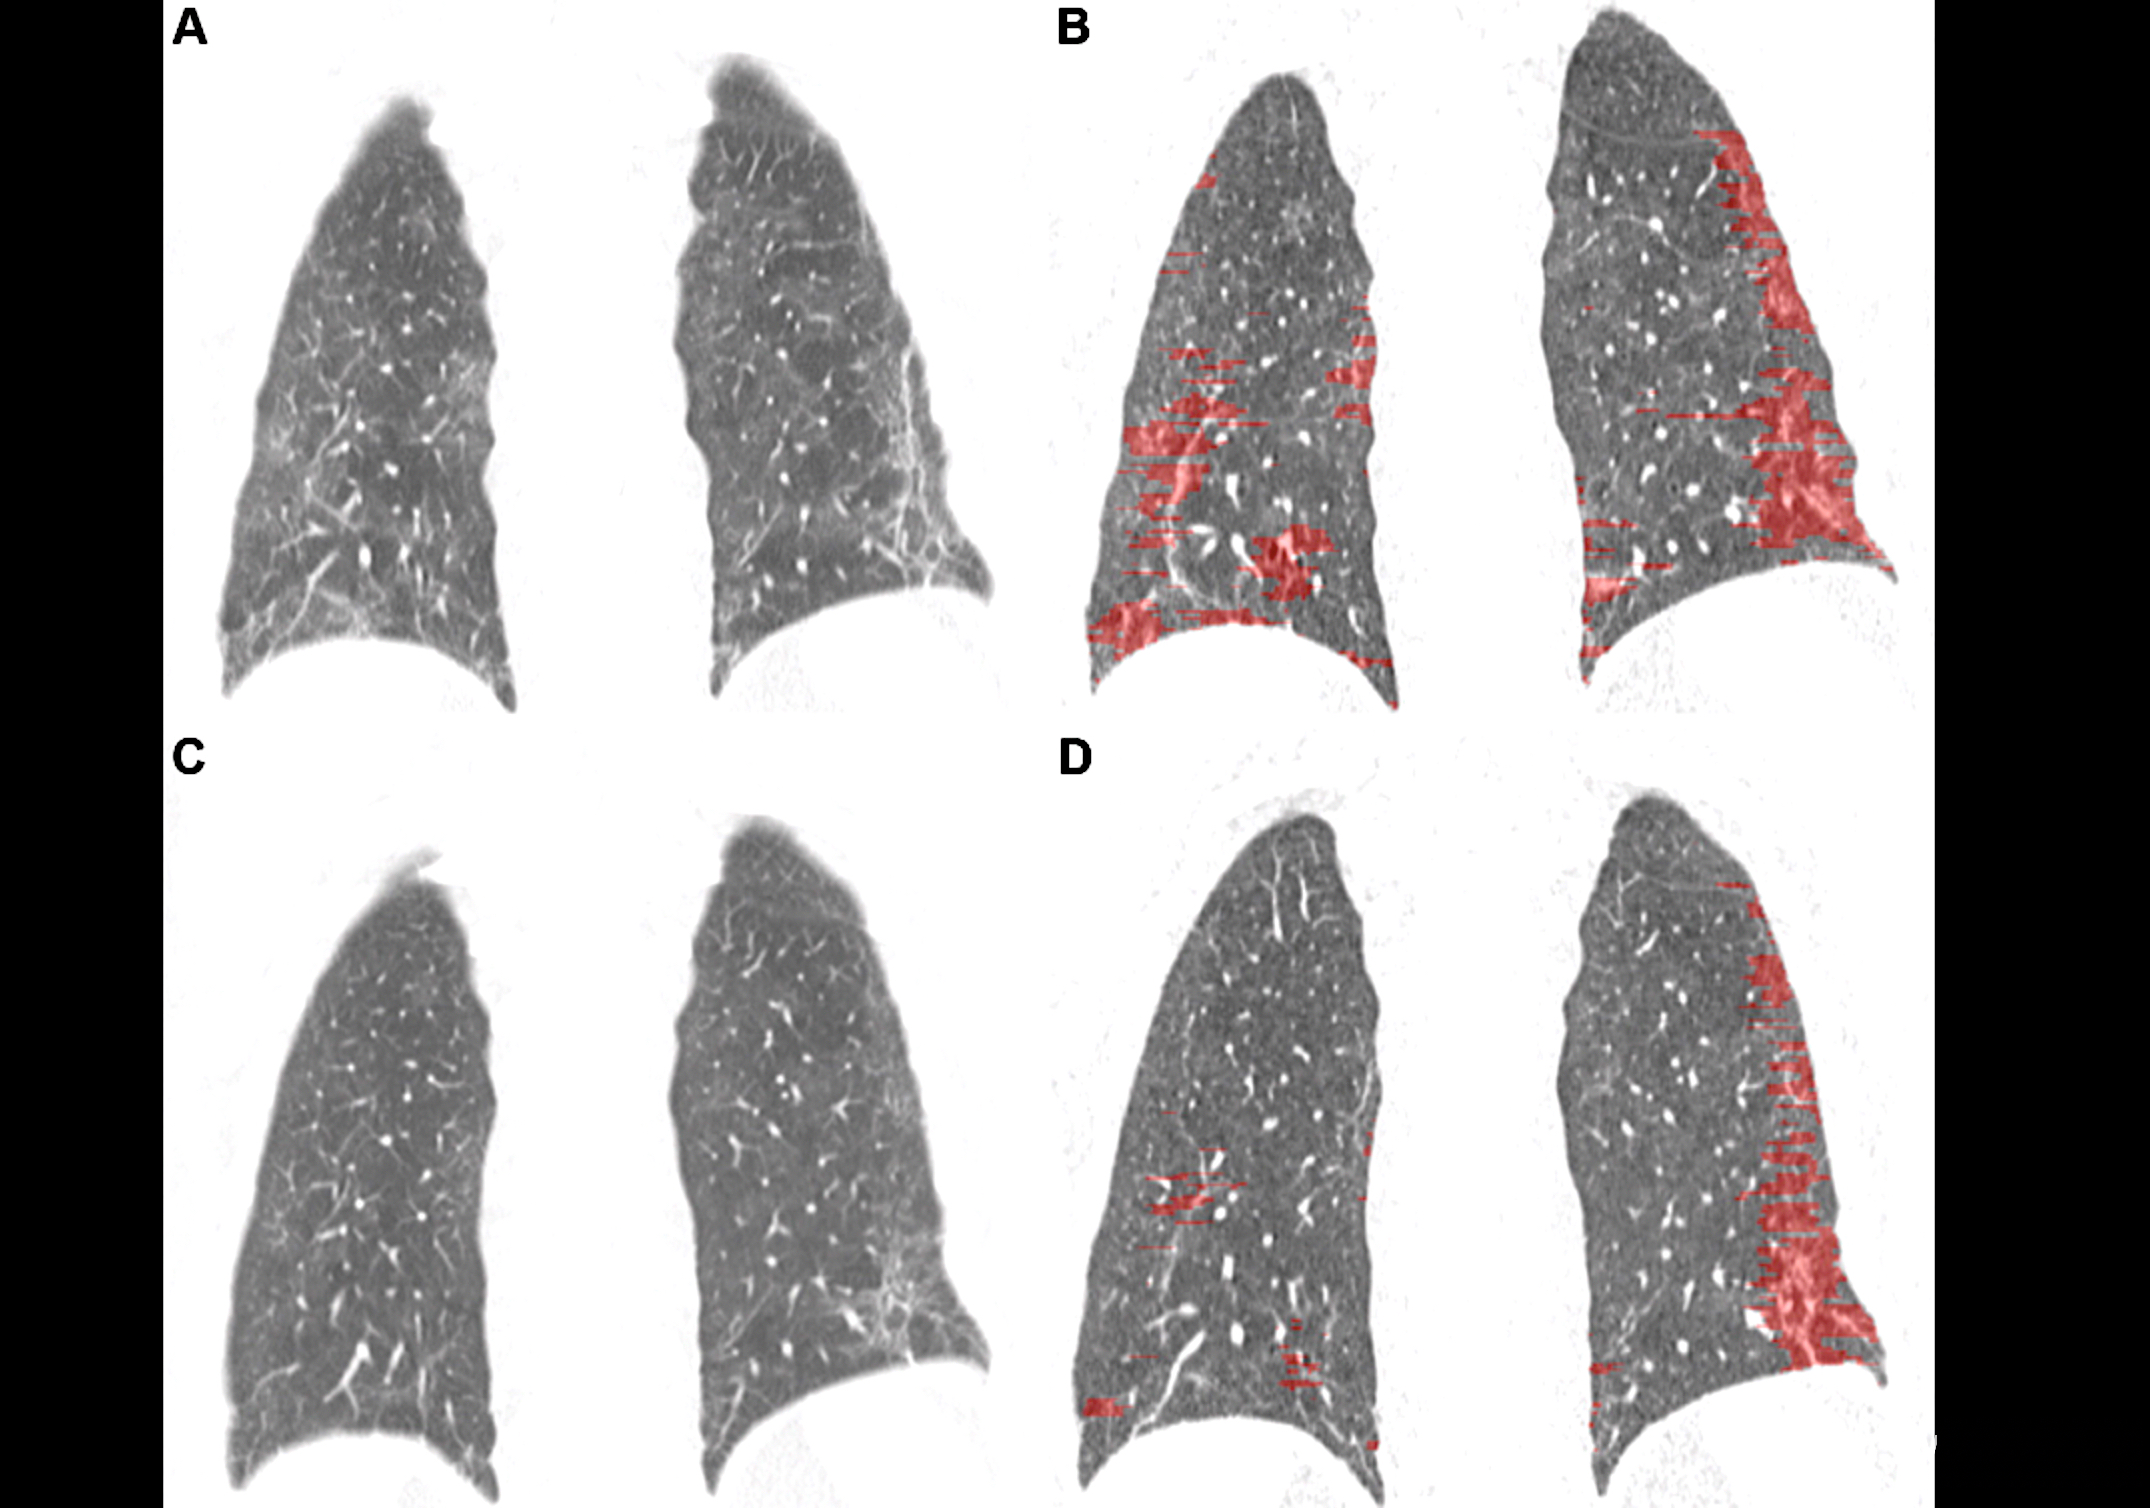
Images depict quantitative CT assessment of linear and reticular abnormality following COVID-19 acute respiratory distress syndrome in a 59-year-old woman. (A) Coronal CT obtained 10 weeks after onset of infection shows ground-glass opacity with linear and reticular abnormality at both bases. (B) Corresponding quantitative CT image delineates linear and reticular abnormality, quantified at 10.5% of lung volume. (C) Four months later, extent of ground-glass and of linear and reticular abnormality had decreased substantially. Symptoms had resolved, and pulmonary function had returned to normal. (D) Corresponding quantitative CT indicates decrease in linear and reticular abnormality, now 4.6%. Image courtesy of RSNA. Read more.
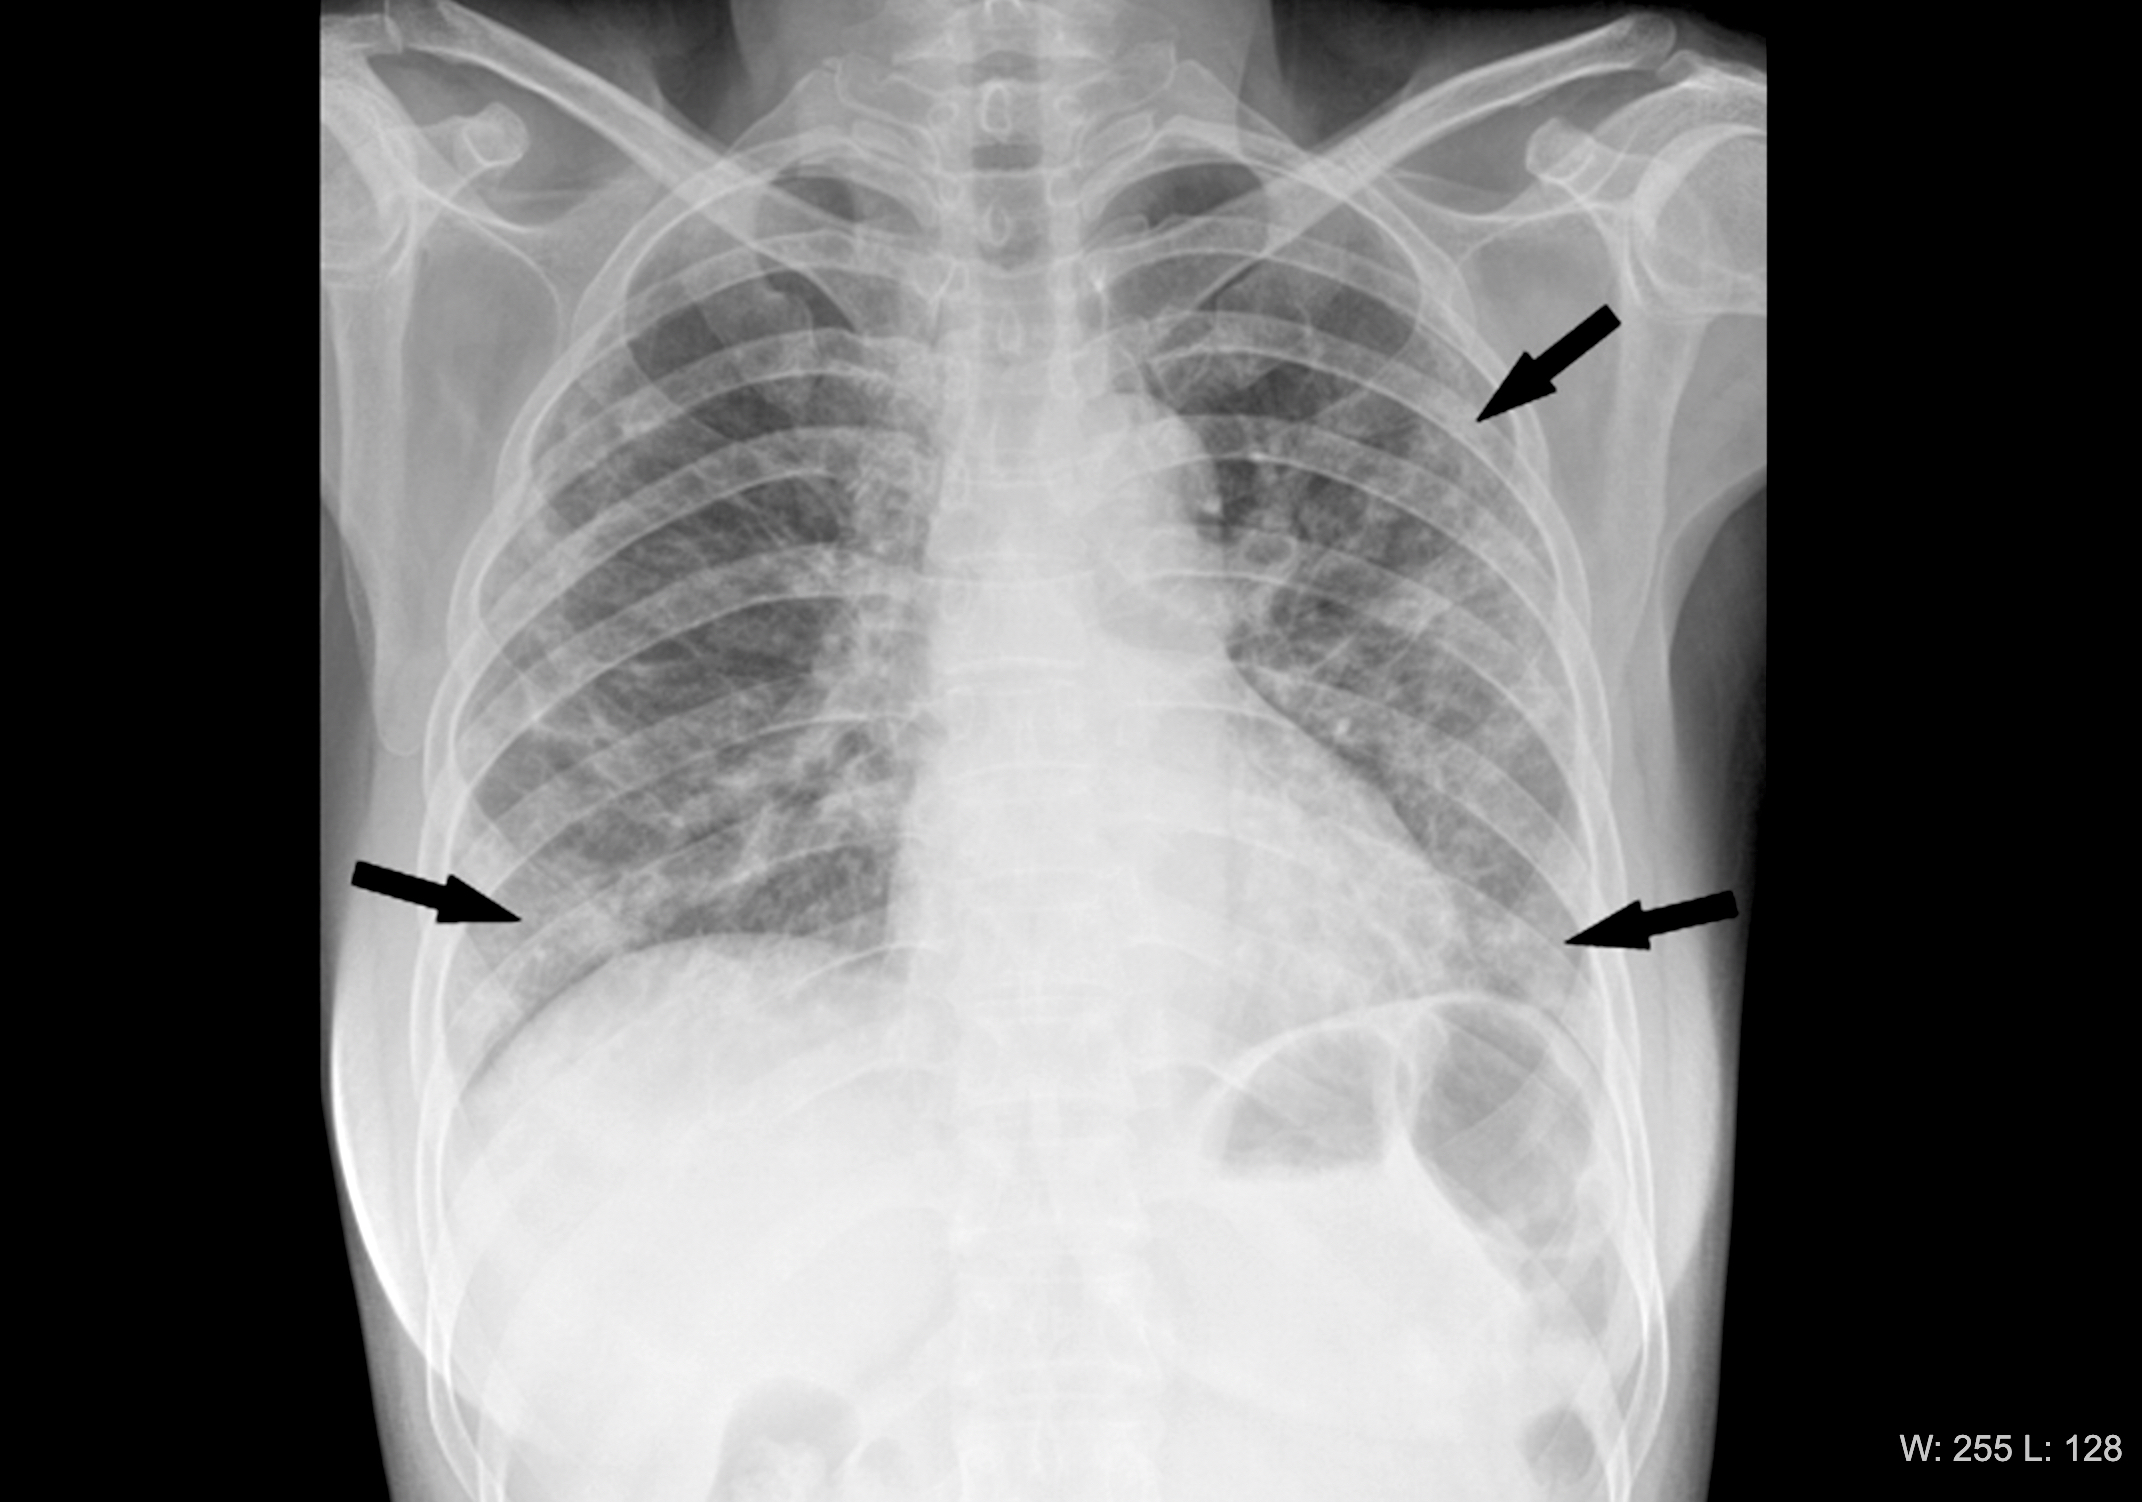
Chest radiograph in a 53-year-old woman with confirmed coronavirus disease 2019, or COVID-19, pneumonia. The patient had fever and cough for 5 days. Multifocal patchy opacities (arrows) can be seen in both lungs. Imaghe from among the first Chinese infected with COVID to be imaged in January 2020. Image courtesy of RSNA. Read more.
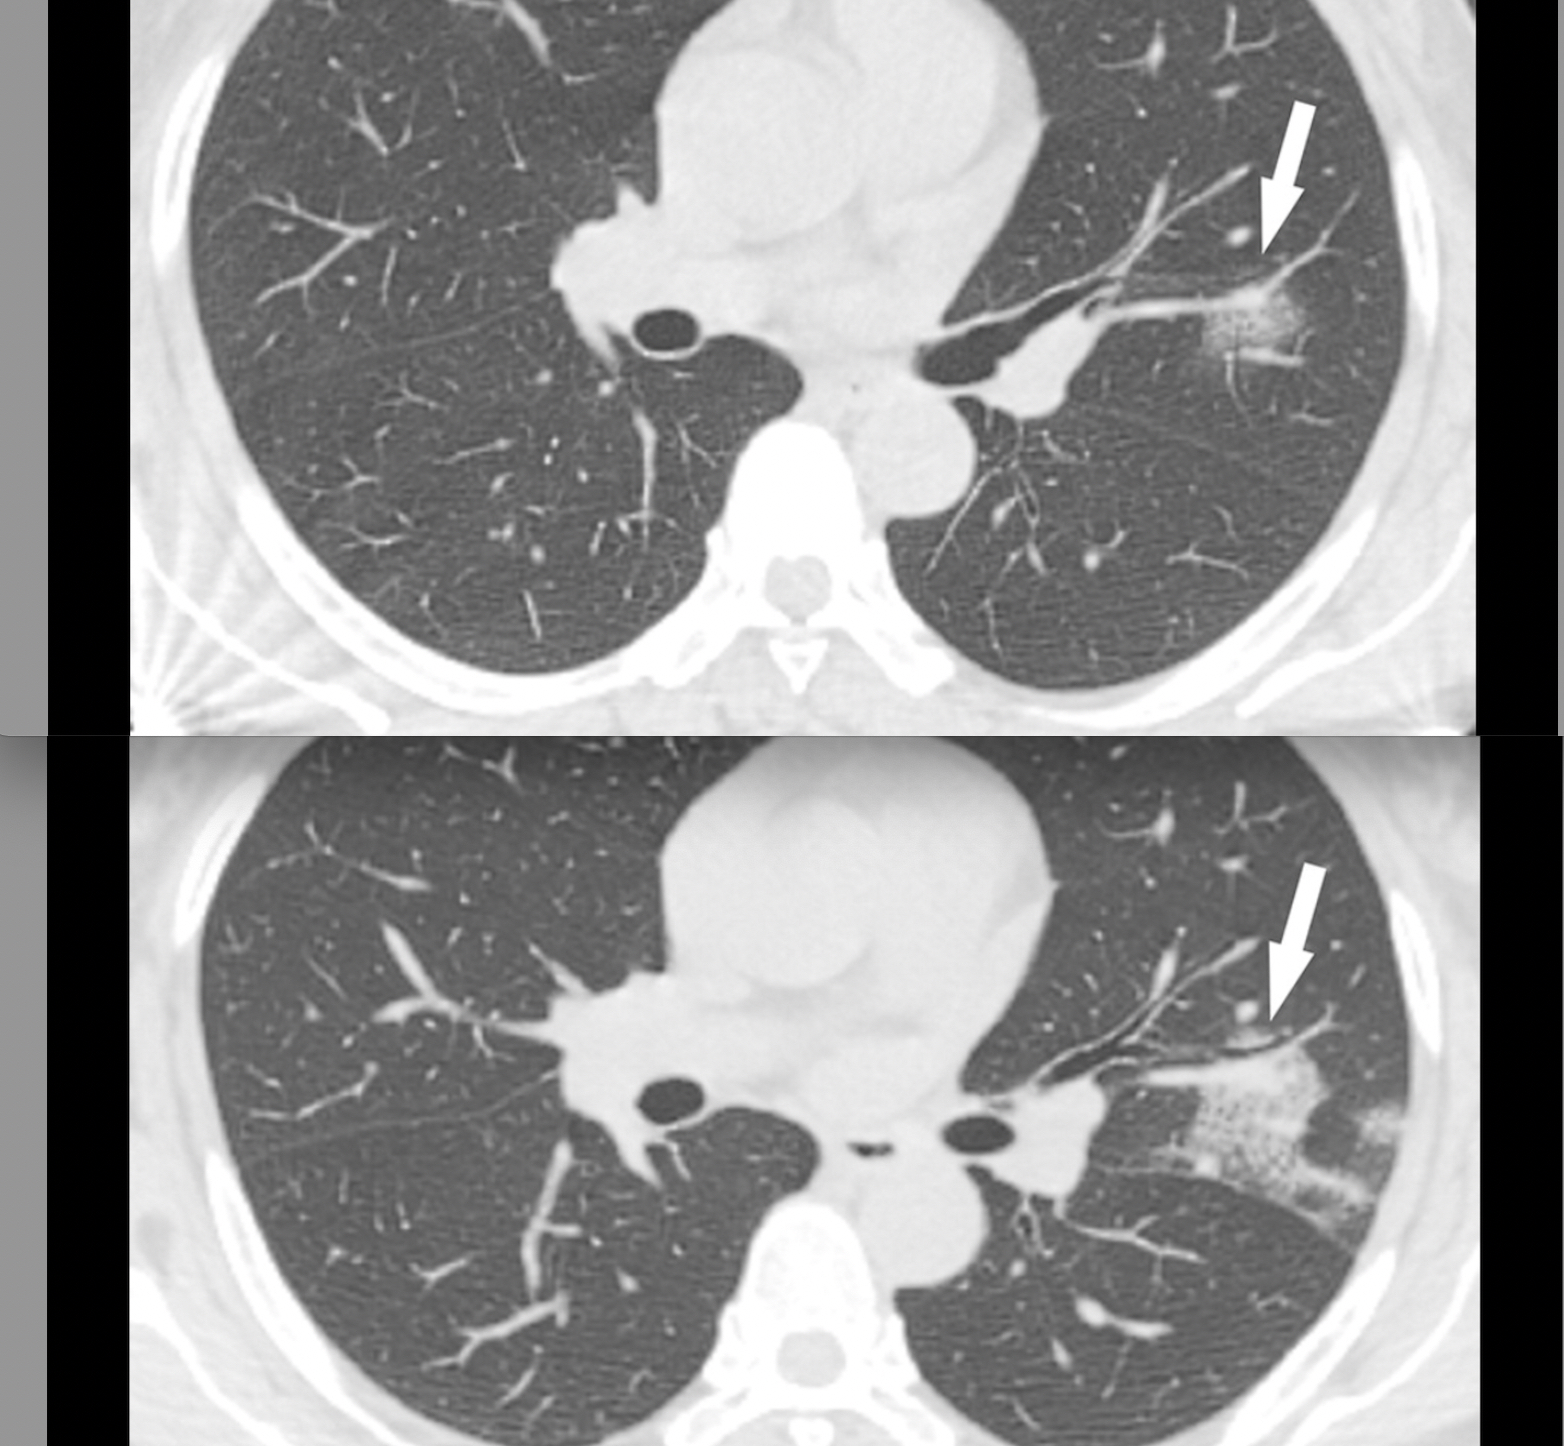
CT of coronavirus pneumonia, a solitary rounded ground-glass opacity (GGO) pattern. A 51-year-old woman in China presented in January 2020 without fever, but had close contact with positive patients. Top, baseline axial unenhanced chest CT obtained 6 days before the first positive PCR test. Bottom, chest CT scan 4 days later shows the size increase of the lesion (arrow). Image courtesy of RSNA. Read more.
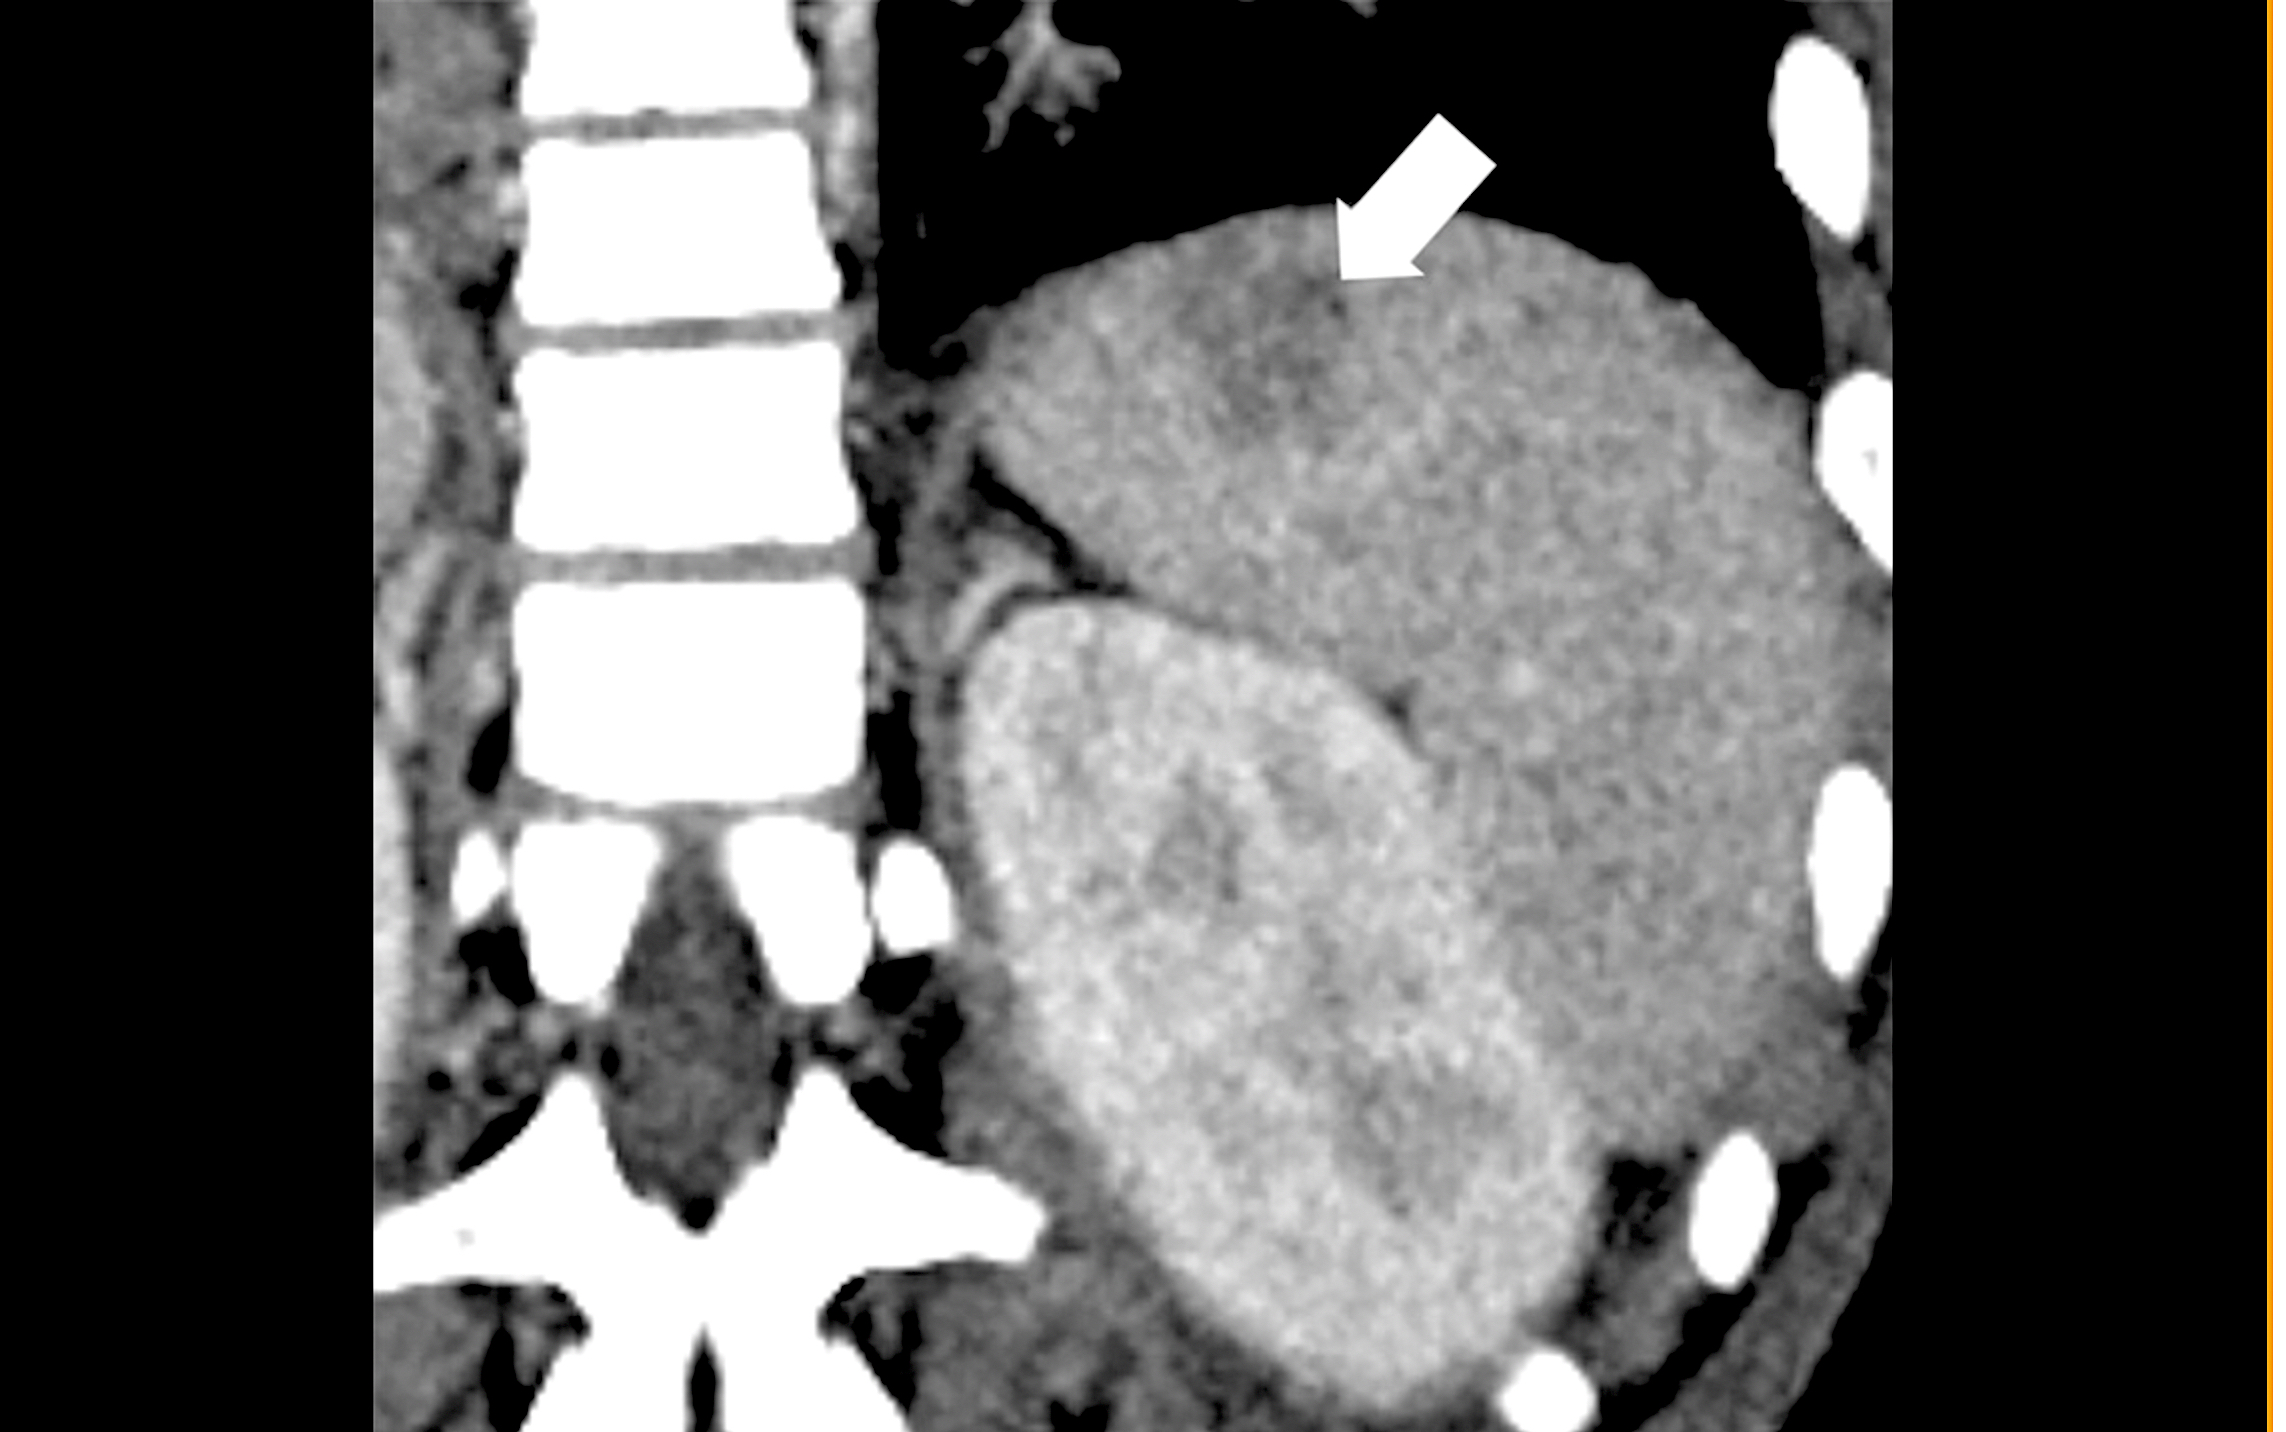
An infarct in the spleen in Multisystem Inflammatory Syndrome in Children (MIS-C) in a 15-year-old patient. Coronal CT image through the left upper quadrant shows a focal subcapsular, hypo-attenuating region within the spleen in keeping with a splenic infarct (arrow).Image courtesy of RSNA. Read more.
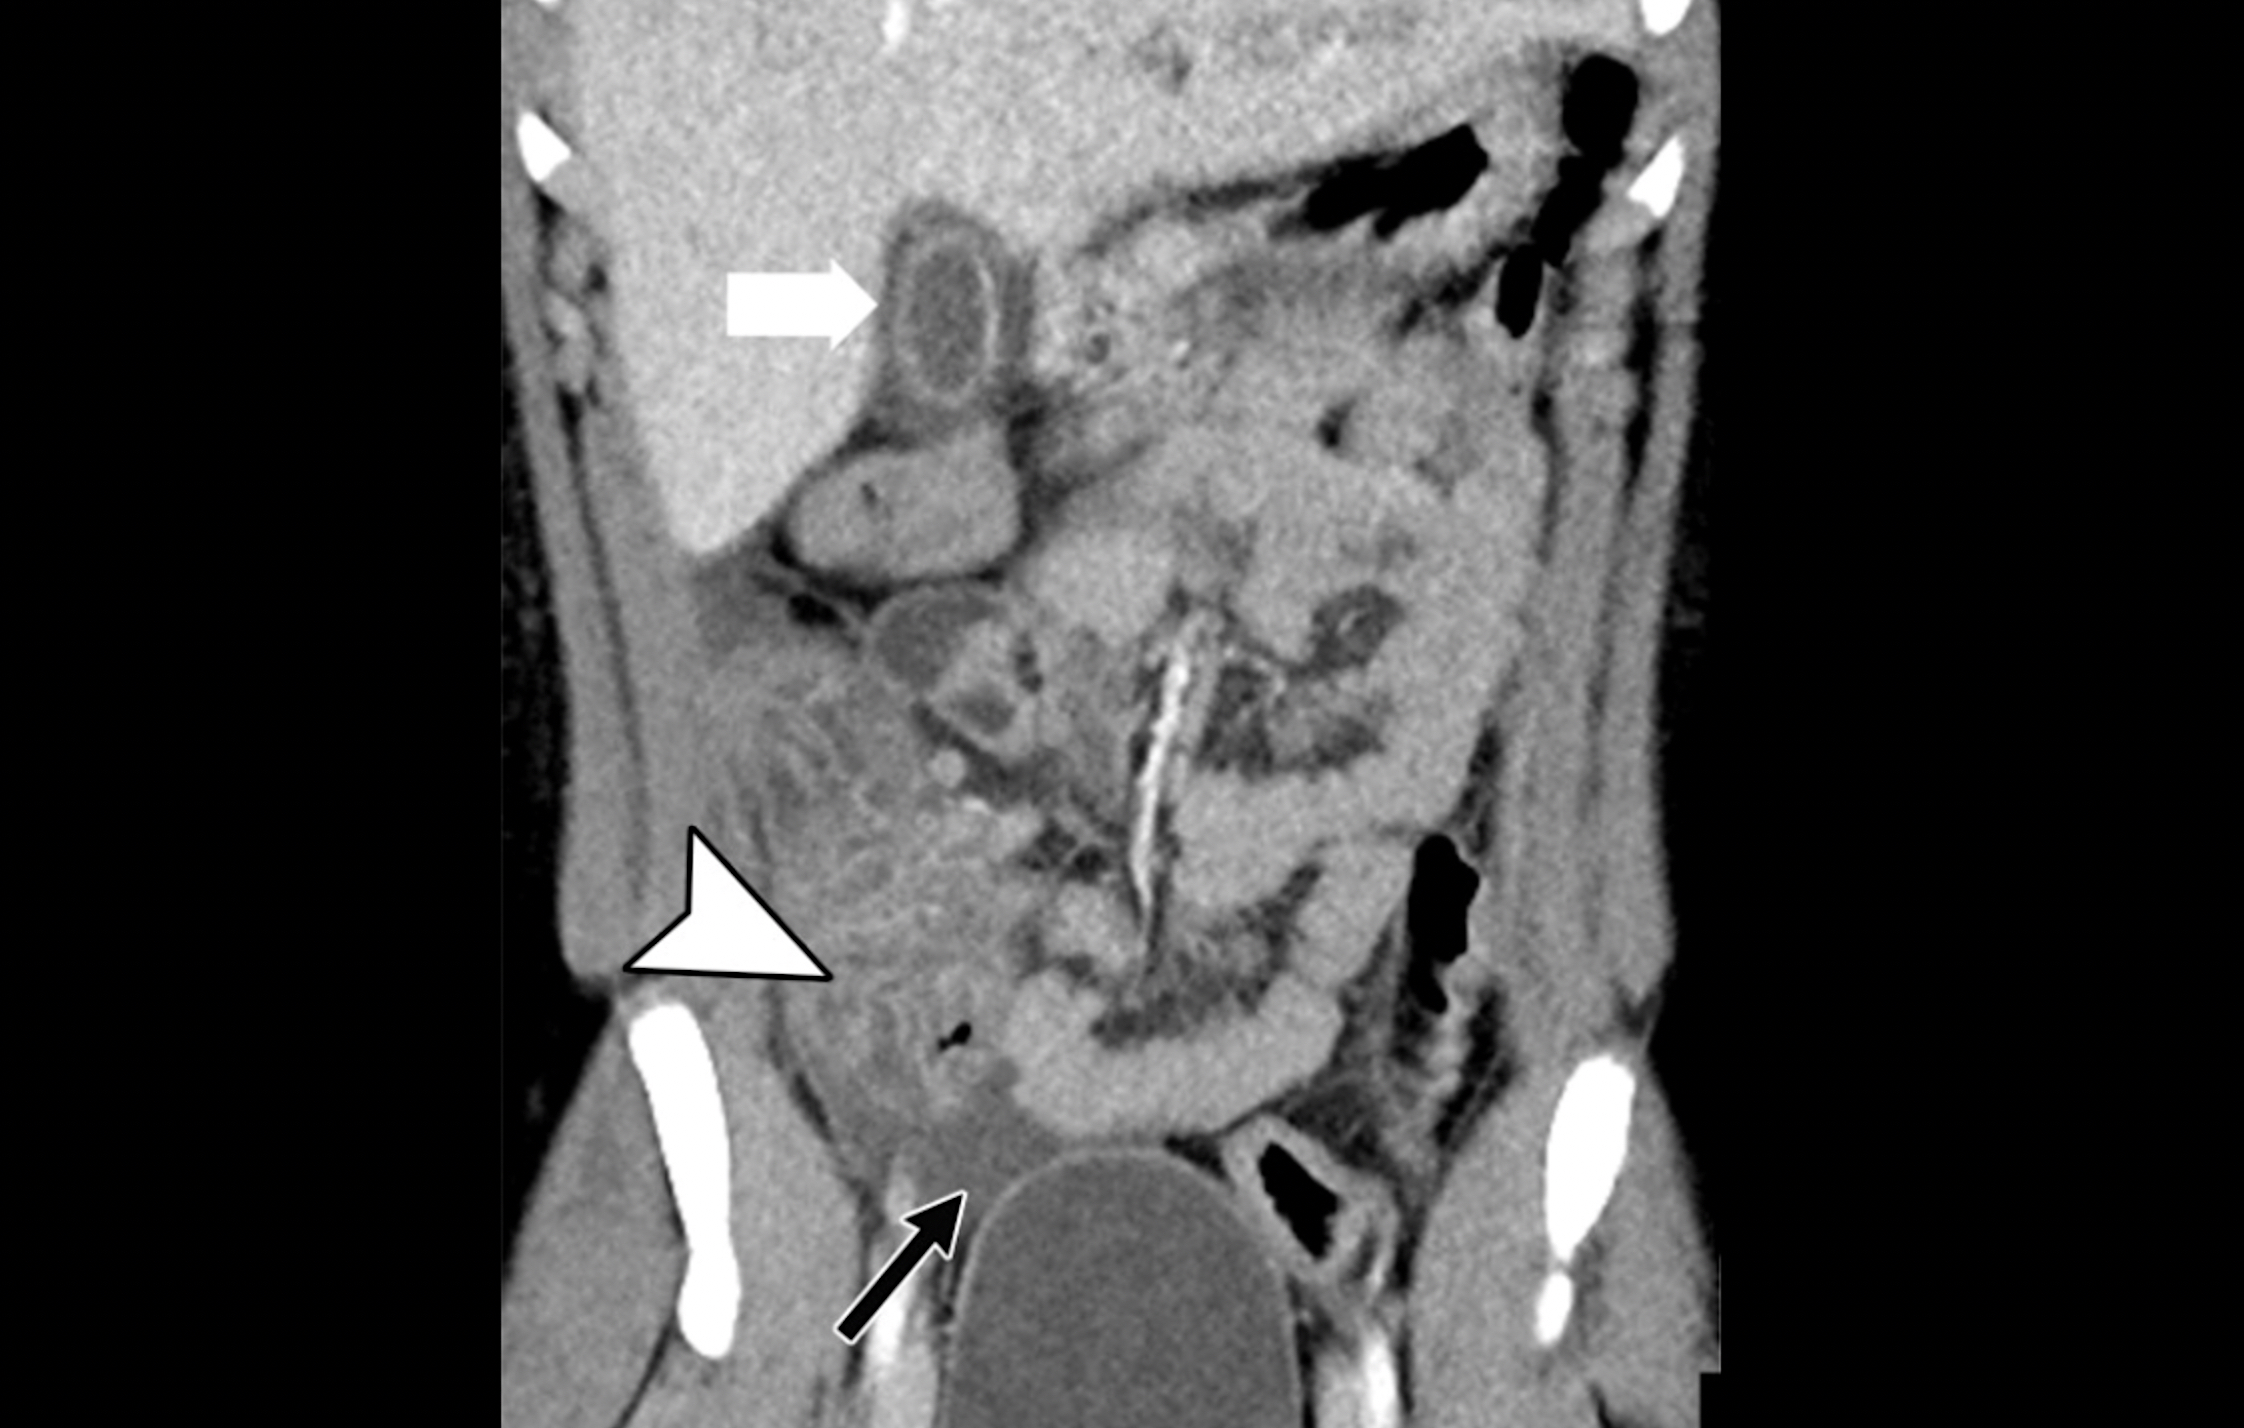
Multisystem Inflammatory Syndrome in Children (MIS-C) presentations on a contrast CT of the abdomen and pelvis in a 15-year-old boy. Coronal image of the abdomen demonstrates gallbladder wall edema (white arrow). There is extensive thickening of the cecal wall thickening (arrowhead) and free fluid within the pelvis (black arrow). Image courtesy of RSNA. Read more.
COVID causes an increased risk of clotting. Example of an aortic mural clot (arrows) on contrast-enhanced CT scans in a 63-year-old woman with COVID-19 and a history of antiphospholipid syndrome. Image courtesy of RSNA. Read more.
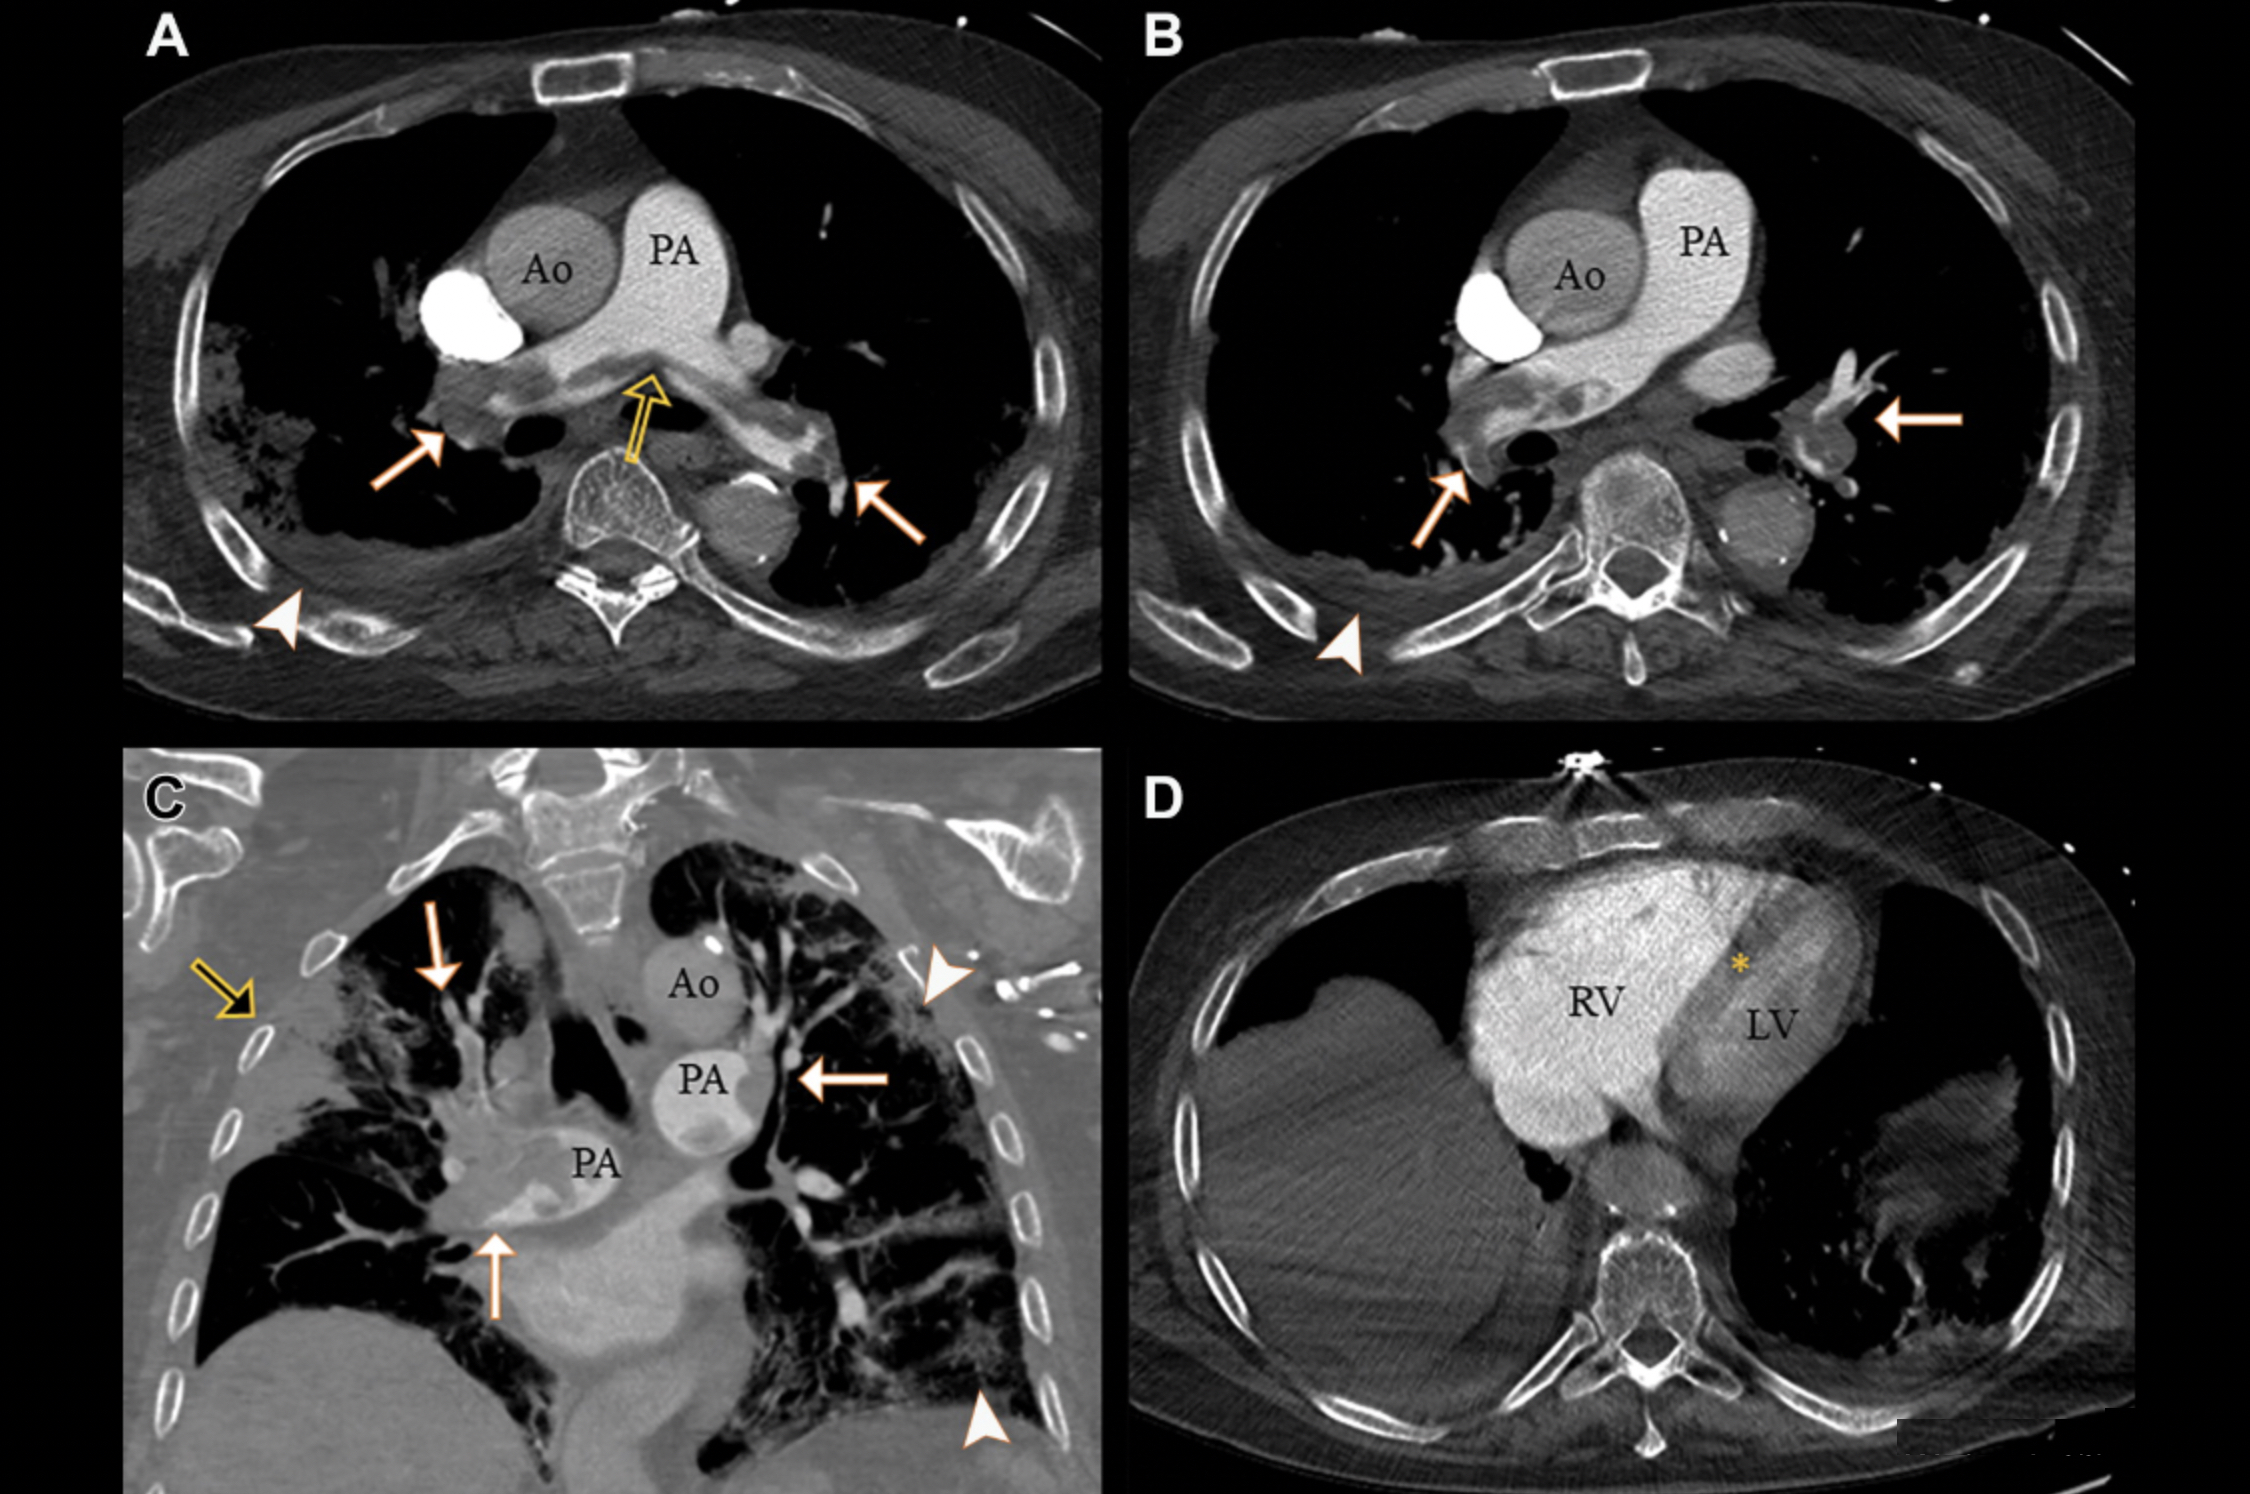
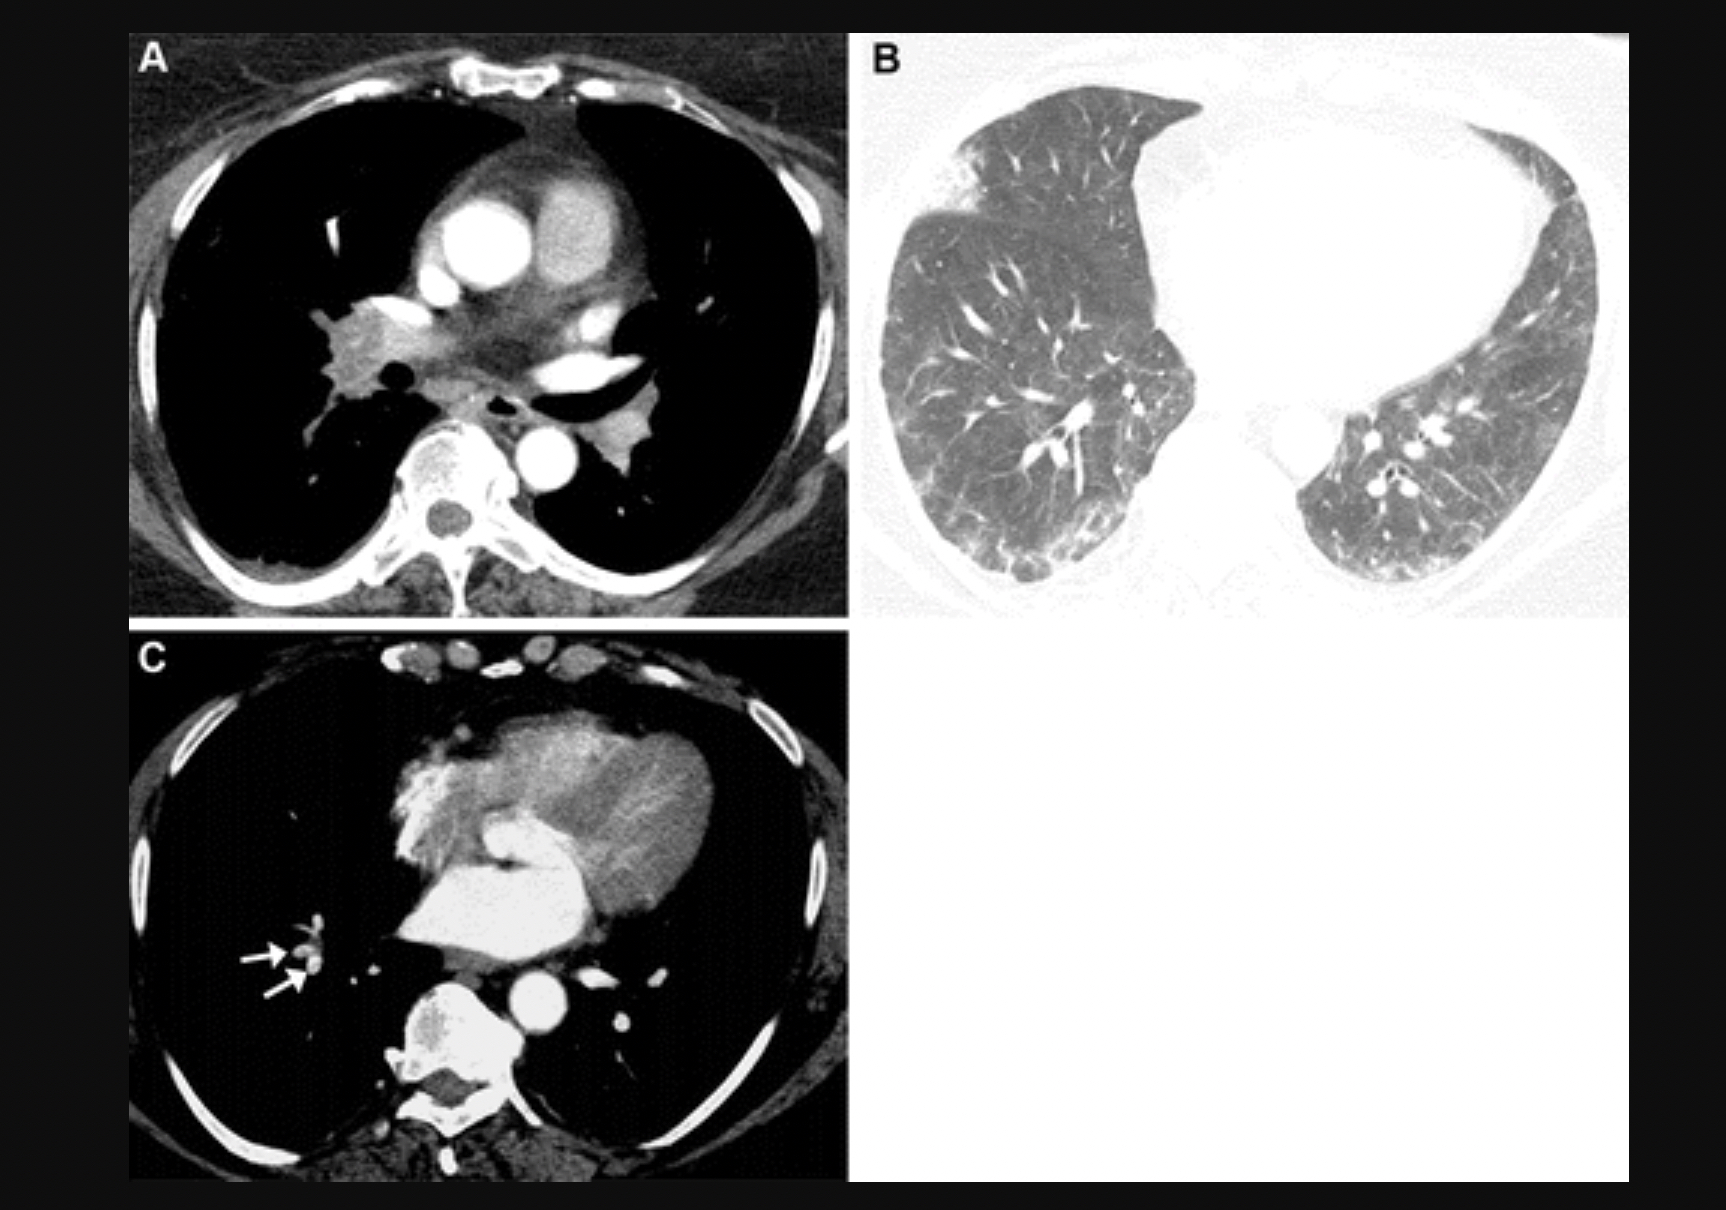
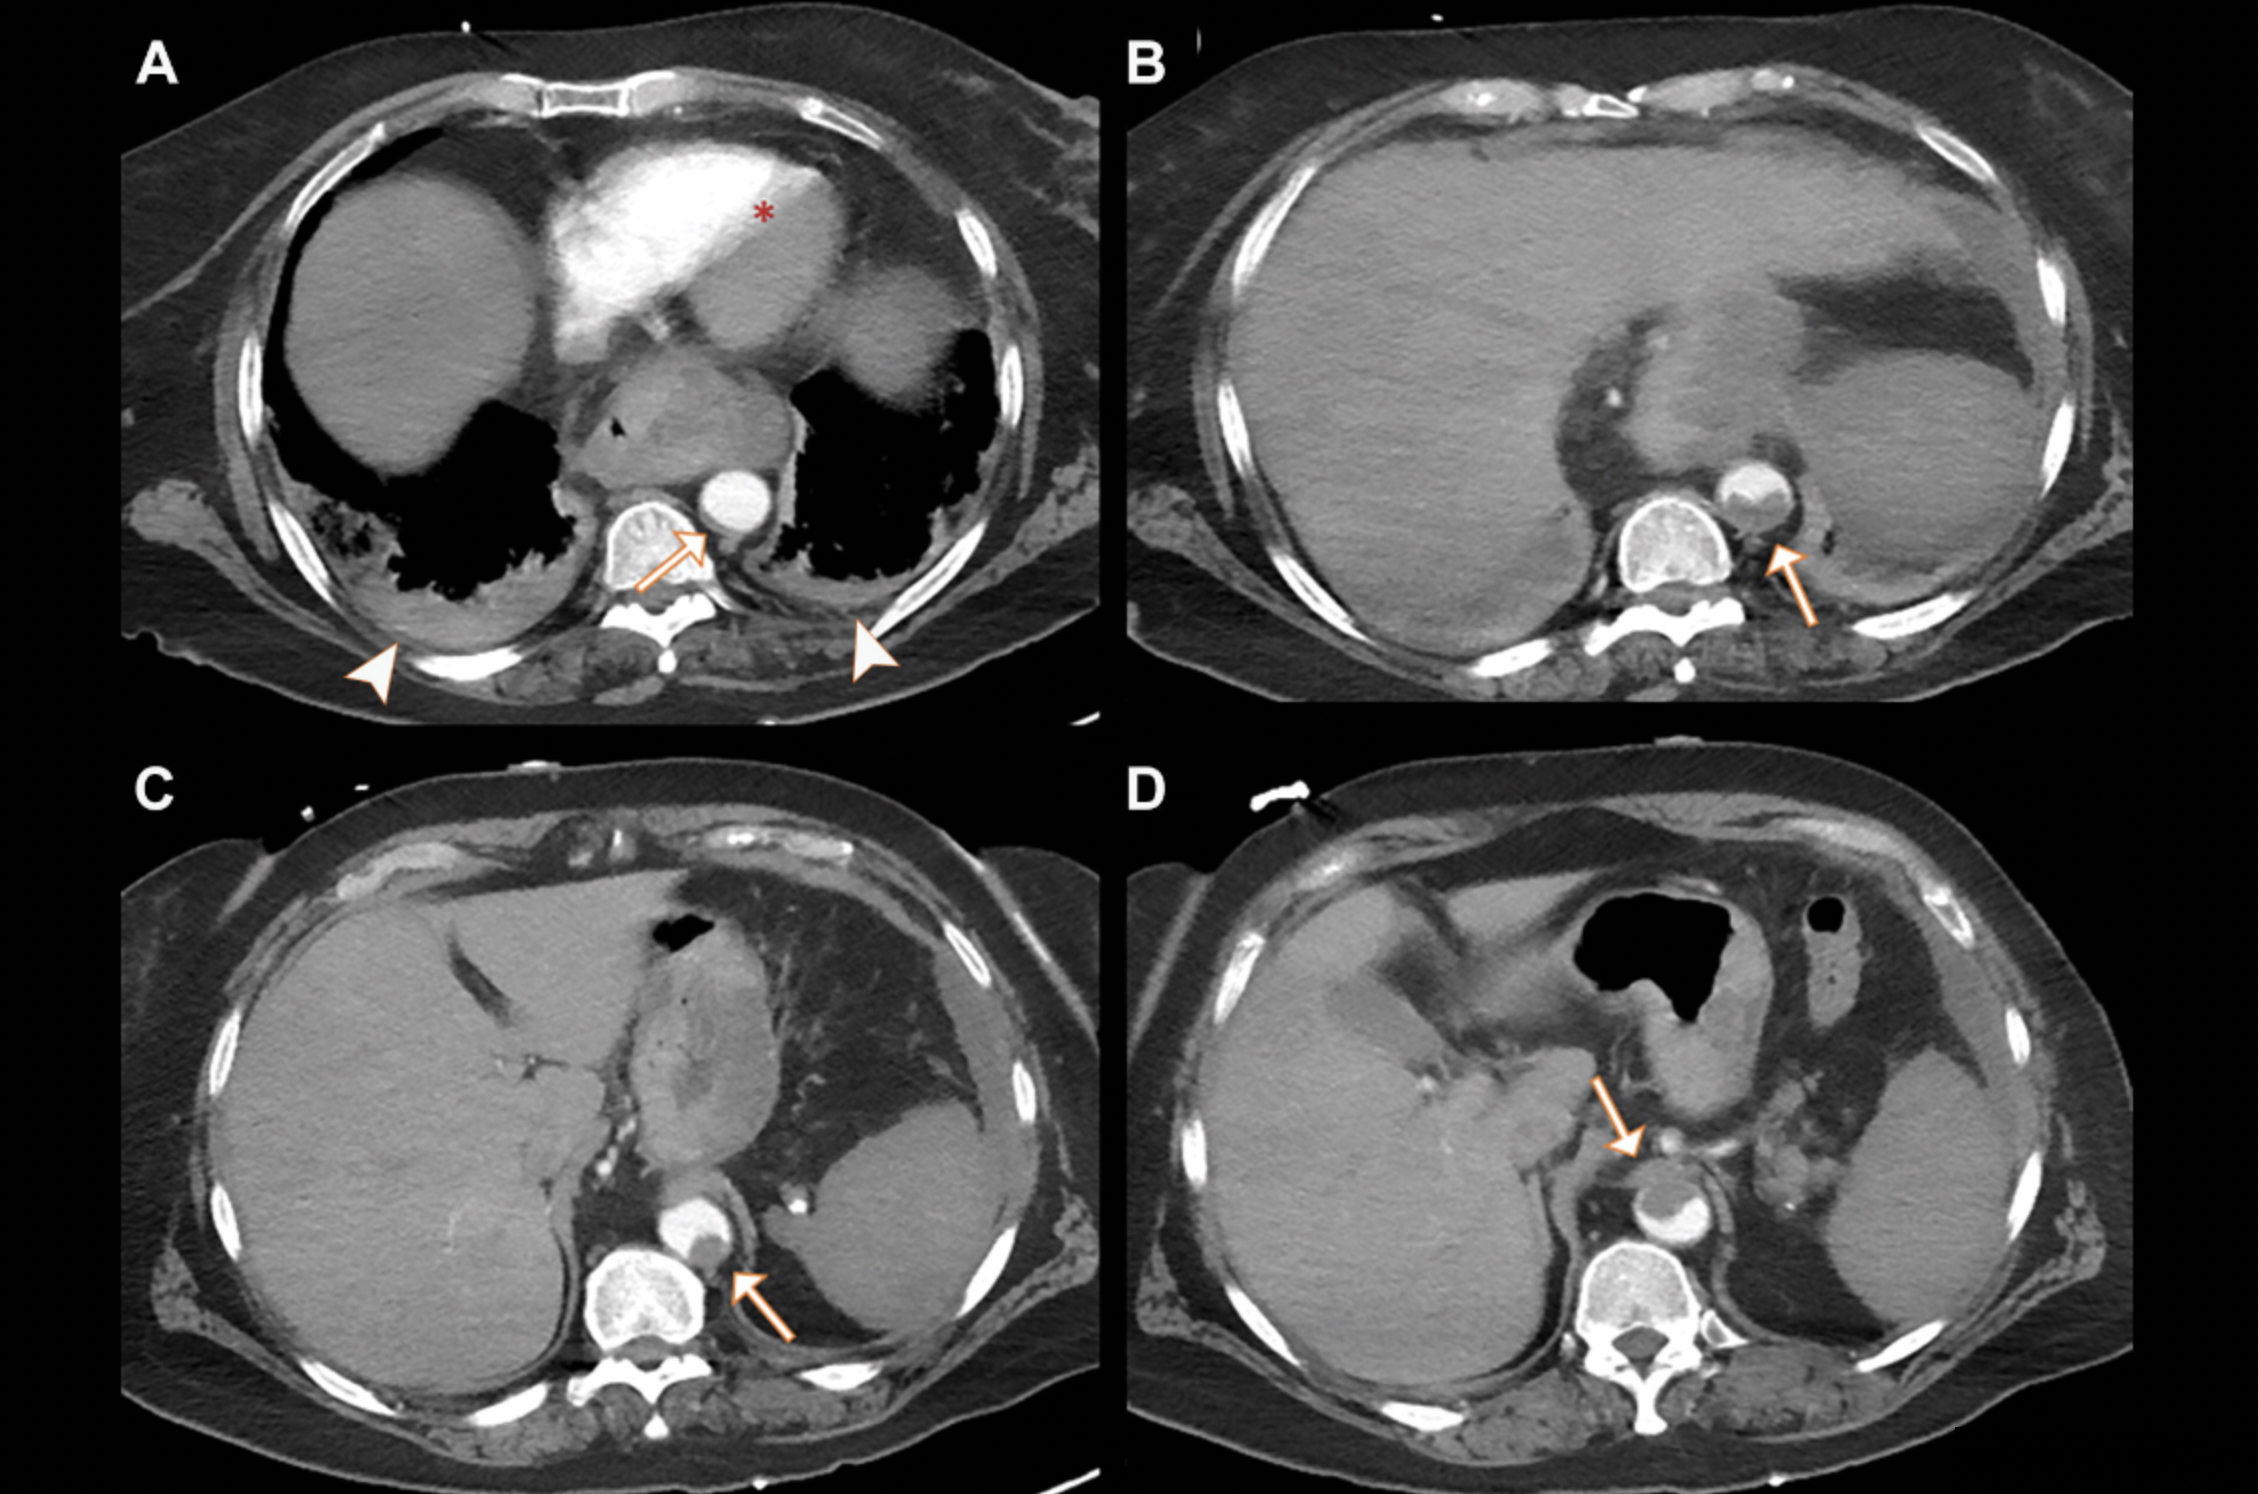
COVID causes increase risk of clotting. Example of a pulmonary embolism. CT pulmonary angiograms in a 77-year-old man with COVID-19 and a saddle embolus to pulmonary arteries (black arrow in A) extending into right and left pulmonary arteries (white arrows) in (A, B) axial and (C) coronal planes. Arrowheads show pulmonary changes associated with COVID-19 and possible lung infarction (black arrow in C). (D) Axial image at the level of the ventricles shows right-sided heart strain with interventricular septal flattening (*). Ao = aorta, LV = left ventricle, PA = pulmonary artery, RV = right ventricle. Image courtesy of RSNA. Read more.
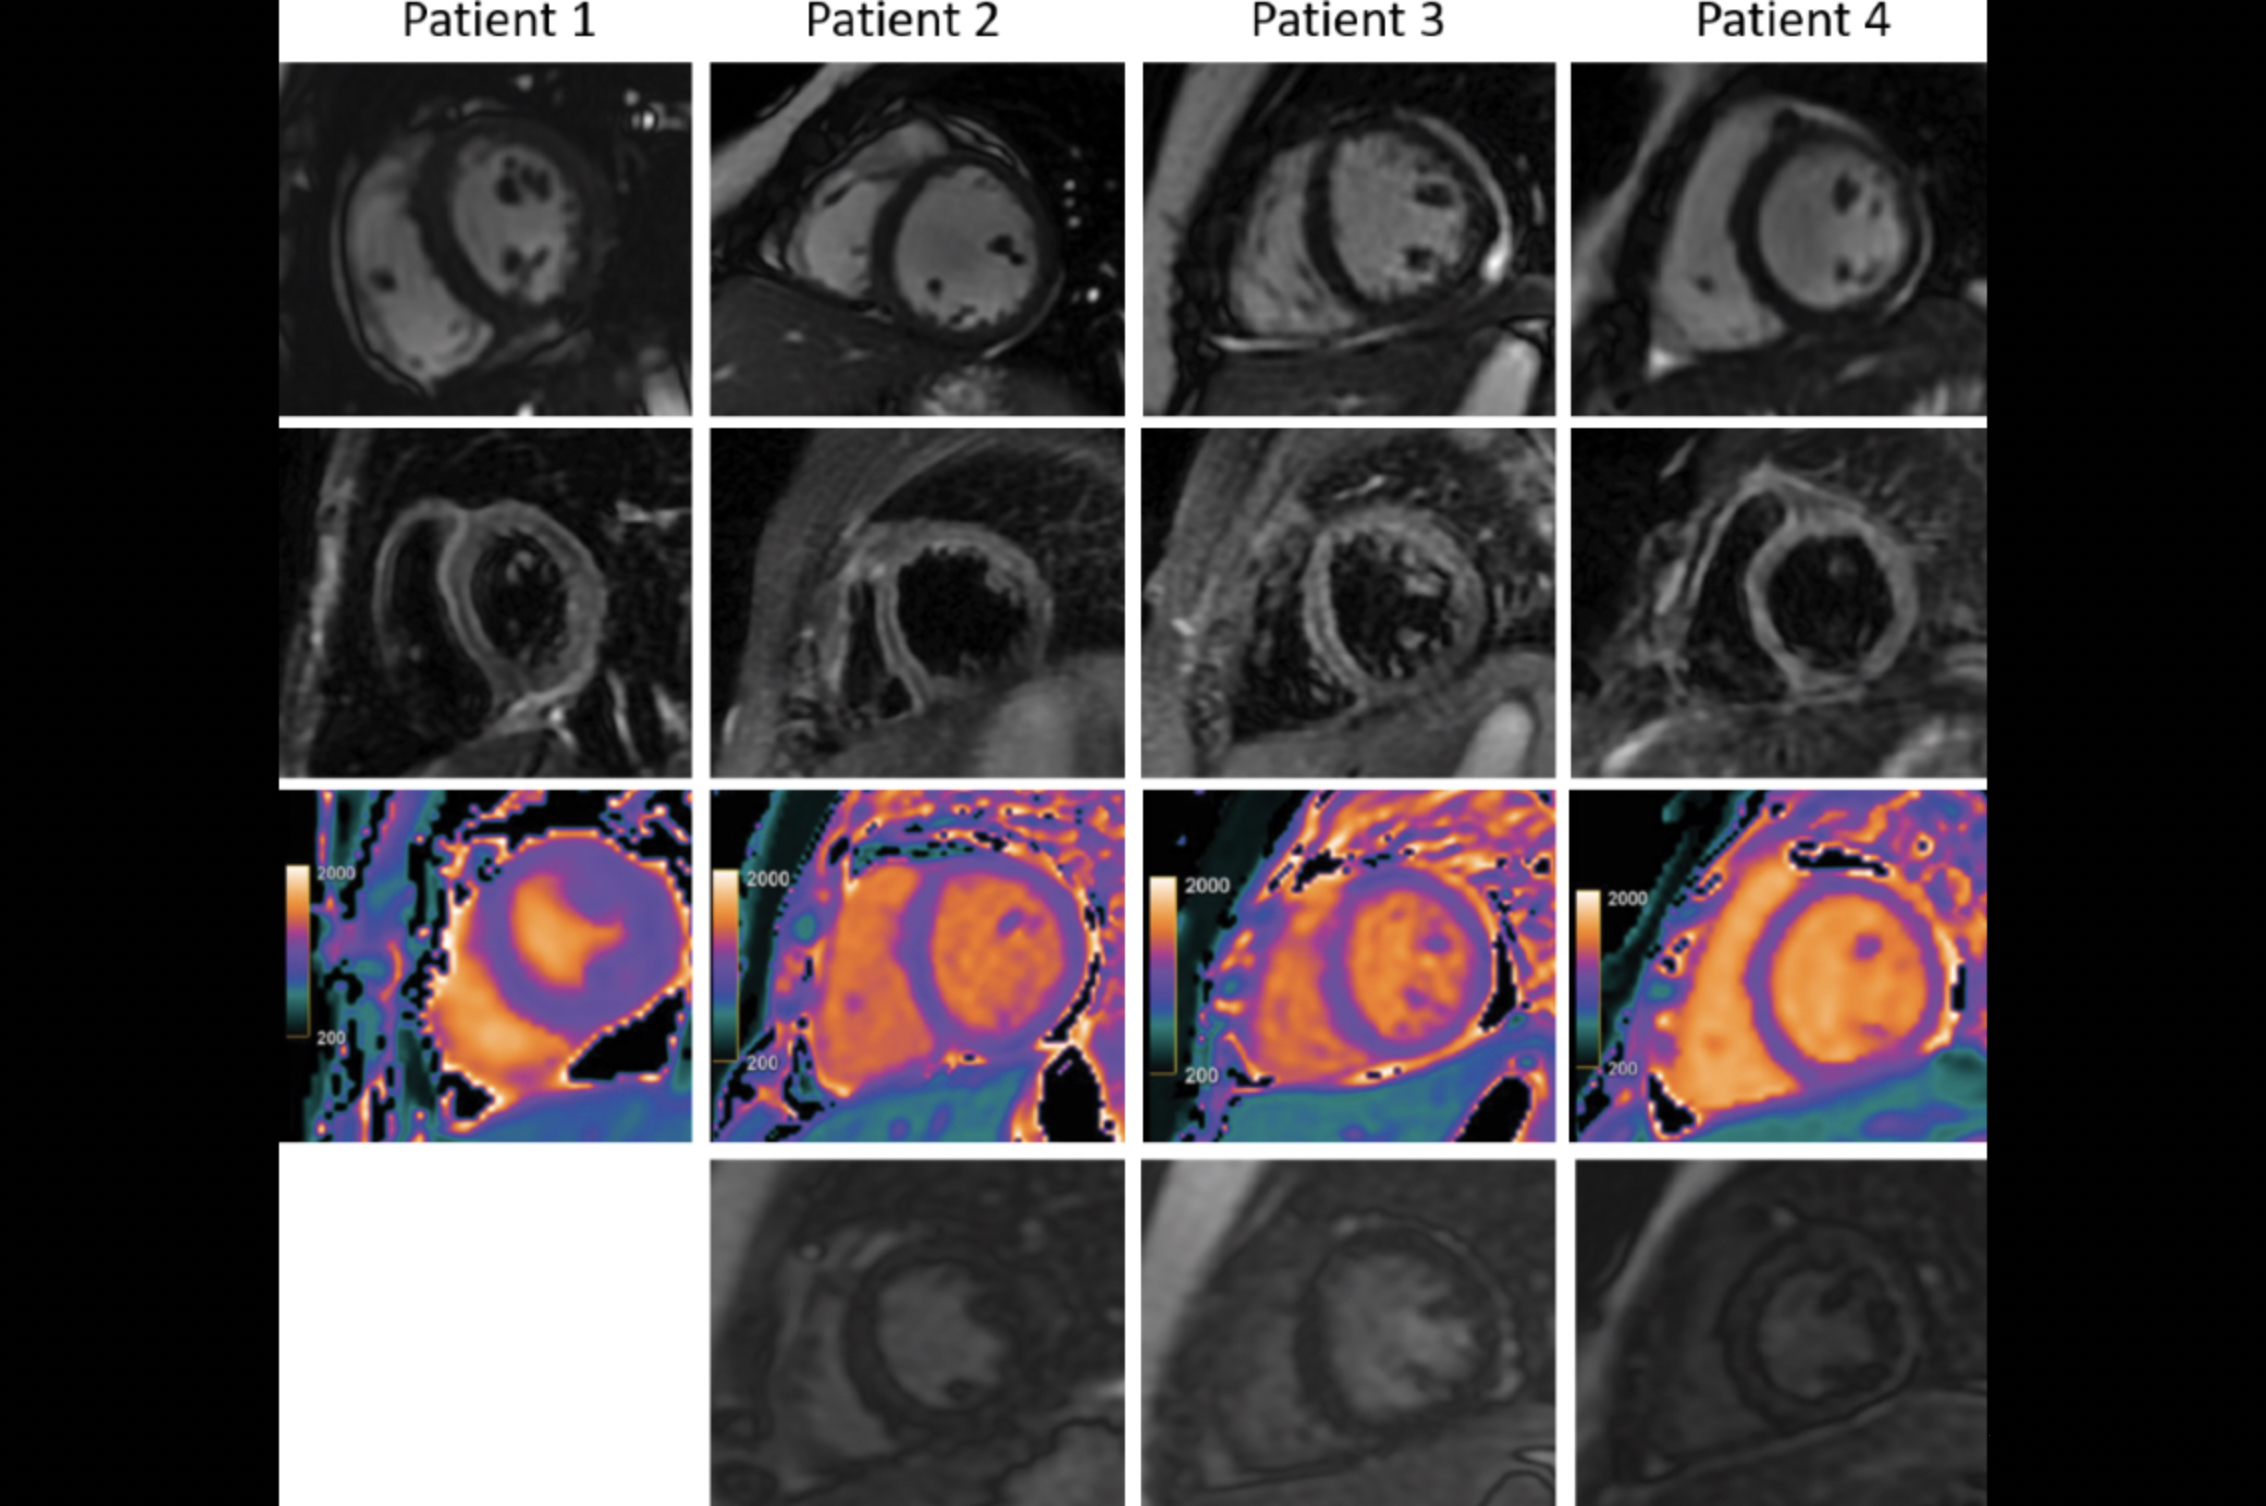
Cardiac MRI scans in four children with acute myocarditis from Multisystem Inflammatory Syndrome in Children (MIS-C) caused by COVID-19. Top panel demonstrates minimal pericardial effusion on cine images. Second panel demonstrates increased T2 short tau inversion-recovery signal intensity with average ratios between myocardium and muscle greater than 2 in patient 2 (12-year-old boy), patient 3 (11-year-old girl), and patient 4 (6-year-old girl). Third panel demonstrates abnormal native T1 mapping, which was greater than 1,100 msec in patients 2, 3, and 4 and normal in patient 1 (8-year-old girl). Bottom panel demonstrates absence of late gadolinium enhancement (LGE) in patients 2 and 3. Myocardial null times were recognized as too short in patient 4 but could not be repeated due to lack of further patient cooperation; however, review of Look Locker images and additional sequences revealed no LGE. Image courtesy of RSNA. Read more.
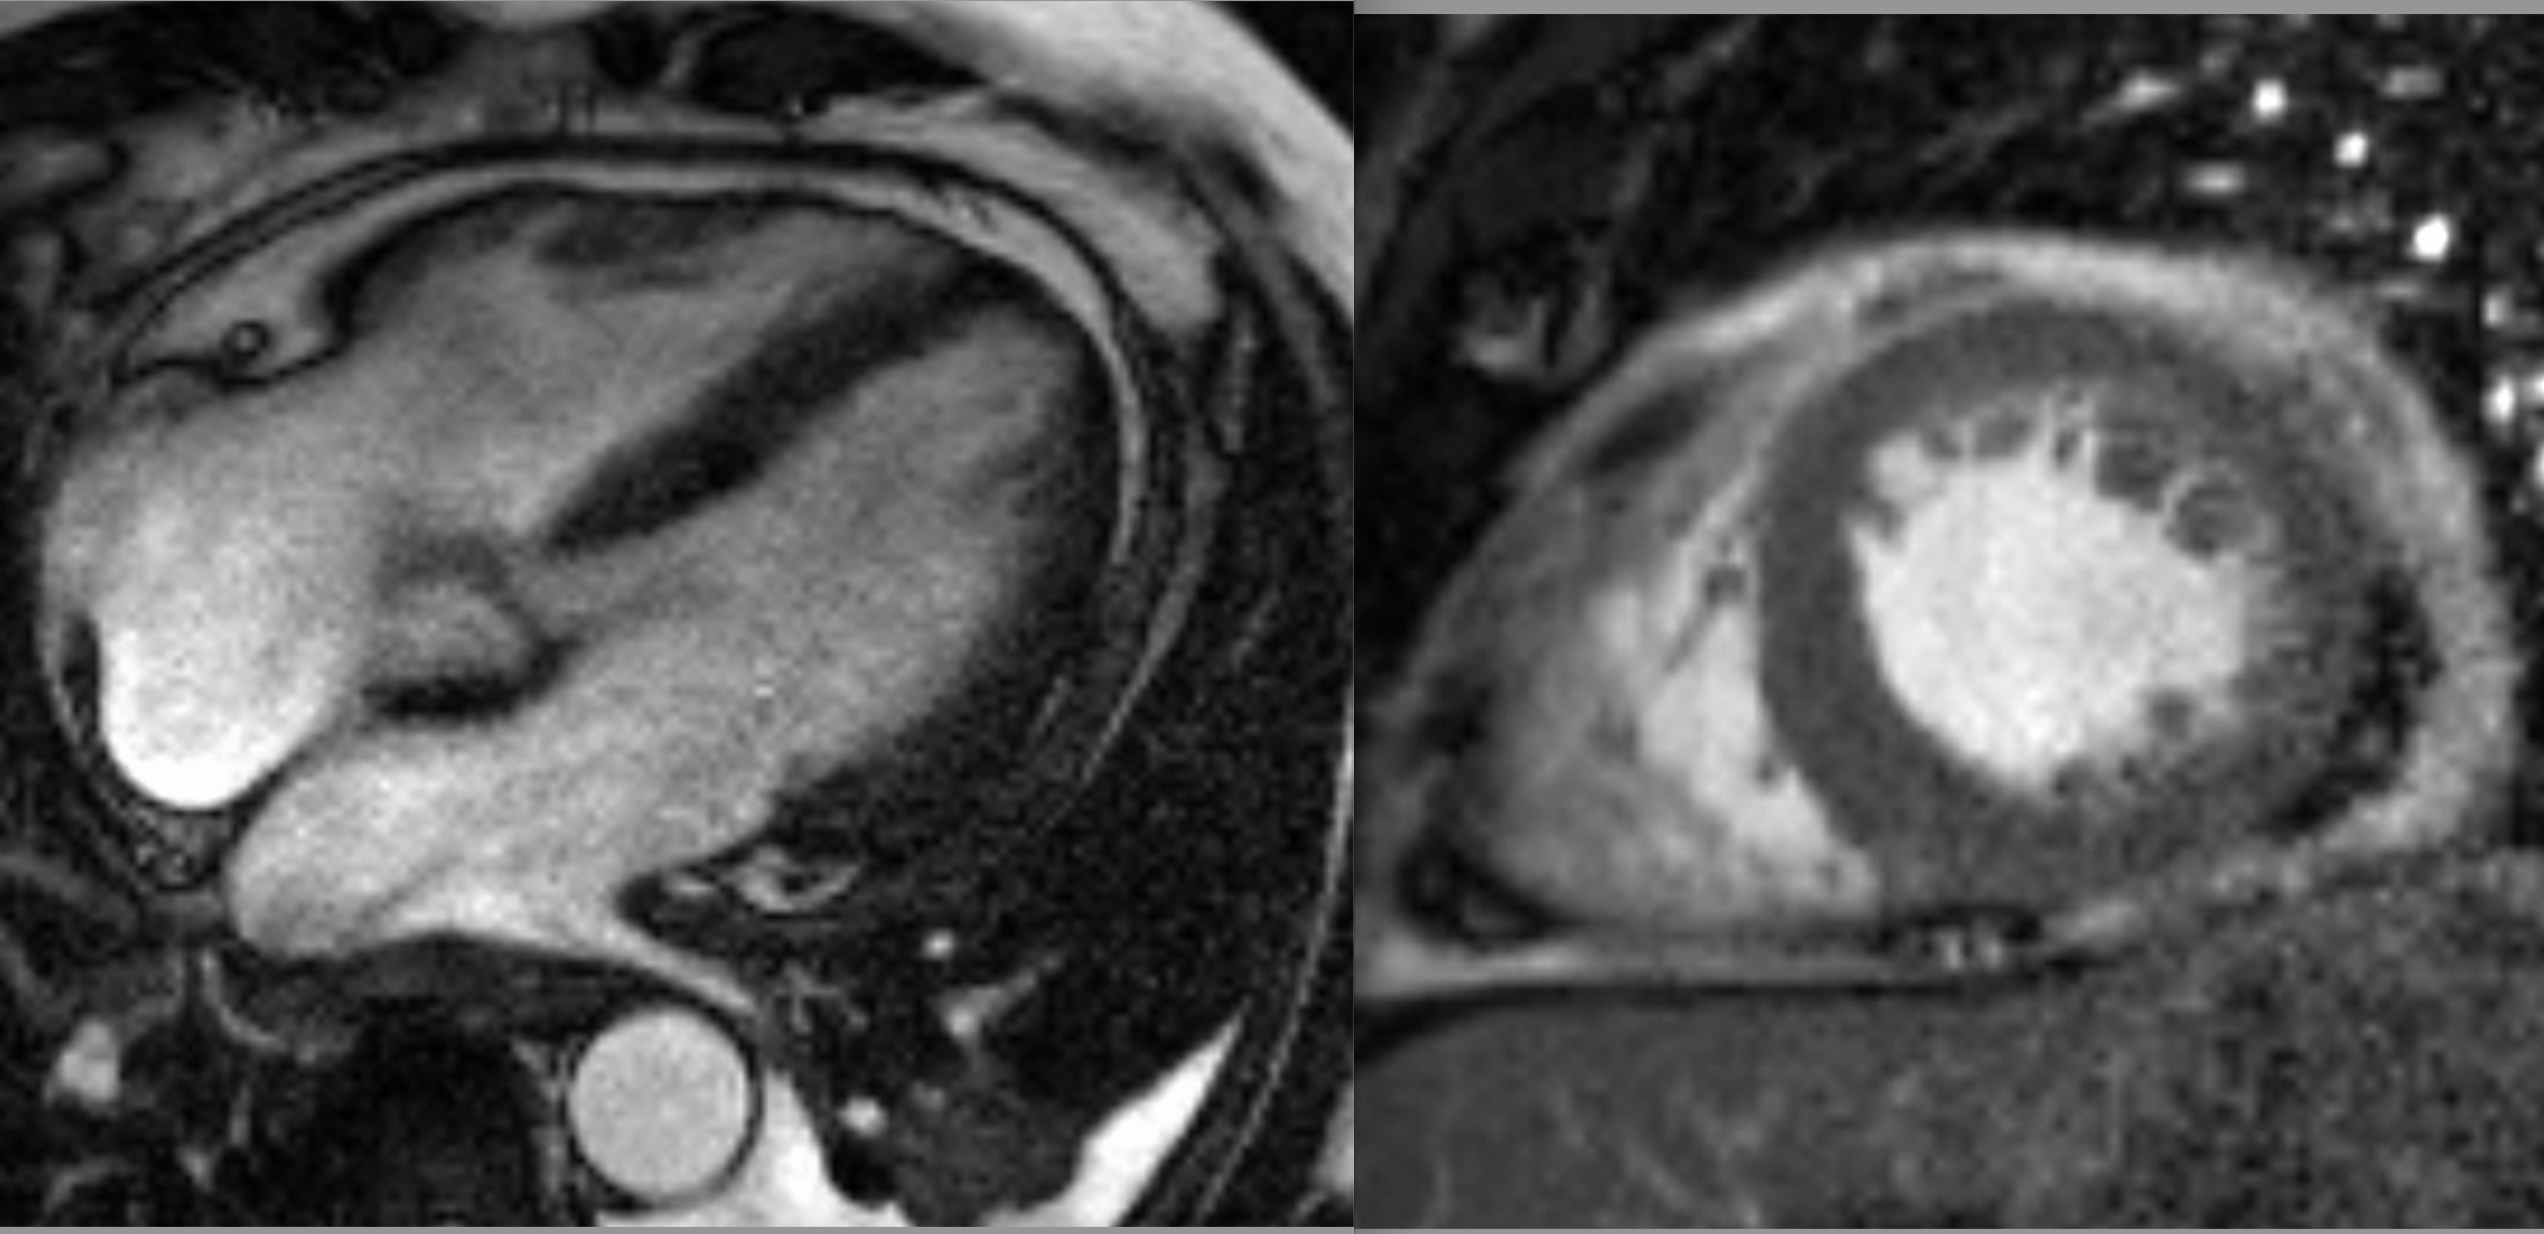
Cardiac MRI showing pericarditis from COVID in a 52-year-old male. Four chamber view demonstrating low normal biventricular systolic function and marked pericardial thickening with moderate left pleural effusion. Short axis image demonstrating low normal biventricular systolic function and marked pericardial thickening. He did not have significant past medical history, but recently had intermittent fevers, chills, dry cough, left scapular and pleuritic chest pain associated with exertional dyspnea for more than one month. He had three prior hospitalizations since his symptoms began. He tested positive for COVID antibodies. Images courtesy of Society for Cardiovascular Magnetic Resonance (SCMR). Read more.
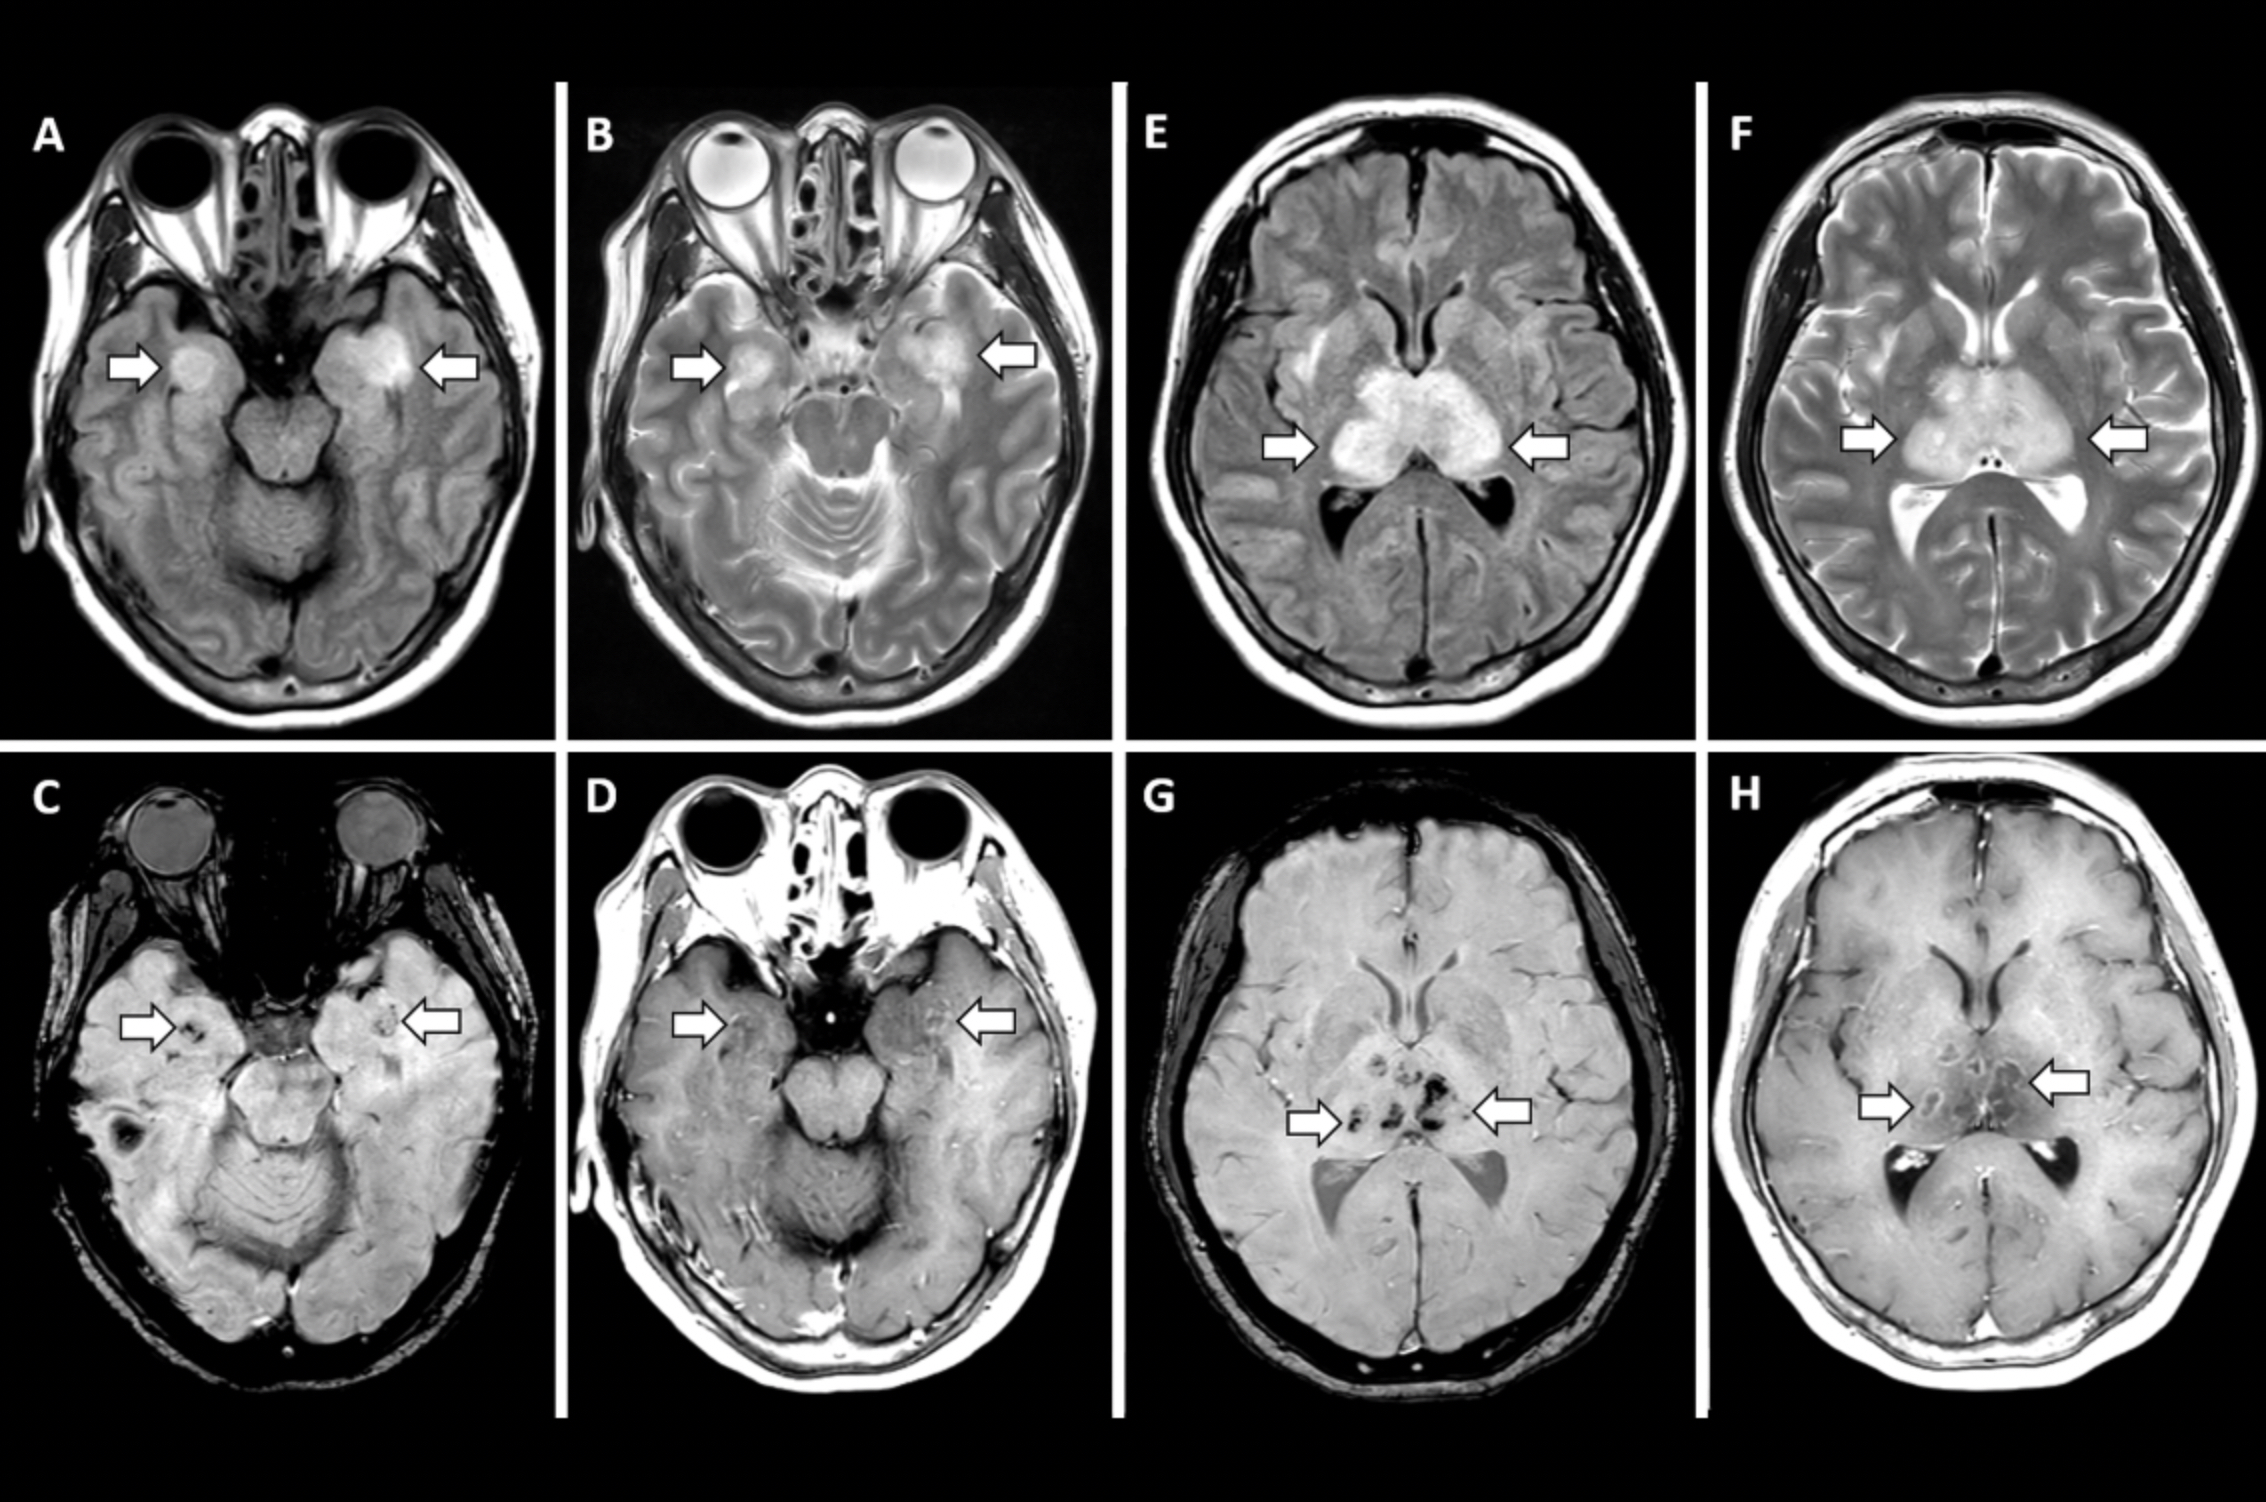
Acute necrotizing encephalopathy is a rare complication of influenza and other viral infections and has been related to intracranial cytokine storms, which result in blood-brain barrier breakdown but without direct viral invasion. Evidence suggests this also happens in severe COVID-19 cytokine storm syndrome, resulting in brain hemorrhages. A, B, E, F, T2-weighted fluid-attenuated inversion recovery MRI scans demonstrate hyperintensity within the bilateral medial temporal lobes and thalami (arrows), with evidence of hemorrhage indicated by, C, G, hypointense signal (arrows) on susceptibility-weighted images and, D, H, rim enhancement (arrows) on contrast material–enhanced images. Image courtesy of RSNA. Read more.
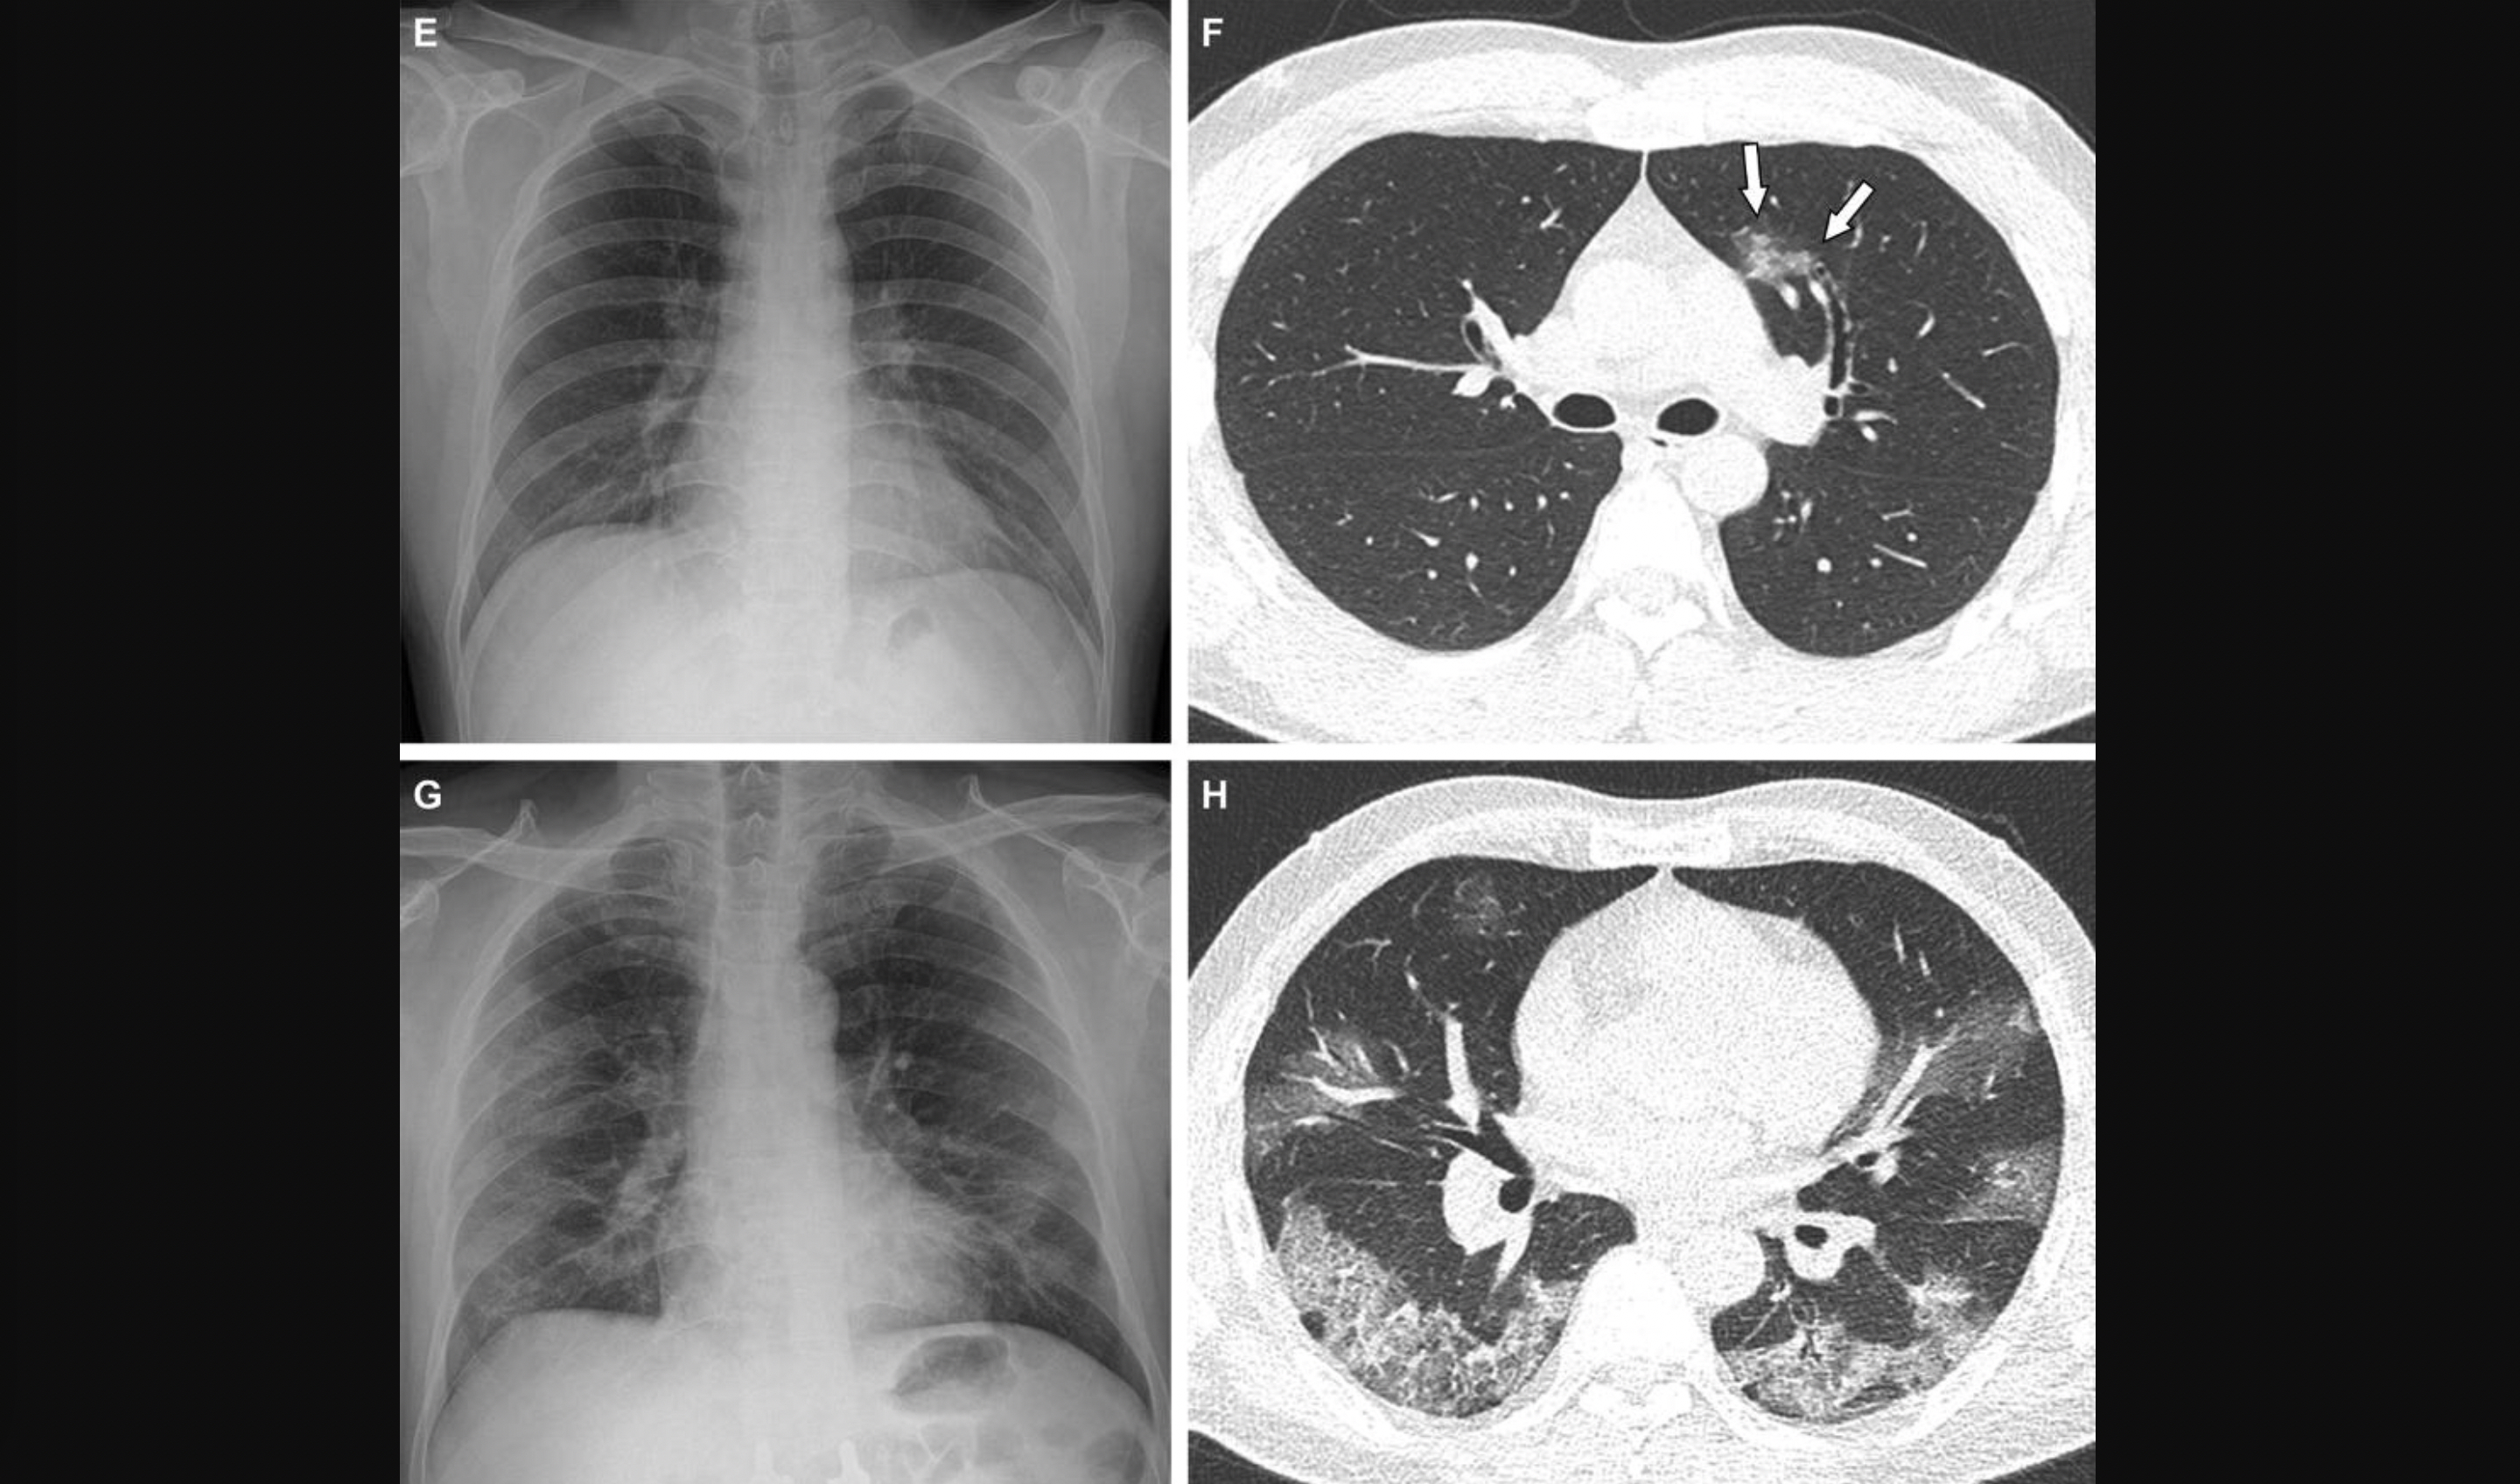
Representative cases showing pneumonia extents and patterns on chest X-ray (CXRs) and CT images in unvaccinated patients. (E and F) A 36-year-old male with no history of vaccination for COVID- 19. (E) CXR obtained at admission showing no abnormal opacification in either lung zone. CXR extent of pneumonia was scored as 0 (no evidence of pneumonia). (F) Axial chest CT image obtained on the same day showing unilateral ground-glass opacity with a nonrounded morphology and non-peripheral distribution in the left upper lobe (arrows). CT extent of pneumonia was scored as 1 (1-25% involvement) and this case was classified as indeterminate appearance of COVID-19 according to the RSNA chest CT classification system. (G and H) A 58-year-old male with no history of COVID-19 vaccination. He required supplemental oxygen on admission and was admitted to intensive care unit one day later. (G) CXR at admission showing patchy ground-glass opacities in both middle- to lower-lung zones. CXR extent of pneumonia was scored as 2 (>25% involvement). (H) Axial chest CT obtained on the same day showing multifocal ground-glass opacities with a crazy-paving appearance in bilateral lungs. CT extent of pneumonia was scored as 2 (>25% involvement) and was classified as typical appearance of COVID-19 according to the RSNA chest CT classification system. Read more. RSNA image
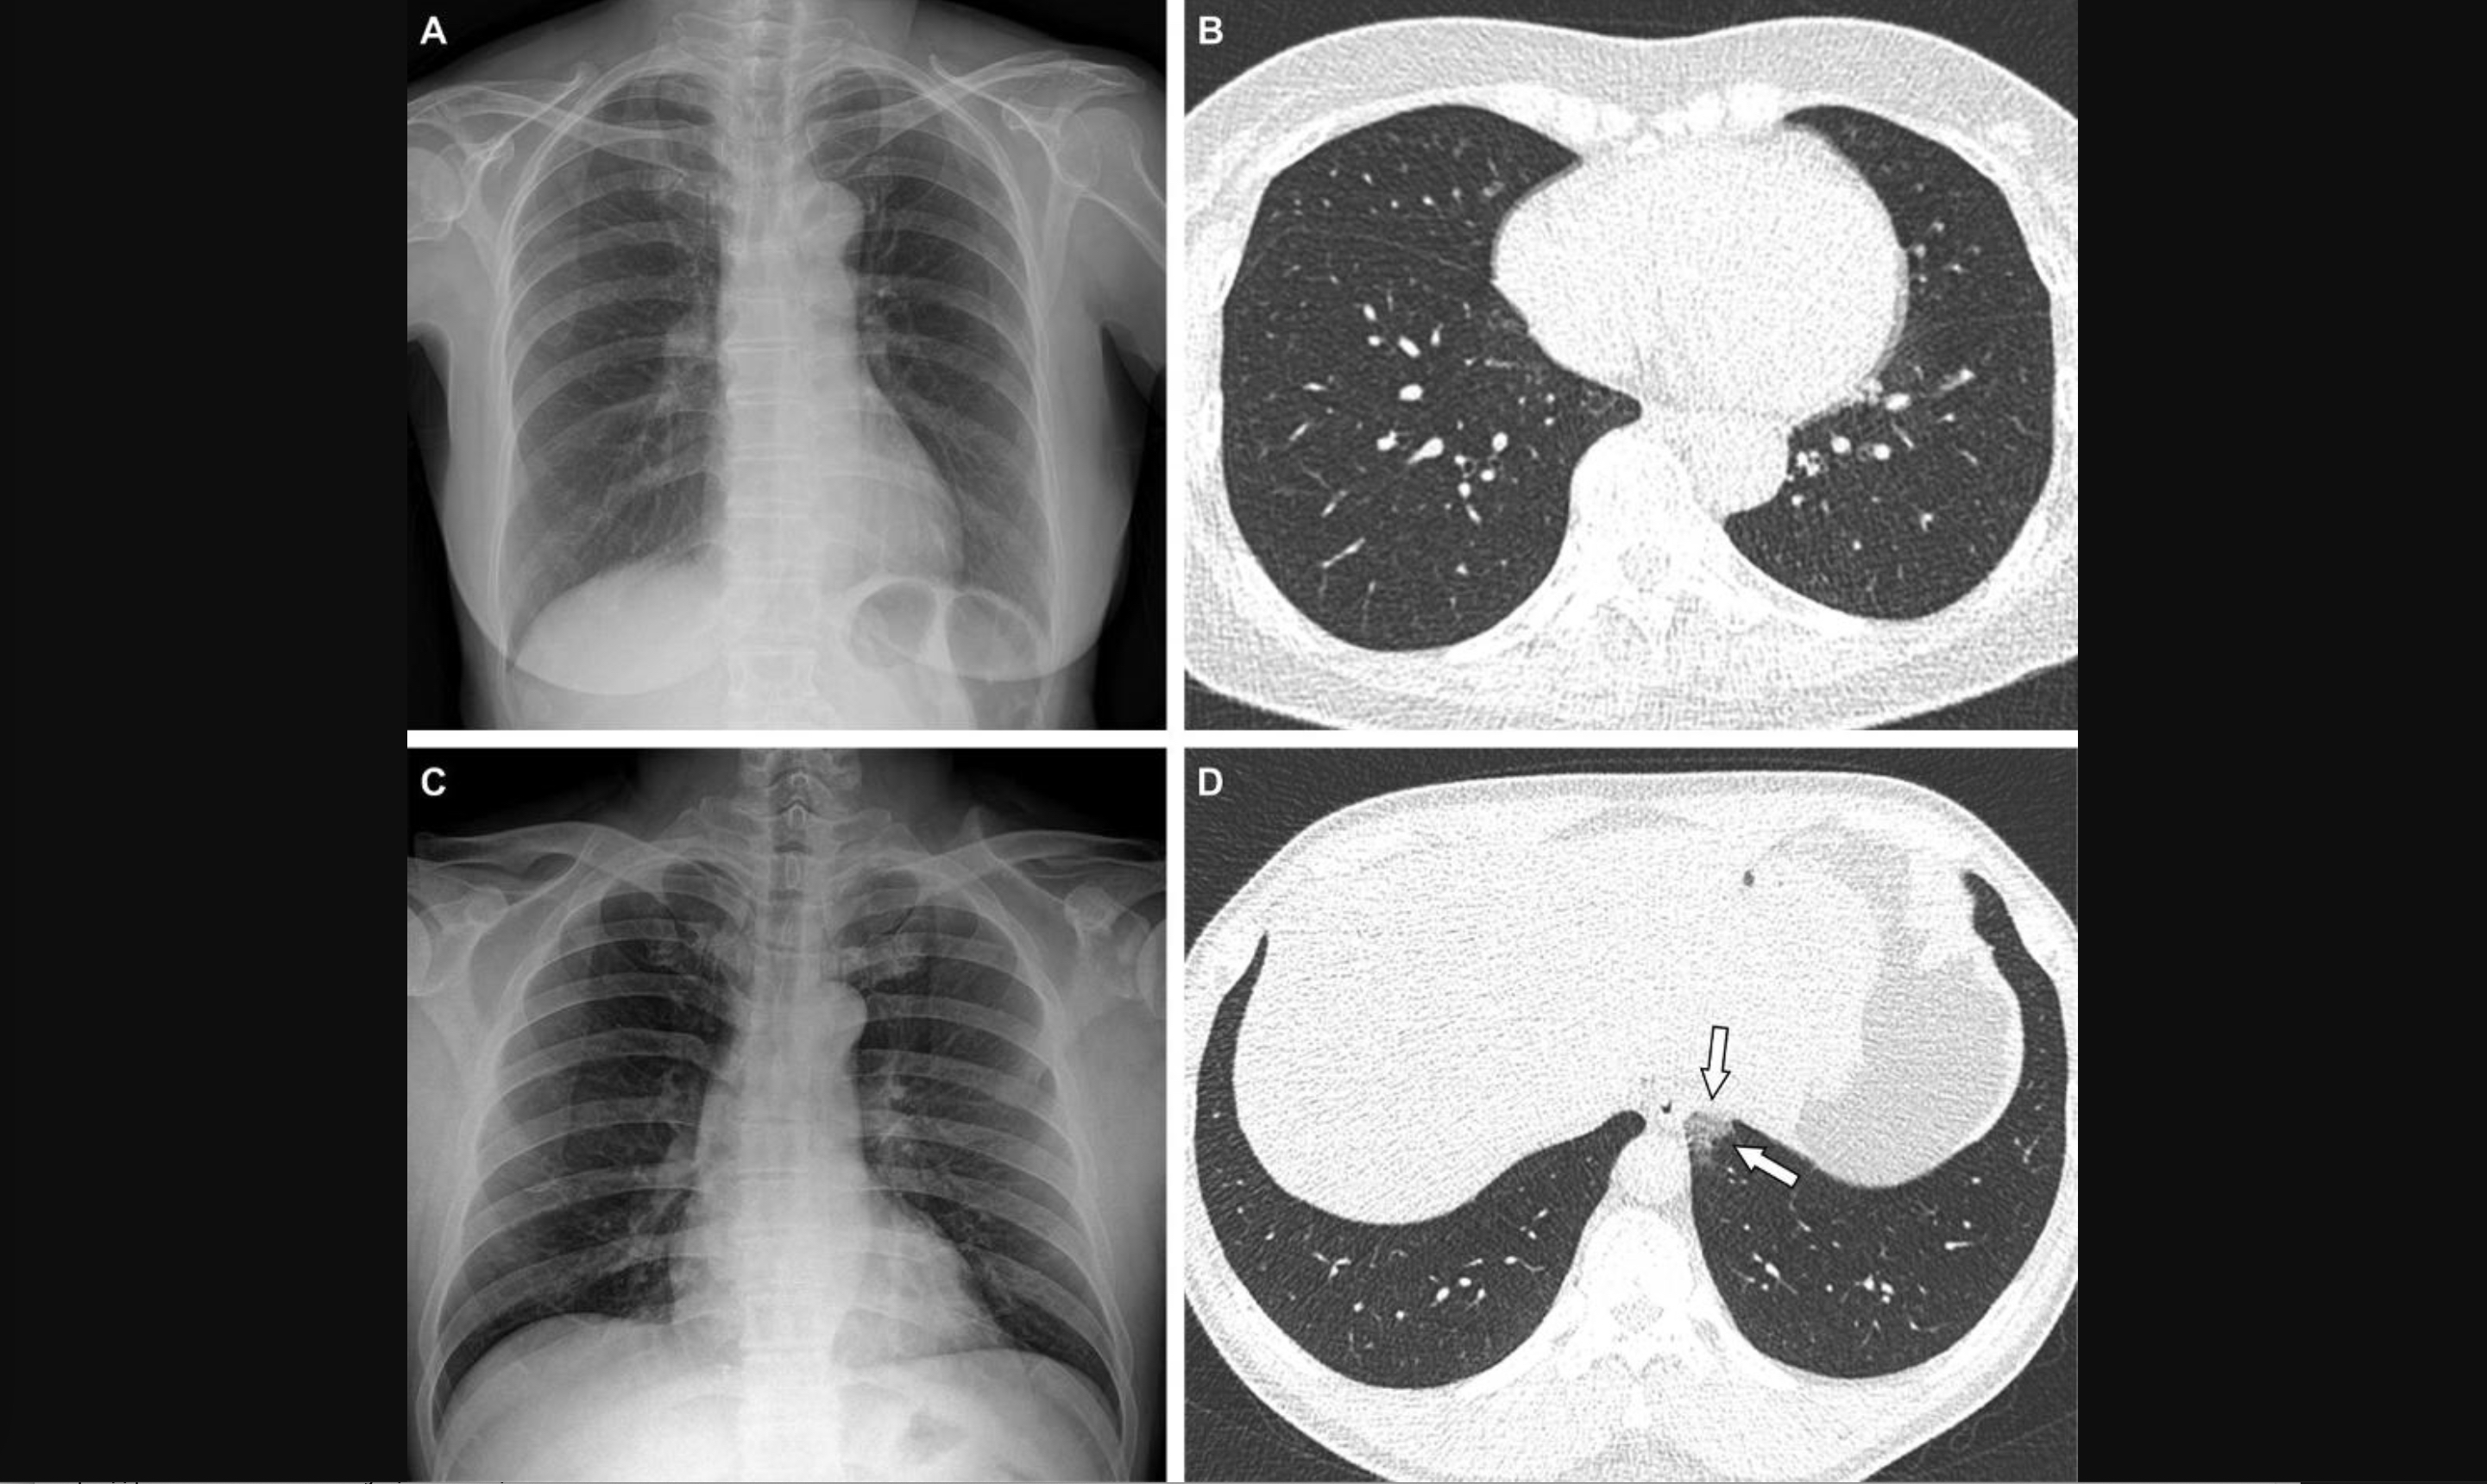
Representative cases showing pneumonia extents and patterns on chest X-ray (CXR) and CT images in COVID vaccinated breakthrough case showing lower COVID burden than unvaccinated patients. A 65-year-old female with breakthrough infection 2 months after a second dose of the Pfizer vaccine (fully vaccinated). (A) CXR obtained at admission showing no abnormal opacification in both lung zones. The CXR extent of pneumonia was scored as 0 (no evidence of pneumonia). (B) Axial chest CT image at the lower lobe level (obtained on the same day) showing negatively for pneumonia; CT extent of pneumonia was scored as 0 (no evidence of pneumonia). (C and D) A 48-year-old male with 1 month after a first dose of the AstraZeneca vaccine (partially vaccinated). The patient had no history of comorbidity. (C) CXR obtained at admission showing no abnormal opacification in both lung zones. The CXR extent of pneumonia was scored as 0 (no evidence of pneumonia). (D) Axial chest CT image obtained on the same day showing unilateral ground-glass opacity with a non-rounded morphology in the left lower lobe (arrows). CT extent of pneumonia was scored as 1 (1-25% involvement) and this case was classified as indeterminate appearance of COVID-19 according to the RSNA chest CT classification system. Read more. RSNA image

Long-COVID lung damage in children. A new analysis published in Radiology details signs of persistent pulmonary dysfunction in children who have recovered from a COVID infection or who are experiencing symptoms of long-COVID. Using low-field MRI, experts found reduced ventilated and perfused lung parenchyma (V/Q match) in the COVID group of patients compared to a group of healthy controls. Read more Image courtesy of Radiology.
A lung CT 3D rendering showing patches of ground-glass lesions caused by COVID pneumonia. Image from Siemens
. Nemours was one of the first hospitals to diagnose U.S. cases. Thacker and Shubhika Srivastava, MD, from Nemours did a video interview at AHA with Cardiovascular Business on the lessons learned from MIS-C cases.")
Pediatric cardiologist Deepika Thacker, MD, Nemours Hospital, shows the number and spikes in the COVID related illness Multisystem Inflammatory Syndrome in Children (MIS-C). Nemours was one of the first hospitals to diagnose U.S. cases. Thacker and Shubhika Srivastava, MD, from Nemours did a video interview at AHA with Cardiovascular Business on the lessons learned from MIS-C cases.
Additional COVID Medical Imaging Resources:
New Images of Novel Coronavirus SARS-CoV-2 from the National Entities of Health (NIH)
American College of Radiology (ACR) COVID-19 Clinical Resources for Radiologists
Radiologiocal Society of North America (RSNA) COVID Imaging Resource Page
American Roentgen Ray Society (ARRS) COVID Imaging Resource Page
Society of Nuclear Medicine and Molecular Imaging (SNMMI) COVID Resource Page
The Role of Medical Imaging in COVID-19
COVID-19 and Imaging: Why CT Scans and X-Rays Have a Limited Role in Diagnosing Coronavirus
Chest CT in COVID-19: What the Radiologist Needs to Know
COVID-19 Imaging: What We Know Now and What Remains Unknown
Library of Clinical Imaging journal articles on imaging COVID
Role of Imaging in Diagnosis and Management of COVID-19: A Multiorgan Multimodality Imaging Review
COVID-19 imaging: Diagnostic approaches, challenges, and evolving advances
Role of Imaging in Diagnosis and Management of COVID-19: A Multiorgan Multimodality Imaging Review
The Role and Challenges of Clinical Imaging During COVID-19 Outbreak
Related COVID Content:

Dave Fornell has covered healthcare for more than 17 years, with a focus in cardiology and radiology. Fornell is a 5-time winner of a Jesse H. Neal Award, the most prestigious editorial honors in the field of specialized journalism. The wins included best technical content, best use of social media and best COVID-19 coverage. Fornell was also a three-time Neal finalist for best range of work by a single author. He produces more than 100 editorial videos each year, most of them interviews with key opinion leaders in medicine. He also writes technical articles, covers key trends, conducts video hospital site visits, and is very involved with social media. E-mail: dfornell@innovatehealthcare.com